Rep:Mod:ZLY9512
Thermal expansion of MgO
Introduction
Thermal Expansion is a very common phenomenon. It is common knowledge that within a certain range of temperatures, when the temperature goes up some materials expand. some materials expand Some materials expand when the temperature rises. This is due to an increase in atom vibrations resulting in a greater separation between the atoms on a microscopic scale, and on a macroscopic scale leads to an expansion of the materials.[1] macroscopically makes a material to expand.[1] Although there are some materials which behave the opposite exactly the opposite, these specific cases will not be discussed here, certain cases would not be discussed here.
phenomenon. In this experiment, a simple MgO compound is studied to examine this expansive behaviour.
| Table 1: Representations of MgO unit cells (FCC) | |
|---|---|
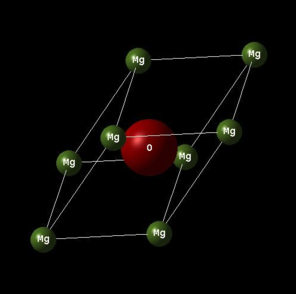 |
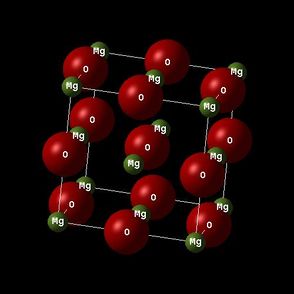 |
The vibrational state is simulated using a computer in order to model the thermal expansion of MgO. The thermal expansion coefficient α is given by Equation (1)[1]:

Two methods were used to calculate the thermal expansion coefficient, the Quasi-Harmonic approximation (LD) and molecular dynamics (MD). The former method is used to compute the vibrational energy levels of MgO. This method allows us to understand the phonon dispersion and the vibrational density of state (DOS). The latter method is used to simulate the vibrations as random motions of atoms inside a cell. It tells us how atoms respond over time under certain conditions. In this experiment, a General Utility Lattice Program (GULP) on the DLVisualize platform (Linux based) is used and by increasing the temperature, we can see how MgO atoms in a cell respond, what physical properties can be ascribed to this response and how it can be quantified.
Results and Discussion
Phonon dispersion and Density of States
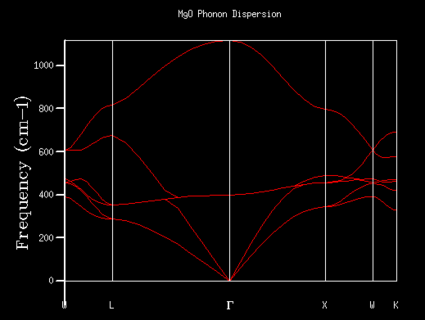
The phonon dispersion graph of MgO was produced by simulation to study the number of vibrational states which exist at k-points.
Followed by the local phonon DOS with different grid sizes.
| Table 2: MgO phonon DOS with variation of grid sizes | |||
|---|---|---|---|
| 1x1x1 |  |
2x2x2 | 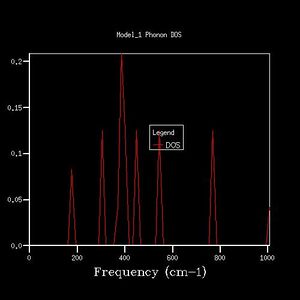 |
| 3x3x3 | 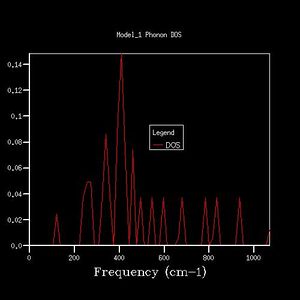 |
16x16x16 | 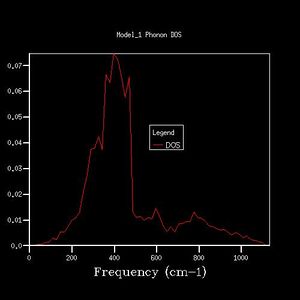 |
| 20x20x20 | 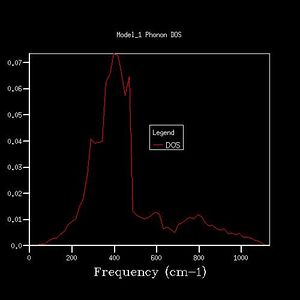 |
25x25x25 | 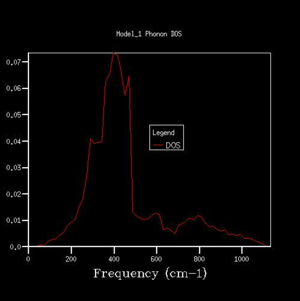 |
From the 1x1x1 grid four frequencies match the symmetry point L which indicates that the k-point is equal to (1/2, 1/2, 1/2). In the 1x1x1 grid DOS graph, the two lower frequency numbers are twice as large as the two higher frequency numbers. This matches the fact that in the dispersion curve at the symmetry point L the two lower frequency numbers are doubly degenerated. The DOS resembles the dispersion curves. It contains the information at certain frequency numbers with respected to a symmetry point.
By comparing different grid sizes' dispersion curves, we can conclude that when the grid size increases, the DOS increases because more points in k-space are taken and used to calculate the DOS. The larger the grid size, the finer, smoother the DOS curve becomes as there are more atoms being examined more details are given. Since the 20x20x20 graph is extremely similar to the 25x25x25 graph, for a reasonable approximation to the DOS, the 20x20x20 grid size is a sufficiently accurate approximation.
The optimal grid size 20x20x20 can be used for other crystals such as CaO. CaO unit cells have a similar size as that of MgO hence the same grid can be used, whilist for Faujasite or lithium metal, a size change is required.

Based on Equation 2, the periodic direction in the reciprocal space is inversely proportional to the periodic direction in the direct space. Hence for a larger cell such as Faujasite a smaller grid can be used while for a smaller cell such as lithium metal a larger grid is needed.
| Grid size | Free Energy/ eV | ΔA/ meV (with respected to 25x25x25) |
|---|---|---|
| 1x1x1 | -40.930301 | -3.188 |
| 2x2x2 | -40.926609 | -0.126 |
| 3x3x3 | -40.926432 | 0.051 |
| 4x4x4 | -40.926450 | 0.033 |
| 8x8x8 | -40.926478 | 0.005 |
| 10x10x10 | -40.926480 | 0.003 |
| 15x15x15 | -40.926482 | 0.001 |
| 20x20x20 | -40.926483 | 0.000 |
| 25x25x25 | -40.926483 | 0.000 |
The Helmholtz free energy varies with the grid size. As the size increases, the free energy increases and it reaches a maximum at 3x3x3 grid and then decreases.
In this table the energy difference is calculated between each grid size and the most precise grid size (in this case which is the 25x25x25 grid). For a calculation accurate to 1 meV, 1x1x1 could be used. For an acuuracy of 0.5 meV, 2x2x2 could be used and for an acuuracy of 0.1 meV, 3x3x3 could be used.
Quasi-Harmonic Approximation (LD)
| Temperature/ K | Helmholtz free energy/ eV | Lattice constant/ Š| Cell Volume/ ų |
|---|---|---|---|
| 0 | -40.900978 | 2.986563 | 18.836496 |
| 100 | -40.902420 | 2.986563 | 18.836494 |
| 200 | -40.909377 | 2.987605 | 18.856202 |
| 300 | -40.928125 | 2.989390 | 18.890025 |
| 400 | -40.958594 | 2.991630 | 18.932508 |
| 500 | -40.999436 | 2.994135 | 18.980112 |
| 600 | -41.049315 | 2.996821 | 19.031223 |
| 700 | -41.1071190 | 2.999644 | 19.085059 |
| 800 | -41.171892 | 3.002589 | 19.141318 |
| 900 | -41.243018 | 3.005636 | 19.199640 |
| 1000 | -41.319848 | 3.008785 | 19.260044 |
Quasi-Harmonic approximation suggests that the Morse potential can be used to represent the potential between atoms in a unit cell. This model is idealized by considering a perfect crystal. Each atom is an individual harmonic oscillator that does not interact with each other and that is being treated independently. Taken into account of the anharmonicity the vibrational energy can be found.[2]
The relationship between the Helmholtz free energy and temperature is given by Equation 3[2]:

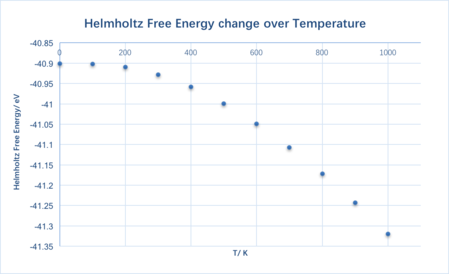
The Helmholtz free energy becomes more negative, i.e. decreases, when the temperature increases. It is not hard to see that the result matches Equation 3. As T increases, the entropy term becomes more positive, hence the free energy decreases.
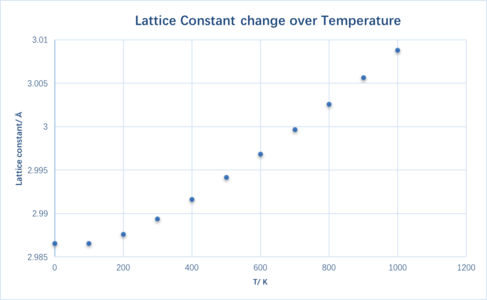

As expected, the lattice constant increases with temperature, as does the unit cell volume. At higher temperatures, atoms have a higher internal energy and hence the vibrational frequency increases. This causes a greater deviation from the static separation and therefore the material expands. However, in a diatomic molecule with an exactly harmonic potential the bond length does not increase with temperature as the time average interatomic separation remains constant.
Initially all three curves have a parabolic character, while at a higher temperatures they tend towards a more linear character. From Equation 1 and the gradient calculated from Figure 4 the thermal expansion coefficient is found to be 2.687x10⁻⁵ K-1. The literature value is 3.12x10⁻⁵ K-1 (at 300 K)[3]. The difference is 13% which is considerably large. Nevertheless it is good enough coming from an approximation.
As the temperature of MgO approaches the melting point, the phonon modes does not represent the actual motions of the ions well, simply because at the melting point the bond breaks and it changes the crystal structure which it is no longer perfect. This violates the approximation and hence the modes are not be able to represent the motions well.
.
.
Molecular Dynamics (MD)
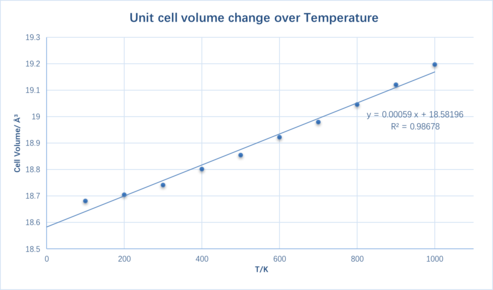
In this molecular dynamics method, a supercell containing 32 MgO units is used.
By doing a geometry optimization, the atomic position with a minimum energy is found and used to measure the lattice constant and the cell volume. Since the method is based on solving Newton's equations, the system is being treated classically[4]. A larger system is used to compromise the loss of its periodicity due to the nature of random atom movements.
Again using Equation 1 the thermal expansion coefficient is found to be 3.086x10⁻⁵ K-1. The difference is 1.1% which is considerably smaller compared to the quasi-harmonic model.
Figure 6 shows a comparison between the results of using the two different methods. Both curves have a very similar shape while the MD method gives a smaller value at the same temperature (within 0-1000 K). It is worth mentioning that with increasing temperatures the two curves are getting closer and closer.
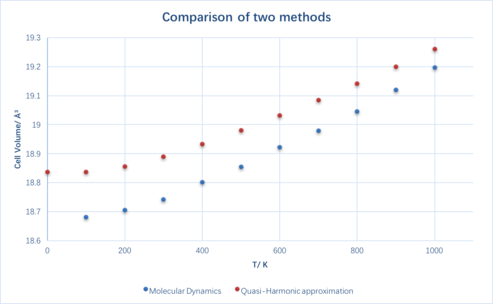
The foundation of the Quasi-Harmonic approximation is that the system is being treated quantum mechanically[2], whilst in the Molecular dynamic method the system is being treated classically. Due to this reason at very high temperatures (i.e. close to or beyond the melting point of the substance) the Quasi-Harmonic approximation no longer applies as the periodicity is being removed from the system due to the bond dissociation. On the contrary, Molecular dynamics applies at high temperatures as the method only considers the velocity of each individual atom. However, as can be seen in Figure 5, the molecular dynamic method was not able to give a value at 0 K simply because at 0 K atoms do not move.
.
.
.
.
.
.
.
.
.
.
Conclusion
The thermal expansion coefficient of MgO was found by two using different methods. The Quasi-Harmonic approxiamtion and the molecular dynamics. By optimising the grid size of the MgO crystal a fairly accurate size 20x20x20 was used and the MgO density of states were found. This optimal grid size was then used in the Quasi-Harmonic approximation for finding the relationships between the lattice constant, the volume and the Helmholtz free energy with temperature. From the relationship between the volume and the temperature the thermal expansion coefficient of MgO was calculated. Unlike this method, the molecular dynamic approach does not rely on finding the optimal grid size of MgO. Based on the calculations the molecular dynamic method shows a greater agreement with the literature value. Also if the measurement is conducted at a very high temperature, the Molecular dynamics method should be used as the Quasi-Harmonic approximation method does not work.
References
- ↑ 1.0 1.1 Paul A., Tipler; Gene Mosca (2008). Physics for Scientists and Engineers, Volume 1 (6th ed.). New York, NY: Worth Publishers. pp. 666–670. ISBN 1-4292-0132-0.
- ↑ 2.0 2.1 2.2 Martin T. Dove, Introduction to Lattice Dynamics, University of Cambridge Press, ISBN-13: 9780521392938.
- ↑ O. L. Anderson and K. Zou, J. Thermodynamic Functions and Properties of MgO at High Compression and High Temperarture. Phys. Chem. Ref. Data, 1990, 19, 69.
- ↑ Alder, B. J.; Wainwright, T. E. (1959). "Studies in Molecular Dynamics. I. General Method". J. Chem. Phys. 31 (2): 459. Bibcode:1959JChPh..31..459A. doi:10.1063/1.1730376.
