Rep:Mod:Z131415G
Free Energy and Thermal Expansion of MgO
This wiki page describes the outcomes from a computational exercise performed on MgO.
Introduction
Magnesium oxide, also known as Magnesia, is a white solid mineral, consisting of doubly charged ionic species, with a Face-centered cubic (FCC) crystal structure. As MgO has a FFC crystal structure, it can be completely described by one lattice parameter for any unit cell, be it the primitive or super. The primitive cell consists of rhombohedron with an oxygen atom in the centre and magnesium atoms capping each corner. Both conventional and super lattices have cubic cells with magnesium capping the corners and faces, and oxygen atoms on the edges and in the centre.
Magnesium oxide has numerous applications, one of the most notable is in medicine, where it relieves heartburn. Other applications include heat-resistant cables, references for white in colorimetry and as a fertiliser. Owing it its vast range of applications, from MgO’s thermal and optical properties, it is important that accurate descriptions and predictions can be made from theory, with the aid of computational methods.
The aim of the exercise was to calculate the Free energy, phonon dispersion reaction, density of state function and thermal expansion coefficient, whilst varying grid size, for MgO with computational software. The temperature and grid size was varied to elucidate how the Free energy changes, which was compared to literature to obtain a satisfactory grid size. Similarly, variations in temperature was employed to see the effect on MgO’s lattice parameter, which permitted the determination of its thermal expansion coefficient. Two methods of calculation were utilised to obtain these parameters, the merits of which were post-experimentally compared. Discussion of grid sizes, literature values of calculated parameters and limitations in calculations were also included.
Methodology
Calculations were performed, on a desktop computer, in RedHat Linux. DLVisualize (DLV) provided a graphical user interface for the molecular modelling General Utility Lattice Programme (GULP), which permitted calculation of the parameters described above. The DLV interface allowed intuitive construction and manipulation of crystals, which in this case was MgO; in addition, it provided an interface for outputs from calculations performed in GULP. GULP is a general purpose programme for calculations on condensed matter. The programme focuses on obtaining analytical solutions, from lattice dynamics with a variety of force fields, instead of from molecular dynamics (MD); however, despite this preference, GULP is capable of running MD calculations.
The quasi-harmonic approximation (QHA) was utilised to obtain volume-dependant thermal effects, some of which have been described above, from phonon-based solid-state physics. This model is based on a harmonic oscillator, where each possible bond length is approximated by a quadratic function; it is assumed to hold true for the lattice parameter, which is itself an adjustable. QHA assumes that the system can be described by a set of independently vibrating harmonic oscillators. A good approximation can be made at equilibrium geometries.
Molecular dynamics is a computational method for simulating motions of atoms with Newtonian mechanics from interatomic forces. For these calculations to be performed, an initial set of positions and velocities must be provided. These values are usually obtained from ideal structures or generated randomly with some constraints to ensure reasonable descriptions of the system. MD calculations propagate, from these initial conditions, by iterating over an algorithm. The iterative process occurs with a defined time step between frames; the number and interval of the time step determines how detailed, and therefore, how computationally expensive a simulation becomes. Initially the algorithm computes the applied forces, which permits calculation of the acceleration of atoms, from Newton’s second law. New velocities and positions of can be determined from equations of motion with this newly obtained information.
Thermal expansion coefficient () is an intrinsic property of MgO, which relates the change in volume with respect to temperature, at constant pressure. Equation 1 describes the thermal expansion coefficient; where , , and are the thermal expansion coefficient, initial volume, volume and temperature, respectively.
Results and Discussion
Internal Energy and Lattice Parameter of MgO from QHA
Three different types of MgO cells were used in the QHA and MD calculations; these were the primitive, conventional and super cell. The primitive and conventional can be seen in figures 1 and 2, respectively.
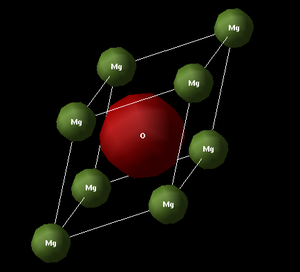

Calculation of the lattice parameter and Free energy of MgO, for the primitive cell, was performed first with QHA. As the number of atoms in each cell is known, the Free energy of any cell can be obtained from multiplication of this unit cell. It was found that the Free energy of the conventional unit cell was 40.9 eV. The lattice parameter of the primitive cell was found to be 2.11 Angstroms; conversion to the lattice parameter of the conventional cell is achieved from pythagorus theorem, which yields a value of 4.21 Angstroms.
Phonons and Free Energy from Q-HA and MD
The phonon dispersion graph, seen in figure 3, displays vibrational frequency, which is related to the energy of vibrations by equation 2, as a function of K-points in reciprocal space. There are two types of branches in a phonon dispersion relation: acoustic and optical. The former has frequencies in the acoustic region; whereas, the latter has frequencies which reside in the optical region of the electromagnetic spectrum (EM). MgO, a semiconducting mineral, mainly has phonon lines in the acoustic region, with one that reaches the optical region.
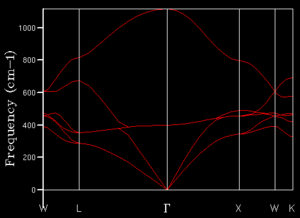
From the phonon dispersion curves, the number of available states at each K-value can be determined. This is achieved by taking a specific frequency and tracing across all K-points; the number of lines encountered provides a measure for the number of available states at that energy. The number of states can then be plotted as a function of frequency to obtain a density of states (DOS) relation. No information is provided with regards to which states are populated, however; the population of the states would be described by a Boltzmann distribution. Large numbers of K-points sampled in this manner produce a detailed density of states graph, which is desirable for a realistic description of the DOS. It can however, be performed for any number of K-points; the number will chosen is a compromise between accuracy and computational expenditure.
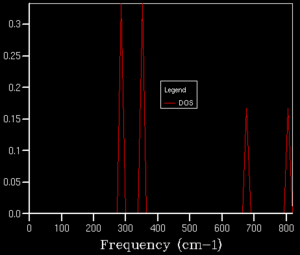
A grid size of 1x1x1 corresponds to a single K-point. From comparison of the DOS and the phonon dispersion graph, seen in figures 3 and 4 respectively, it is evident that L is the K-point sampled. This conclusion was drawn from the fact that there are four peaks, in the DOS, which corresponds to four lines in the phonon dispersion graph. Furthermore, as four acoustic lines converge to afford two acoustic lines, it is clear that two of the peaks should have twice the intensity, owing to their degeneracy. A label was given to this K-point as it is has high-symmetry in Brillouin space. This grid size did not provide a satisfactory description for the actual distribution of states in MgO.
[[File:MgO_ZG_DOS_TWO.png|thumb|border|left|middle|Figure 5. Density of states for 2x2x2.]
Density of states calculations were performed for grid sizes from 1x1x1 to 32x32x32, where the next grid size was obtained from multiplying the previous by a factor of two. Grid sizes of these sizes were chosen as they can be broken down and simplified from symmetry by the computer; the same can be achieved with multiples of three, but five is significantly more computationally expensive. It was evident that, at least for a small grid size, as the grid sizes increased, the number of peaks in the grid size increased and the intensity of peaks decreased. A 2x2x2 grid, seen in figure 5, provided a similar level of detail regarding the density of states as that of 1x1x1. This grid size still contained identifiable peaks that correspond to lines in the phonon dispersion graph. As a 2x2x2 grid has four K-points, there is a superposition of multiple K-points.
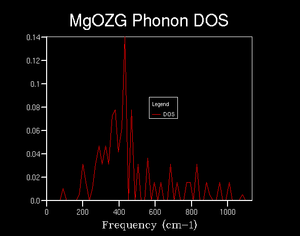
Once a grid size of 4x4x4 was reached, see figure 6, it was evident that some structure in the density of states started to appear. A maximum in density appeared at just over 400 wavenumbers, with tails in either direction. The tails of the distribution were not symmetrical, however; towards lower wavenumbers, there was initially a large reduction in states, which essentially reached zero at the origin. Whereas, towards higher wavenumbers, there was a smaller reduction in densities, over a larger wavenumber range, which resulted in a plateau. This distribution of states was expected from the phonon dispersion graphs denser acoustic region.
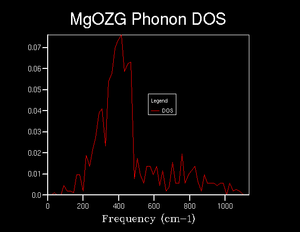
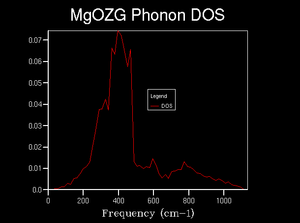
As the grid size increased further, between 8x8x8 and 32x32x32, which can be seen in figures 7 through 9, there was no significant change in general structure of the density of states. However, increasing the grid size resulted in the density of states smoothing out, with fewer large changes in the density for wavenumbers that were relatively close, where they should be relatively similar.

It was found that a grid size of 8x8x8 would estimate the general structure of the density of states adequately. As there are still points, in the 8x8x8 grid, where the density of states abruptly reduces to zero, when it shouldn’t, it could not be used as the minimum optimal grid; the 16x16x16 was chosen instead. As the 16x16x16 grid size, which can be seen in figure 8, is essentially the same as that of the 32x32x32, it was chosen for efficiency.
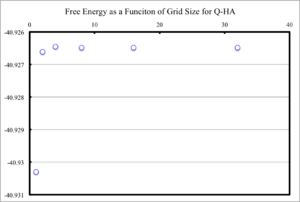
Figure 10 displays Free energy as a function of grid size. It is clear that after a grid size of 4x4x4 was reached, essentially no changes in Free energy occurred. However, for small grid sizes, between 1x1x1 and 2x2x2, an overestimation of how negative the Free energy occured. This overestimation is small however, with the 2x2x2 grid being 1meV out from the computational converged value. A 4x4x4 grid calculates the Free energy to within 0.1 meV, and therefore also 0.5 meV, of the computationally converged value for a large grid. For grid sizes between 4x4x4 and 8x8x8 there is a slightly underestimation in how negative the Free energy was. However, this underestimation is not significant, and the Free energy of MgO can reliably be calculated for grid sizes of 8x8x8.
Free energy was plotted as a function of temperature and displayed in figure 11 for Q-HA and MD calculations. It is clear that, for the Q-HA calculation, the Free energy of MgO becomes more negative as temperature increase; whereas,the MD calculation increases in energy with temperature. There is approximately a quadratic fit for the Free energy in the Q-HA, but linear increase is observed for MD.
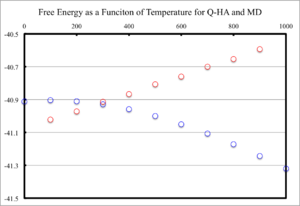
These different changes in free energy can be explained by considering their energy temperature dependance. MD calculations are governed by Newtonian mechanics, which states that the total energy of the system can be described by the sum of the potential and kinetic energy of the atoms. This energy relation can be seen in equation 3; where , and are the total energy, kinetic energy and potential energy, respectively. The kinetic energy is given by equation 4 ( and are the mass and velocity, respectively) and can be related to the temperature through equation 5 (, , , and are the degrees of freedom, number of atoms, Boltzmanns constant and temperature, respectively). Therefore, it is expected that, as the temperature is increased, the amount of kinetic energy increases and so does the total. Furthermore, it can be seen, from equation 6, that there is a linear relationship between total energy and temperature, which was observed in figure 11.
Q-HA is described by thermodynamics, which relates the free energy, be it Gibbs or Helmholtz, to temperature by a negative product of temperature and entropy. Equation 7 displays the Gibbs free energy as a function of enthalpy (), entropy () and temperature (). Hence, as entropy and temperature are positive, there is a decrease in Free energy with an increase in temperature. Entropy is also a function of temperature, which is why no linear relationship is observed for QHA.
Literature reports the Free energy of MgO, under standard conditions, at a value of -596.4 KJ mol-1.[1] The value obtained from computation, with QHA at 300 K, had a value of -3948.8 KJ mol-1. MD calculations produced a value of -1309.2 KJ mol-1 at the same temperature. Clearly, both of these calculations are not accurate to the same order of magnitude. Both of the methods predict the Free energy to be less negative than experiment. These large differences in Free energy can be attributed to a number of assumptions made by these calculations. Some of the limitations of which shall be described at the end of the report.
The optimal grid size, calculated earlier, might not be sufficient for other materials, however. In a similar metallic oxide, with the same lattice type, take calcium oxide, for example, the 16x16x16 grid might also be optimal. As CaO has a slightly larger unit cell than MgO (4.82 Angstroms for conventional),[2] the reciprocal space will be slightly smaller. Therefore, taking a 16x16x16 grid would produced a slightly more detail density of states plot, but not so much to warrant a smaller grid size. CaO and MgO are both ionic solids composed for doubly charged ions. Hence, there should be no effect from the bonding on grid size.
It was found that a grid size of 8x8x8 was sufficient to find the Free energy of MgO. As CaO would require essentially the same grid size, it could be assumed that a 8x8x8 grid would be satisfactory for calculation of the Free energy of CaO.
For a zeolite, such as faujasite, there is a significantly larger unit cell, owing to its complicated porous structure; the space group of faujasite is FCC with a lattice constant of 24.71 Angstroms. [3] Owing to the significantly larger unit cell, the reciprocal space is almost 6 times smaller than that of MgO. Therefore, a grid size of 3x3x3 would suffice for computation of the density of state to the same level of detail.
It was found that a grid 6 times smaller than the one used for MgO would be adequate to produce a similar density of K-points. Owing to a grid size of 8x8x8 being used to obtain the Free energy for MgO, a grid of 2x2x2 dimension would be sufficient for the Free energy calculation of faujasite.
A metallic species, lithium, for example, would result in a less dense probing of the grid, as it has a smaller unit cell than MgO; lithium has a body-centered cubic (BCC) crystal structure with a lattice parameter of 3.51 Angstroms.[4] Therefore, a larger grid size would be required if the same density of points was to be achieved. There is only a small difference between the lattice parameters of these materials, but it would still require a grid size of at least 20x20x20. A grid size of 27x27x27 or 32x32x32 might be chosen instead to ensure that it remains a multiple of 2 or 3.
For calculation of the Free energy a grid size of 8x8x8 should be sufficient, as it was found that a grid of 4x4x4 was accurate to 0.1 meV for MgO.
Metals have significantly different bonding to that of a semi-conductor, such as MgO or CaO. There are no formal charges between adjacent atoms, but clouds of electrons screening adjacent Li atoms, which causes vibrational motion of adjacent atoms to be screened slightly. This difference in bonding manifests itself in the phonon dispersion curve, where phonons modes propagate at roughly the same energy value, independent of K-point, with some curvature. Sampling the density of states for metallic species therefore, is significantly easier, as there is essentially no crossing of phonon lines. Hence, despite lithium having a smaller unit cell, a small grid size is required to obtain a representative description of the density of states. An estimation of grid size can not be undertaken because of this reason. The same grid size applies to the calculation of Free energy for Li.
In the QHA calculations the conventional unit cell was used, which contains four MgO units. For the MD calculations a super cell was used instead, where 32 MgO units were used. The scale from the conventional unit cell to the super cell, the lattice parameter must be multiple by two, so there is 8 conventional cells in the super cell. Hence, to keep the sampling size the same, the grid must be divided by two. This is why a grid size of 8x8x8 was taken instead of 16x16x16.
Thermal Expansion of MgO from QHA and MD
The lattice parameter, for the conventional unit cell, was plotted as a function of temperature and displayed in figure 12 for MD and QHA. From figure 12, it is evident that ac increased with temperature for both methods; however, how they increased differed. For QHA, the increase in lattice parameter could be roughly described by a quadratic function; whereas, the MD calculations were linear.
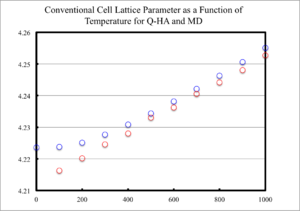
Figure 13 displays the lattice volume, for the conventional unit cell, as a function of temperature for QHA and MD calculations. It can be seen that the lattice parameter increases linearly with temperature for MD calculations, but QHA has an approximate quadratic increase with temperature.
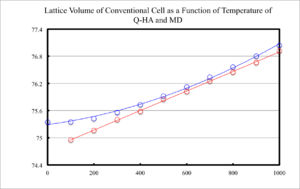
The thermal expansion coefficient can not be stated irrespective of temperature, for QHA, as its derivative it still a function of temperature. However, at larger temperatures, over 400 K, the curve approaches linearity. In its linear region QHA was found to have a thermal expansion coefficient of 2.54E-05 at 600 K. MD calculations yielded a coefficient of 2.68E-05. Literature is in relatively good agreement with the computationally obtained; at 300 K, the thermal expansion coefficient was found to be 1.04E-05 from experiment. [5]
Calculation of the lattice volume at temperatures up to, and slightly above, the melting temperature of MgO was also performed. This revealed no change in the observed trend. QHA was nearly linear from 400 through 4000 K.
The physical origin of thermal expansion resides in the temporary thermal displacement of atoms from their equilibrium positions. As the thermal energy of the MgO crystal increases, so do the amplitudes of the atoms vibrations in the crystals. Therefore, there are times at which two atoms could, in theory, come in close proximity with each other. To avoid this unfavourable energetic state, the equilibrium positions of atoms shift slightly. Hence, changing the motif of the primitive cell. For example, instead of a Mg atom being located on the corner of the cell, it would reside just inside. For the cell to tessellate in all dimensions, there can no longer be another MgO atom at the adjacent corner. It must reside in the adjacent cell in the identical position.
Differences in the thermal expansion coefficient, between the two models of calculation, occur as each calculates the motion of atoms differently. QHA assumes that a pair of atoms vibrates as if it was a diatomic which is has been approximated by a harmonic function at different bond distances on a potential energy surface. Whereas, MD utilises Newtonian mechanics and potential energy surfaces to calculate atomic motion, without the assumption that they must vibrate. Therefore, the atoms respond to changes in thermal energy differently.
At high temperatures, there is effectively no difference between the models. QHA approaches linearity and has values only slightly larger than those of MD. Significant differences between the models are only observed for low temperatures. This must arise from intrinsic assumptions of each model in limiting cases.
Extrapolation of these trends could be assumed to hold true for values under the melting temperature of MgO. For temperatures above, this clearly can no longer be the case, owing to the fact that, upon melting, a change in volume occurs. Liquid MgO can not be described by a unit cell as there is no long range periodic order. Hence, for larger temperatures, the assumption that extrapolation of the trends can not hold.
QHA is unable to predict the actual motions of ions. This inability arises from its intrinsic method for calculating phonon modes. Each phonon mode is assumed to be independent, which, when several vibrations occur, can not hold true. These phonon modes are ideal vibrational motion predicted by a harmonic oscillator.
At high temperatures, approaching that of melting, for the QHA model, significant displacements of ions was observed. The oscillatory amplitudes would displace ions residing in the centre of the unit cell almost into the adjacent cell. Obviously, for energetic reasons, this is not likely to occur. Hence, the QHA model can not provide a physical description of atomic motion close to the melting point of MgO.
Molecular dynamics provided a better description of atomic motion. Temperatures from 2500 through 4000 K were analysed, with incremental steps of 500 K. It was found that, as temperature increased, not only did the vibrational amplitudes increase, but so did the type of vibrations; this was not seen in QHA.
At 2500 K, which is 625 K below melting, there was significant vibrational motion in the super cell. However, the amplitudes of ions remained relatively tame, with no substantial displacements from equilibrium. Vibrations appeared to be random and no long range order in these vibrations were observed. As the temperature increase to and beyond melting, these two observations changed. A temperature of 4000 K, which is significantly over melting, resulting in substantial vibrations; where an ion could be seen to approach the equilibrium position of another ion. Furthermore, long range vibrations had appeared. At some points in time, for short periods, all ions would move in the same direction. As a liquid can not be described by a unit cell, owing to the lack of long range periodic order, the calculations can not be performed for temperatures above, or near melting. For a more accurate description, significantly larger numbers of atoms would be required, which causes the expense of the calculation to increase drastically.
In a diatomic molecule, assuming a perfect harmonic potential, an increase in temperature corresponds to no change in equilibrium bond length, owing to the symmetry of the harmonic oscillator. The maximum and minimum bond length achieved by the atoms would increase and decrease with temperature, respectively. If the Morse potential was utilised instead, then the bond length of the diatomic molecule would increase with temperature as the potential is not symmetrical .
In the condensed phase, there is no longer one interaction between two atoms; there are many pairwise interactions. One atom can have up to 12 interactions with its nearest neighbours. Hence, there needs to be some consideration of how the vibration of on pair of atoms affects the vibration of one of the atoms in that pair with another atom. As temperature increases, as for a diatomic molecule, the maximum bond length increases. If there is another atom, along the same bond vector as the original pair, then an expansion of one bond shall cause a contraction of the adjacent bond. This would make the central atom appear to vibrate between the two outer atoms. However, if there are expansions of both bonds at the same time then the overall bond distances increase; therefore, the atoms equilibrium positions must increase slightly.
Limitations
Descriptions of the QHA and MD models have been provided earlier in the report. A short discussion of limitations of each model shall now be undertaken. Limitations that arise in both models shall be discussed before specific flaws for each calculation method.
Both models assume that atoms can be described by hard, charged spheres that interact in a classical manner; no consideration of quantum mechanics is taken into account. This limits both models to the type of calculation that can be performed and prevents highly accurate calculations to be obtained. This was demonstrated with the Free energy calculations, which were found to not agree within the same order of magnitude.
One of the major problems with these models was that it only considers interactions between atoms that are relatively close. There is no consideration of the effect of interatomic forces from slightly outside its closest neighbours. Hence, a realistic description of the system is difficult to obtain.
From analysis of MgO at large temperatures, it was found that prediction of the motion of atoms after the melting temperature was not accurate. These calculations were performed on a unit cell, or a small multiple of unit cells, which were assumed to provide a description of the solid from repeating this unit cell along the axis to produce a crystal. However, as a liquid has no long range periodic order, it can not be described by a unit cell.
Vibrational motion of atoms, in the QHA, did not take into account interactions between atoms of different unit cells at large energy. These vibrations had such significant vibrations that the atom was almost found outside of its unit cell. Clearly, if this was to occur, there would be significant overlap with other atoms; thereby, increasing the energy profoundly and preventing it from happening.
One limitation of MD calculations is from the potential energy functions which are used to calculate forces experienced by atoms. If the potential energy can not be described realistically with simple functions, there will have to be a compromise; this compromise will either be in the accuracy of the potential or time taken to complete the calculation.
The main limitation for MD calculations is determining a reasonable time scale to perform calculations over. For a small number of atoms, which was the case for this report, it is relatively simple to perform accurate calculations on a 1 ps timescale with a 0.5 fs time step between calculations. These time parameters allowed visualisation of vibrations for MgO. However, for large systems, of 10,000 atoms, it is not trivial to model a system over a biological time frame, whilst keeping information about atomic vibrations.
Conclusion
In conclusion, it was found that prediction of the thermal expansion coefficient could be achieved within the same order of magnitude as experiment. However, the models could not find the Free energy of MgO to the same order of magnitude and failed to predict when MgO would melt. Limitations of each model was discussed with references to the flawed calculations.
References
- ↑ P. W. Atkins; J. De Paule, Atkins’ Physical Chem- istry, Oxford University Press, Oxford, ninth edition, 2010, Resources section, Table 2.8, 923.
- ↑ C.H. Shen, R.S. Liu, J.G. Lin, and C.Y. Huang, Materials Research Bulletin, 2001, 36, 1139.
- ↑ G.R.Eulenbeger, D. P. Shoemaker, and J. G.Keil, J. Phys. Chem. 1967, 71, 6, 1813.
- ↑ J. Kotz, P. Ureichel, D. Treichel and J Townsend, Chemistry & Chemical Reactivity, Engage Learning, Stamford, ninth edition, 2015, Chapter 12, 445.
- ↑ O. Madelung, U. E Rössler and M. E Schulz, Springer, II-VI and I-VII Compounds; Semimagnetic Compounds, 1999, 41B, 2.
