Rep:Mod:Yc16318
NH3 Molecule
Summary Information
Summary of NH3 Molecule
| Molecule Name | NH3 |
| Calculation Method | RB3LYP |
| Basis Set | 6-31G(d,p) |
| E(RB3LYP) | -56.55776873 au |
| RMS Gradient Norm | 0.00000485 au |
| Point Group | C3v |
N-H Bond Distance: 1.02Å (±0.01Å)
H-N-H Bond Angle: 106° (±1°)
Item Table
         Item               Value     Threshold  Converged?
 Maximum Force            0.000004     0.000450     YES
 RMS     Force            0.000004     0.000300     YES
 Maximum Displacement     0.000072     0.001800     YES
 RMS     Displacement     0.000035     0.001200     YES
 Predicted change in Energy=-5.986282D-10
Jmol File
Optimised NH3 Molecule |
The optimisation file is linked to here
Frequency Analysis
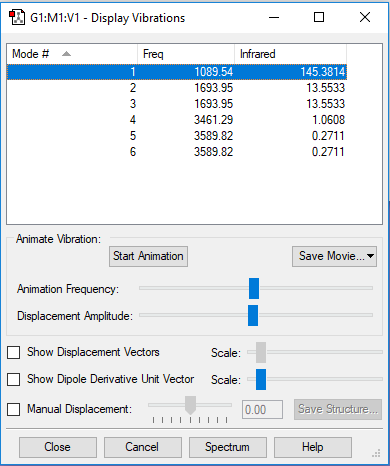
A snapshot of the display vibration table
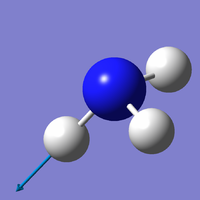
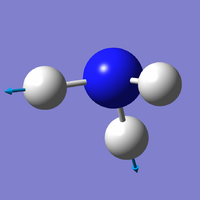
Vibration Modes of the NH3 Molecule
| Mode | 1 | 2 | 3 |
| Wavenumber (cm-1) | 1090 | 1694 | 1694 |
| Symmetry | A1 | E | E |
| Intensity | 145 | 14 | 14 |
| Image | 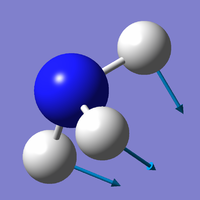
|

|
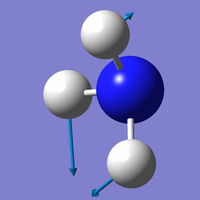
|
| Mode | 4 | 5 | 6 |
| Wavenumber (cm-1) | 3461 | 3590 | 3590 |
| Symmetry | A1 | E | E |
| Intensity | 1 | 0 | 0 |
| Image | 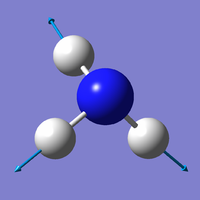
|
|
|
Q & A
how many modes do you expect from the 3N-6 rule?
- 3×4-6=6 modes
Which modes are degenerate (i.e. have the same energy)?
- Mode 2 and 3; Mode 5 and 6 (two pairs of modes that are degenerate to each other).
Which modes are "bending" vibrations and which are "bond stretch" vibrations?
- Bending: 1, 2, 3; Bond Stretch: 4, 5, 6
Which mode is highly symmetric?
- Mode 4
One mode is known as the "umbrella" mode, which one is this?
- Mode 1
How many bands would you expect to see in an experimental spectrum of gaseous ammonia?
- 2 bands. 3 bands are expected from mode 1,2,3, but mode 2 and mode 3 are degenerate, thus only two bands are shown. Mode 4 is symmetrical hence not IR active, while mode 5 and 6 have intensities of 0.
Charge Analysis
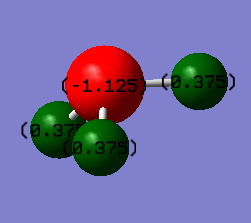
Charge Distribution of the NH3 Molecule
The N-atom is expected to carry negative charge and the H-atoms are expected to carry positive charges because nitrogen is more electronegative compared to hydrogen.
N2 Molecule
Summary Information
Summary of N2 Molecule
| Molecule Name | N2 |
| Calculation Method | RB3LYP |
| Basis Set | 6-31G(d,p) |
| E(RB3LYP) | -109.52412868 au |
| RMS Gradient Norm | 0.00000060 au |
| Point Group | D∞h |
N≡N Bond Distance: 1.11Å (±0.01Å)
Item Table
         Item               Value     Threshold  Converged?
 Maximum Force            0.000001     0.000450     YES
 RMS     Force            0.000001     0.000300     YES
 Maximum Displacement     0.000000     0.001800     YES
 RMS     Displacement     0.000000     0.001200     YES
 Predicted change in Energy=-3.401045D-13
 Optimization completed.
    -- Stationary point found.
                           ----------------------------
                           !   Optimized Parameters   !
                           ! (Angstroms and Degrees)  !
 --------------------------                            --------------------------
 ! Name  Definition              Value          Derivative Info.                !
 --------------------------------------------------------------------------------
 ! R1    R(1,2)                  1.1055         -DE/DX =    0.0                 !
 --------------------------------------------------------------------------------
 GradGradGradGradGradGradGradGradGradGradGradGradGradGradGradGradGradGrad
Jmol File
Optimised N2 Molecule |
The optimisation file is linked to here
Frequency Analysis
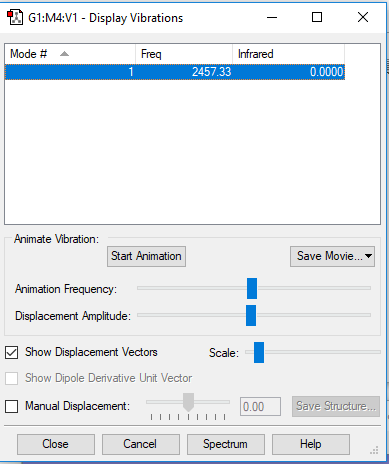
A snapshot of the display vibration table
Vibration Modes of the N2 Molecule
| Wavenumber (cm-1) | 2457 |
| Symmetry | SGG |
| Intensity | 0 |
| Image | 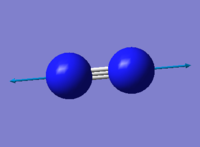
|
Charge Analysis
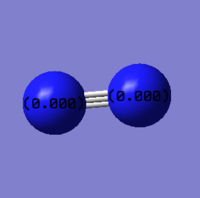
Charge Distribution of the N2 Molecule
The molecule does not have a permanent dipole moment and no charge is allocated to either N atoms (homonuclear)
H2 Molecule
Summary Information
Summary of H2 Molecule
| Molecule Name | H2 |
| Calculation Method | RB3LYP |
| Basis Set | 6-31G(d,p) |
| E(RB3LYP) | -1.17853936 au |
| RMS Gradient Norm | 0.00000017 au |
| Point Group | D∞h |
H-H Bond Distance: 0.74Å (±0.01Å)
Item Table
         Item               Value     Threshold  Converged?
 Maximum Force            0.000000     0.000450     YES
 RMS     Force            0.000000     0.000300     YES
 Maximum Displacement     0.000000     0.001800     YES
 RMS     Displacement     0.000001     0.001200     YES
 Predicted change in Energy=-1.164080D-13
 Optimization completed.
    -- Stationary point found.
                           ----------------------------
                           !   Optimized Parameters   !
                           ! (Angstroms and Degrees)  !
 --------------------------                            --------------------------
 ! Name  Definition              Value          Derivative Info.                !
 --------------------------------------------------------------------------------
 ! R1    R(1,2)                  0.7428         -DE/DX =    0.0                 !
 --------------------------------------------------------------------------------
 GradGradGradGradGradGradGradGradGradGradGradGradGradGradGradGradGradGrad
Jmol File
Optimised H2 Molecule |
The optimisation file is linked to here
Vibration Analysis
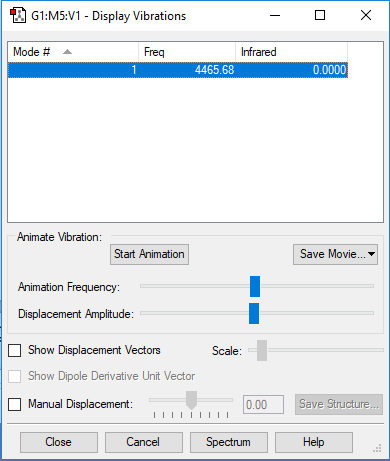
A snapshot of the display vibration table
Vibration Mode of the H2 Molecule
| Wavenumber (cm-1) | 4466 |
| Symmetry | SGG |
| Intensity | 0 |
| Image | 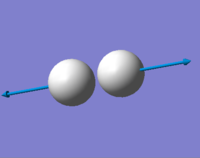
|
Charge Analysis
Charge Distribution of the H2 Molecule
The molecule does not have a permanent dipole moment and no charge is allocated to either h atoms (homonuclear)
Structure and Reactivity
N2 Coordinating in Mono-metallic TM Complex
Mono-metallic TM Complex Identifier: DEKFUX
The Mono-metallic Ruthenium Complex is linked to [here]
The original journal can be found at[[1]]
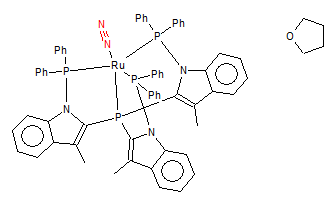
N≡N Bond Length: 1.09 Å (±0.01Å)
Structure of The Ruthenium Complex
The bond length found in the structure is slightly shorter than the one obtained through Gaussian (N≡N Bond Distance=1.11 Å). This could be due to:
1. The N-N triple bond is strengthened when the molecule is coordinated to the Ruthenium because the metal centre donates electron density to the triple bond
2. experimental error (only small deviation)
3. the Bond Length Gaussian found is a local minimum instead of the overall minimum
4. Ideally, the N≡N bond found in the metal complex should be longer than that in N2 molecule as coordinating to the metal centre would decrease the electron density in the N≡N bond thus weakens the bond.
Haber-Bosch process
E(NH3)= -56.5577687 au
2×E(NH3)= -113.1155374 au
E(N2)= -109.5241287 au
E(H2)= -1.1785394 au
3×E(H2)= -3.5356182 au
ΔE=2×E(NH3)-[E(N2)+3×E(H2)]=-0.0557905≈-0.05579 au= -145.4 kJ/mol
The ammonia product is more stable as it has a lower energy and the energy for the reaction is exothermic (ΔE<0)
CO Molecule
Summary Information
Summary of CO Molecule
| Molecule Name | CO |
| Calculation Method | RB3LYP |
| Basis Set | 6-31G(d,p) |
| E(RB3LYP) | -113.30945314 au |
| RMS Gradient Norm | 0.00000433 au |
| Point Group | C∞v |
C≡O Bond Distance: 1.14Å (±0.01Å)
Item Table
Item               Value     Threshold  Converged?
 Maximum Force            0.000007     0.000450     YES
 RMS     Force            0.000007     0.000300     YES
 Maximum Displacement     0.000003     0.001800     YES
 RMS     Displacement     0.000004     0.001200     YES
 Predicted change in Energy=-2.221224D-11
 Optimization completed.
    -- Stationary point found.
                           ----------------------------
                           !   Optimized Parameters   !
                           ! (Angstroms and Degrees)  !
 --------------------------                            --------------------------
 ! Name  Definition              Value          Derivative Info.                !
 --------------------------------------------------------------------------------
 ! R1    R(1,2)                  1.1379         -DE/DX =    0.0                 !
 --------------------------------------------------------------------------------
 GradGradGradGradGradGradGradGradGradGradGradGradGradGradGradGradGradGrad
Jmol File
Optimised CO Molecule |
The optimisation file is linked to here
Vibration Analysis
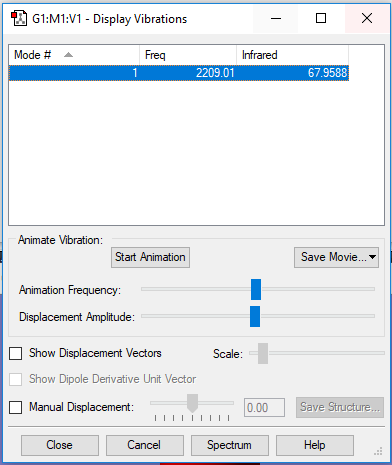
A snapshot of the display vibration table
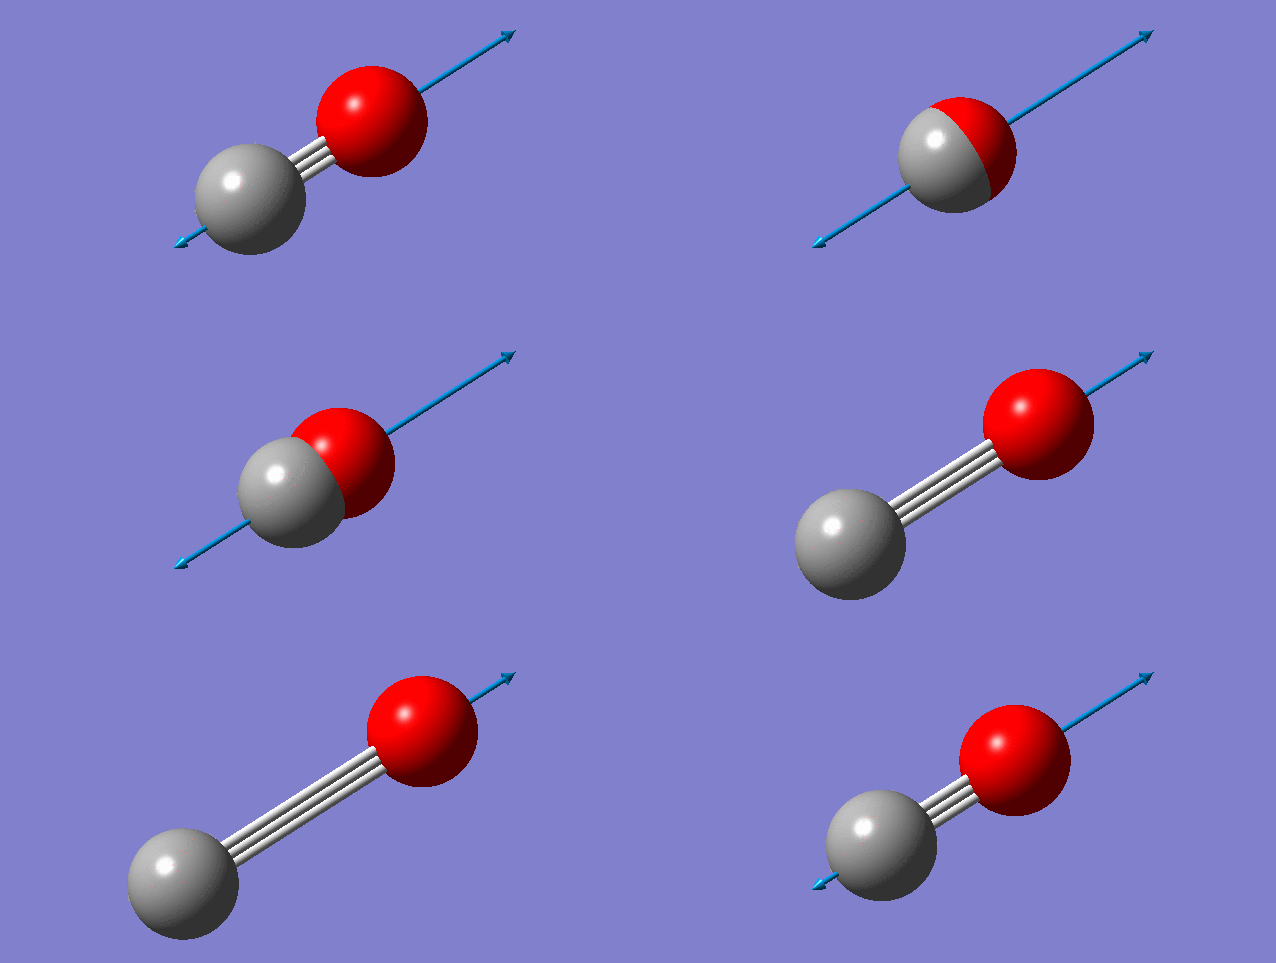
Vibration Mode of the CO Molecule
| Wavenumber (cm-1) | 2209 |
| Symmetry | SG |
| Intensity | 68 |
| Image | 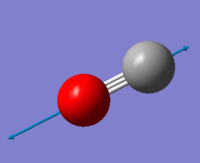
|
Charge Analysis
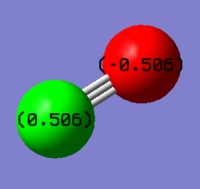
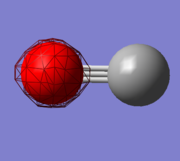
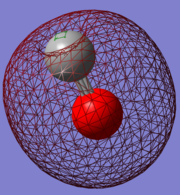
Charge Distribution of the CO Molecule
Vibration Motion of The CO Molecule
The C atom has a positive partial charge while the O atom has a negative partial charge. This is because O is more electronegative than C.
Molecular Orbitals of The CO Molecule
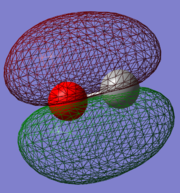
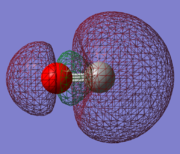
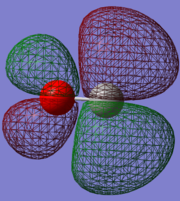
Five MOs of CO
- How do you tell apart bonding, antibonding and nonbonding?**
Independence
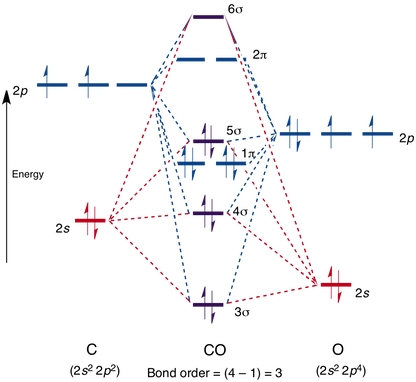
An comparison between the MO theory and Gaussian as means of explaining the C≡O bond
Original diagram can be found here[[2]]
The MO#1 (1σ) is not shown in the diagram because it is deep in energy and do not interact with the illustrated AOs/MOs, it is suggested by the MO theory that the 1s AOs in both atoms overlap to form bonding 1σ and antibonding 2σ. However, Gaussian suggests that the 1s AOs are core orbitals that barely participate in bonding.
In the MO diagram, MO#3 (3σ) is illustrated as a bonding orbital created by the overlapping of the 2s AOs from both C and O which is also stabilised by the sp hybridisation of 2s and 2p within the O atom and the C atom individually.
MO#5 is shown in the diagram as one of the degenerate 1π orbitals resulted , which also agrees with the computation in Gaussian which indicates that 2px on both C and O contribute to MO#5. However, in addition to the 2px AOs, Gaussian also suggests that 3px on O has a major contribution to this MO as well.
The HOMO (5σ) is stabilised by the overlap of 2pz AOs in both C and O, but destabilised by the out of phase overlap in the sp hybridisation (antibonding), hence it's a mixture, which agrees with the results found in Gaussian. Because O is more electronegative and therefore its orbitals are deeper in energy, the MO orbital formed would resemble AOs in O more. This observation also agrees with Gaussian, which indicates that orbitals on O have higher molecular orbital coefficients.
The LUMO is the antibonding orbital from the overlap between 2p AOs from both C and O that resembles 2p orbital in C more because it is closer in energy to the less electronegative C, which agrees with calculations in Gaussian as well.
Conclusion
In comparison to the MO theory, the calculations in Gaussian gives more in-depth and accurate information about the MO and the AOs that contribute to a certain MO. Most results found in Gaussian agree with the MO theory relatively well. However, it was found that MO is not formed by overlapping of one or two pairs of AOs from the two bonding atoms. Rather, many AOs, including the ones in higher main energy levels, may contribute to the MO to various extents. Another major difference being Gaussian suggests that the core orbitals (1s) do not participate in bonding whereas the MO theory suggests that the 1s orbitals do overlap, however the stabilising effect of the bonding is cancelled out by the fully occupied antibonding orbital.
CO as a ligand in complex molecules
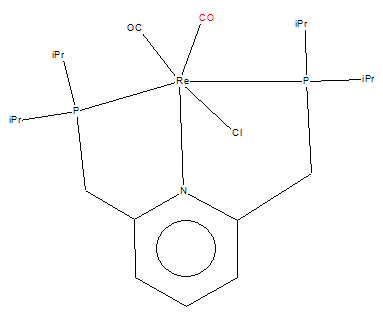
CO in the mono-metallic Rhenium Pincer complex
Mono-metallic TM Complex Identifier: DEKFUX
The mono-metallic Rhenium Pincer Complex is linked to [here]
The original journal can be found at[[3]]
C≡O Bond Length: 1.24 Å (±0.01Å)
Structure of The Rhenium Pincer Complex
The bond length found in the structure is longer than the one obtained through Gaussian (C≡O Bond Distance=1.14 Å). This could be due to:
1. The C≡O molecule coordinates to the metal centre using the lone pair of electron on C
2. The value obtained from experiment may not be accurate due to apparatus error or human error.
3. The Bond Length calculated by Gaussian is only an approximation, therefore may not be accurate. It is limited to the method you choose. It is possible to get more accurate results using a better method that has more parameters.
CO in metallic TM complexes
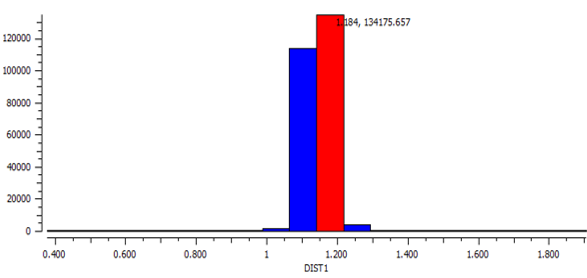
The average Bond length of C≡O is calculated using Data Analysis in Conquest to be 1.15 Å and the mode is calculated to be 1.18 Å, both are longer than the bond length of C≡O as a molecule. This supports the explanation that C≡O elongates due to the weakening of the triple bond after coordinating to a metal centre.
Histogram of C≡O bond length in various complexes
Marking
Note: All grades and comments are provisional and subject to change until your grades are officially returned via blackboard. Please do not contact anyone about anything to do with the marking of this lab until you have received your grade from blackboard.
Wiki structure and presentation 1/1
Is your wiki page clear and easy to follow, with consistent formatting?
YES
Do you effectively use tables, figures and subheadings to communicate your work?
YES
NH3 1/1
Have you completed the calculation and given a link to the file?
YES
Have you included summary and item tables in your wiki?
YES
Have you included a 3d jmol file or an image of the finished structure?
YES
Have you included the bond lengths and angles asked for?
YES
Have you included the “display vibrations” table?
YES
Have you added a table to your wiki listing the wavenumber and intensity of each vibration?
YES
Did you do the optional extra of adding images of the vibrations?
YES
Have you included answers to the questions about vibrations and charges in the lab script?
YES
N2 and H2 0.5/0.5
Have you completed the calculations and included all relevant information? (summary, item table, structural information, jmol image, vibrations and charges)
YES
Crystal structure comparison 0.5/0.5
Have you included a link to a structure from the CCDC that includes a coordinated N2 or H2 molecule?
YES
Have you compared your optimised bond distance to the crystal structure bond distance?
YES
Haber-Bosch reaction energy calculation 1/1
Have you correctly calculated the energies asked for? ΔE=2*E(NH3)-[E(N2)+3*E(H2)]
YES
Have you reported your answers to the correct number of decimal places?
YES
Do your energies have the correct +/- sign?
YES
Have you answered the question, Identify which is more stable the gaseous reactants or the ammonia product?
YES
Your choice of small molecule 5/5
Have you completed the calculation and included all relevant information?
YES
Have you added information about MOs and charges on atoms?
YES, very detailed explanations with lots of information which you explained clearly, well done!
Independence 1/1
If you have finished everything else and have spare time in the lab you could:
Check one of your results against the literature, or
Do an extra calculation on another small molecule, or
Do some deeper analysis on your results so far
You took a deeper look into the MOs and the theory behind it, well done! You also analysed the bond length of C=O in the context of the crystal structures database, excellent work.

