Rep:Mod:YY3412inorganic
EX3 Section
Geometry Optimisation of EX3
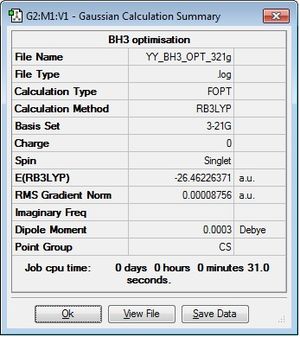
BH3: B3LYP/3-21G
Optimisation log file here
BH3:B3LYP/6-31G(d,p)
Optimisation log file here
| summary data | convergence | Jmol | |||
|---|---|---|---|---|---|

|
Item Value Threshold Converged? Maximum Force 0.000012 0.000450 YES RMS Force 0.000008 0.000300 YES Maximum Displacement 0.000064 0.001800 YES RMS Displacement 0.000039 0.001200 YES |
|
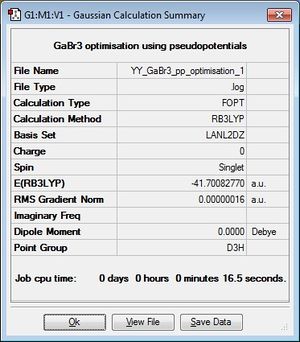
GaBr3:B3LYP/LANL2DZ
optimisation file: here. DOI:10042/193746
| summary data | convergence | Jmol | |||
|---|---|---|---|---|---|
|
Item Value Threshold Converged? Maximum Force 0.000000 0.000450 YES RMS Force 0.000000 0.000300 YES Maximum Displacement 0.000003 0.001800 YES RMS Displacement 0.000002 0.001200 YES |
|
BBr3:B3LYP/6-31G(d,p)LANL2DZ
optimisation file: here. DOI:10042/193747
| summary data | convergence | Jmol | |||
|---|---|---|---|---|---|

|
Item Value Threshold Converged? Maximum Force 0.000008 0.000450 YES RMS Force 0.000005 0.000300 YES Maximum Displacement 0.000034 0.001800 YES RMS Displacement 0.000023 0.001200 YES |
|
Geometry Comparison
| BH3 | BBr3 | GaBr3 | |
|---|---|---|---|
| r(E-X) Å | 1.19 | 1.93 | 2.35 |
| θ(X-E-X) degrees(º) | 120.0 | 120.0 | 120.0 |
The change of ligand from H to Br has increased the bond length and thus decreased the bond strength. Both H and Br share one valence electron with B to fill their valence shell and form covalent bond. However, Br, which locates on the fourth row on the periodic table, has a much bigger size than H and B as well. This leads to poor orbital overlap between Br and B because better orbital overlap occurs between H and B orbitals with similar sizes. The big size Br atom also separates itself and H away. The change of central atom from B to Ga has also increased the bond length. B and Ga are both in group 3 thus both form three bond with Br. However, Ga, which is two rows below B, is bigger in size, forming a longer bond than B-Br.
A chemical bond is the stabilisation of a substances by the interaction between constituent atoms and the electron density around them. [1] One example of a strong bond is ionic bond, which is the electrostatic force between cations and anions. [2] A typical ionic bond, e.g. Na+Cl- has experimental lattice energy of 868 kJ/mol.[3]. A typical medium bond is covalent bond which is formed by sharing electrons between atoms. [4] One example of a covalent bond is C-H bond, with bond enthalpy of 413 kJ/mol. [5]. Hydrogen bond is one of a weak intermolecular bond with bond energy of 18 kJ/mol in water.[6] Gaussview produce human-readable data from output file. Therefore, there will be a preset average bond length for a specific molecule. In some cases, gaussview cannot tell whether a bond exist or not if it exceeds the preset value.
Frequency Analysis for EX3
BH3:B3LYP/6-31G(d,p)
Frequency file: here
| summary data | low modes |
|---|---|

|
Low frequencies --- -14.4708 -14.4667 -10.7557 0.0008 0.0170 0.3466 Low frequencies --- 1162.9512 1213.1233 1213.1235 |
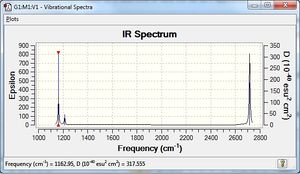
Vibrational spectrum for BH3
| wavenumber | Intensity | IR active? | type |
| 1162 | 93 | yes | bend |
| 1213 | 14 | very slight | bend |
| 1213 | 14 | very slight | bend |
| 2582 | 0 | no | stretch |
| 2715 | 126 | yes | stretch |
| 2715 | 126 | yes | stretch |
According to 3N-6 rule, there should be six vibrational modes in total, however, there are only three peaks on the IR diagram. This is because that the vibrational modes at wavenumber 1213 cm-1 and 2716 cm-1 have two equivalent vibrational modes and gives the second and third peak. Also, at wavenumber 2582 cm-1, the vibrational mode is IR inactive because it has no dipole moment.
GaBr3:B3LYP/LANL2DZ
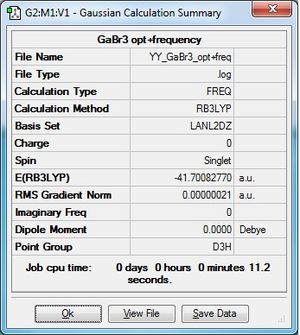
Frequency file: here. DOI:10042/193793
| summary data | low modes |
|---|---|
|
Low frequencies --- -1.4878 -0.0015 -0.0002 0.0096 0.6540 0.6540 Low frequencies --- 76.3920 76.3924 99.6767 |
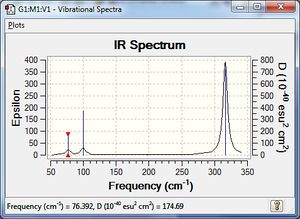
Vibrational spectrum for GaBr3
| wavenumber | Intensity | IR active? | type |
| 76 | 3 | very slight | bend |
| 76 | 3 | very slight | bend |
| 99 | 9 | very slight | bend |
| 197 | 0 | no | stretch |
| 316 | 57 | yes | stretch |
| 316 | 57 | yes | stretch |
GaBr3 generally has lower frequencies than BH3 which indicates that the energy requires to vibrate GaBr3 is less. This suggests that the bond between Ga and Br is weaker than the bond between B and H, which we have got pretty good agreement through the comparison of the bond length between them. Also, both Ga and Br are heavy atoms, which vibrate less than lighter atoms, also explains the reason for them to have smaller frequencies. The umbrella motion for BH3 has frequency of 1162 -1 and intensity of 93 while for GaBr3 the frequency is only 100 and the intensity is 9 which is much more small than BH3. This is because that H has a really low mass which vibrates easily thus have high frequency. Also, the displacement vectors of H change rapidly suggest that H dominates the bending. However, for the GaBr3, both kinds of atom are too big to vibrate easily, thus having a lower frequency.
The B3LYP method we are using produces PES after solving Schrödinger equation of electrons. The optimisation and frequency analysis are obtained from the first and second derivative of the PES. The basis set is the number of equations that we are use to calculate, larger basis set, more accuracy. Therefore, if we are not using the same method and basis set, we are not able to produce the same PES. The comparison upon different PES produce no useful results at all. The purpose of carrying out a frequency analysis is to make sure that the structure we have optimised is a minimum. As frequency is the curvature of the gradient, all positive frequency indicates a local minimum. Low frequencies represents the -6 part of 3N-6, which corresponds to the translation and rotation of center of mass, i.e. nucleus. The lower the low frequency, the better the approximation as the calculation is based on Born-Oppenheimer approximation(the nucleus are considered to be stationary compared to electrons).
Molecular Orbitals of BH3
Population analysis file: DOI:10042/193800
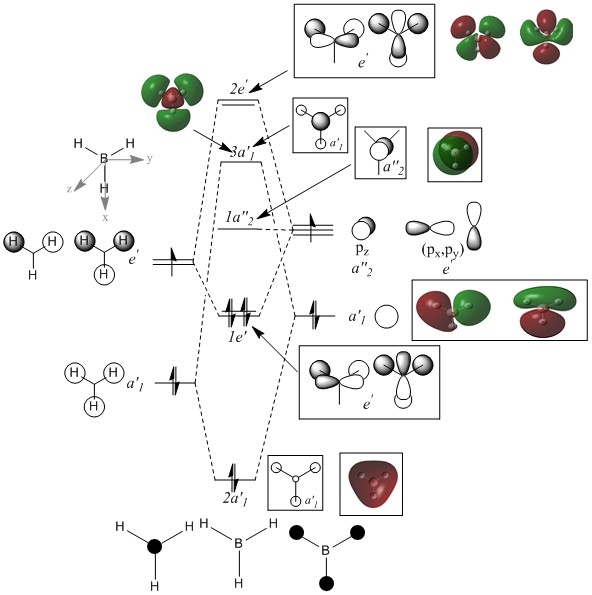
Molecular orbital diagram for BH3
There is no significant difference between real and qualitaively analysed MO. This shows that, qulitative MO theory is quite useful and accurate for determining the bonding properties for not too complex molecules.
NBO analysis
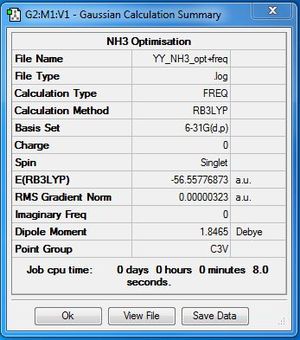
NH3:B3LYP/6-31G(d,p)
Optimisation log file here
| summary data | convergence | Jmol | |||
|---|---|---|---|---|---|

|
Item Value Threshold Converged? Maximum Force 0.000006 0.000450 YES RMS Force 0.000004 0.000300 YES Maximum Displacement 0.000012 0.001800 YES RMS Displacement 0.000008 0.001200 YES |
|
Frequency file: here
| summary data | low modes |
|---|---|
|
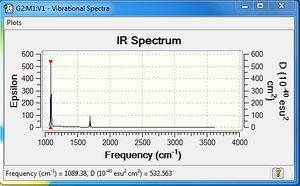
Low frequencies --- -0.0129 -0.0023 0.0007 7.0722 8.1013 8.1017 Low frequencies --- 1089.3849 1693.9369 1693.9369 |
Vibrational spectrum for NH3
| wavenumber | Intensity | IR active? | type |
| 1089 | 145 | yes | bend |
| 1693 | 14 | slight | bend |
| 1693 | 14 | slight | bend |
| 3461 | 1 | no | stretch |
| 3589 | 0 | no | stretch |
| 3589 | 0 | no | stretch |
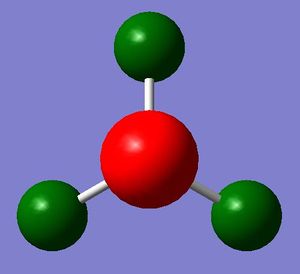
NBO analysis for NH3
Population analysis file: here
Charge range: -1.000 to 1.000
Association Energy
NH3BH3:B3LYP/6-31G(d,p)
Optimisation log file here
| summary data | convergence | Jmol | |||
|---|---|---|---|---|---|

|
Item Value Threshold Converged? Maximum Force 0.000006 0.000015 YES RMS Force 0.000002 0.000010 YES Maximum Displacement 0.000032 0.000060 YES RMS Displacement 0.000015 0.000040 YES |
|
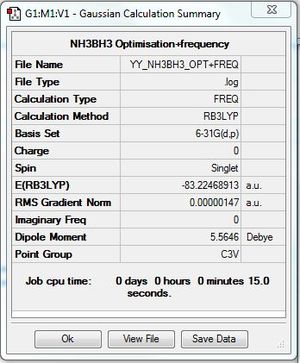
Frequency file: here
| summary data | low modes |
|---|---|
|
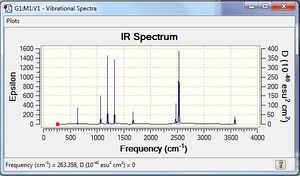
Low frequencies --- -1.3155 -0.9092 -0.1280 0.0478 0.2695 1.8922 Low frequencies --- 263.3575 633.0337 638.4913 |
Vibrational spectrum for NH3BH3
| wavenumber | Intensity | IR active? | type |
| 263 | 0 | no | bend |
| 633 | 14 | slight | stretch |
| 638 | 4 | very slight | bend |
| 638 | 4 | very slight | bend |
| 1069 | 41 | yes | bend |
| 1069 | 41 | yes | bend |
| 1196 | 109 | yes | bend |
| 1203 | 3 | very slight | bend |
| 1203 | 3 | very slight | bend |
| 1328 | 114 | yes | bend |
| 1676 | 28 | slight | bend |
| 1676 | 28 | slight | bend |
| 2471 | 67 | yes | stretch |
| 2532 | 231 | yes | stretch |
| 2532 | 231 | yes | stretch |
| 3464 | 3 | very slight | stretch |
| 3581 | 28 | slight | stretch |
| 3581 | 28 | slight | stretch |
Assocaition Energy Calculation
| NH3 | BH3 | NH3BH3 |
|---|---|---|
| -56.5577687 a.u. | -26.6153236 a.u. | -83.2246891 a.u. |
Therefore the association energy is
ΔE=E(NH3BH3)-[E(NH3)+E(BH3)]
  =-83.2246891-[(-56.5577687)+(-26.6153236)]
  =-0.0515968 a.u.
  =-135.47 kJ/mol
According to the examples on the different bond strenth above, the dissociation energy is much more higher than a weak hydrogen bond, but SI still significantly lower than C-H covalent bond. This suggest that the B-N bond is quite a weak medium bond.
Ionic Liquids: Designer Solvents
Comparison of selected 'onium' cations
[N(CH3)4]+:B3LYP/6-31G(d,p)
Optimisation log file here
| summary data | convergence | Jmol | |||
|---|---|---|---|---|---|

|
Item Value Threshold Converged? Maximum Force 0.000000 0.000015 YES RMS Force 0.000000 0.000010 YES Maximum Displacement 0.000001 0.000060 YES RMS Displacement 0.000000 0.000040 YES |
|
Frequency file: here. DOI:10042/193972
| summary data | low modes |
|---|---|

|
Low frequencies --- -0.0009 -0.0009 -0.0008 21.4505 21.4505 21.4505 Low frequencies --- 188.5037 292.6296 292.6296 |
Vibrational spectrum for [N(CH3)4]+
[P(CH3)4]+:B3LYP/6-31G(d,p)
Optimisation log file here
| summary data | convergence | Jmol | |||
|---|---|---|---|---|---|

|
Item Value Threshold Converged? Maximum Force 0.000001 0.000015 YES RMS Force 0.000000 0.000010 YES Maximum Displacement 0.000005 0.000060 YES RMS Displacement 0.000002 0.000040 YES |
|
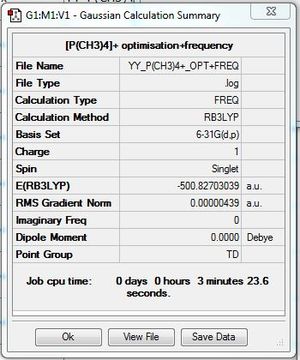
Frequency file: here. DOI:10042/193977
| summary data | low modes |
|---|---|
|
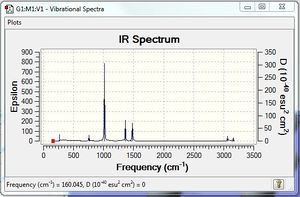
Low frequencies --- -0.0025 -0.0022 -0.0018 24.7623 24.7623 24.7623 Low frequencies --- 160.0449 194.7814 194.7814 |
Vibrational spectrum for [P(CH3)4]+
[S(CH3)3]+:B3LYP/6-31G(d,p)
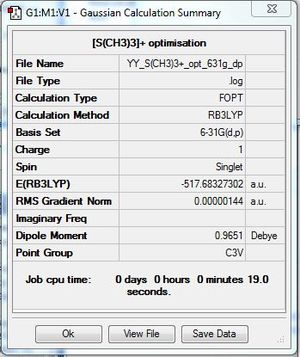
Optimisation log file here
| summary data | convergence | Jmol | |||
|---|---|---|---|---|---|
|
Item Value Threshold Converged? Maximum Force 0.000002 0.000015 YES RMS Force 0.000001 0.000010 YES Maximum Displacement 0.000012 0.000060 YES RMS Displacement 0.000005 0.000040 YES |
|
Frequency file: here. DOI:10042/193980
| summary data | low modes |
|---|---|

|
    Low frequencies ---   -7.9355   -7.6384   -7.6351   -0.0035    0.0030    0.0087
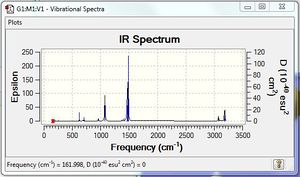
    Low frequencies ---  161.9978  199.6727  199.6727
|
Vibrational spectrum for [S(CH3)3]+
NBO analysis
Population analysis of [N(CH3)4]+: here. DOI:10042/193973
Population analysis of [P(CH3)4]+: here. DOI:10042/193979
Population analysis of [S(CH3)3]+: here. DOI:10042/193981
Note: all the charge distribution shown by colour are within charge range: -1.000 to 1.000 here and afterwards.
| charge distribution in colour | charge distribution in number | |
|---|---|---|
| [N(CH3)4]+ | 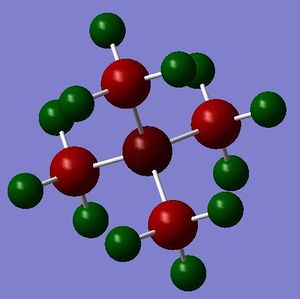
|

|
| [P(CH3)4]+ | 
|

|
| [S(CH3)3]+ | 
|

|
| heteroatom | C | H | |
|---|---|---|---|
| [N(CH3)4]+ | -0.295 | -0.483 | 0.269 |
| [P(CH3)4]+ | 1.667 | -1.050 | 0.298 |
| [S(CH3)3]+ | 0.917 | -0.486 | 0.297 and 0.279 |
From the table above we can see that, more electronegative the heteroatom, more electropositive the C. This is because the more electronegative heteroatom tends to attract more electrons from C. However, it is interesting that C in all three cations are negatively charged, this is because they are bonded to very electropositive hydrogen. It seems that, the charge distribution of hydrogen is almost not affected by the change of heteroatom, mainly because the distance between heteroatom and hydrogen is not close enough. Despite that, the trend of charge on hydrogen still agrees with the electronegativity of the heteroatom. Another interesting thing is that, hydrogen in [S(CH3)3]+ has two environment. Four of the hydrogen atoms are closer to S, thus have more positive charge (0.297), the other two, further away, have less positive charge (0.279). Therefore, the distance between atoms does affect the charge distribution.
'Formal' charge is the charge denoted to some of the atoms of a molecule, assuming that the electrons equally shared between atoms, taking no account of the elecronegativity. In [NR4]+, it represents that N donate one more electron to form the fourth bond with R. For this cation, the positive charge is actually spread all over the hydrogens if take electronegativity in to account.
Influence of functional groups
[N(CH3)3(CH2OH)-]+:B3LYP/6-31G(d,p)
Optimisation log file here
| summary data | convergence | Jmol | |||
|---|---|---|---|---|---|

|
Item Value Threshold Converged? Maximum Force 0.000027 0.000450 YES RMS Force 0.000006 0.000300 YES Maximum Displacement 0.001007 0.001800 YES RMS Displacement 0.000250 0.001200 YES |
|
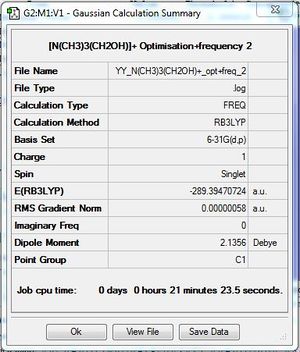
Frequency file: here. DOI:10042/193984
| summary data | low modes |
|---|---|
|
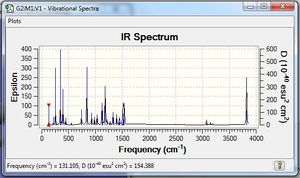
Low frequencies --- -8.4287 -5.0228 -1.0409 -0.0001 0.0007 0.0007 Low frequencies --- 131.1048 213.4616 255.7059 |
Vibrational spectrum for [N(CH3)3(CH2OH)-]+
[N(CH3)3(CH2CN)-]+:B3LYP/6-31G(d,p)
Optimisation log file here
| summary data | convergence | Jmol | |||
|---|---|---|---|---|---|

|
Item Value Threshold Converged? Maximum Force 0.000072 0.000450 YES RMS Force 0.000013 0.000300 YES Maximum Displacement 0.001391 0.001800 YES RMS Displacement 0.000357 0.001200 YES |
|
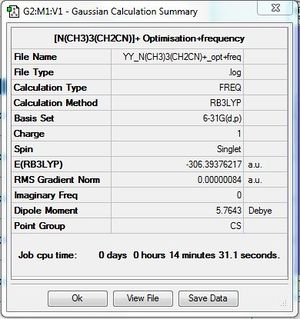
Frequency file: here. DOI:10042/193985
| summary data | low modes |
|---|---|
|
    Low frequencies ---   -3.7128    0.0006    0.0009    0.0011    2.7262    3.9547
    Low frequencies ---   91.8763  153.9688  212.1362
|
Vibrational spectrum for [N(CH3)3(CH2CN)-]+
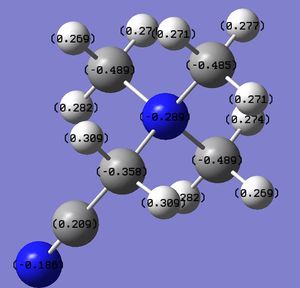
NBO analysis
Population analysis of [N(CH3)3CH2OH]+: here. DOI:10042/193986
Population analysis of [N(CH3)3CH2CN]+: here. DOI:10042/193988
Note: all the charge distribution shown by colour are within charge range: -1.000 to 1.000 here and afterwards.
| charge distribution in colour | charge distribution in number | |
|---|---|---|
| [N(CH3)3CH2OH]+ | 
|

|
| [N(CH3)3CH2CN]+ | 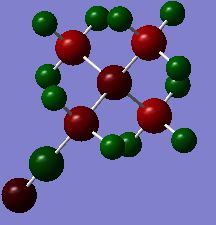
|
|
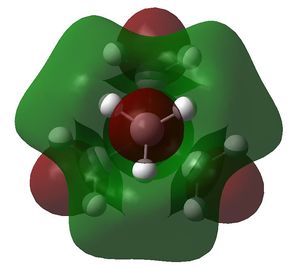
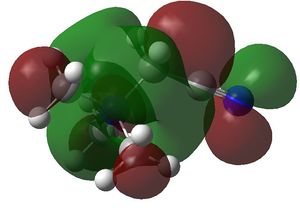
HOMO LUMO comparison
| HOMO | LUMO | |
|---|---|---|
| [N(CH3)4+ | 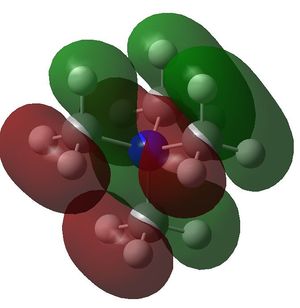
|
|
| [N(CH3)3CH2OH]+ | 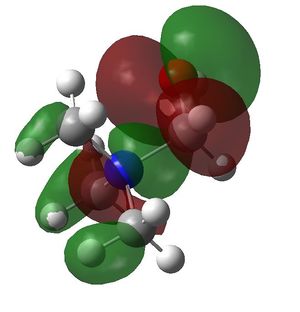
|

|
| [N(CH3)3CH2CN]+ | 
|
|
| HOMO | LUMO | HOMO-LUMO gap (kJ/mol) | |
|---|---|---|---|
| [N(CH3)4+ | -0.57934 a.u. | -0.13306 a.u. | 1172 |
| [N(CH3)3CH2OH]+ | -0.48762 a.u. | -0.12459 a.u. | 953 |
| [N(CH3)3CH2CN]+ | -0.50047 a.u. | -0.18180 a.u. | 837 |
Reference and citation
- ↑ IUPAC. Compendium of Chemical Terminology, 2nd ed. (the "Gold Book"). Compiled by A. D. McNaught and A. Wilkinson. Blackwell Scientific Publications, Oxford (1997). XML on-line corrected version: http://goldbook.iupac.org (2006-) created by M. Nic, J. Jirat, B. Kosata; updates compiled by A. Jenkins. ISBN 0-9678550-9-8. DOI:10.1351/goldbook.CT07009 .
- ↑ IUPAC. Compendium of Chemical Terminology, 2nd ed. (the "Gold Book"). Compiled by A. D. McNaught and A. Wilkinson. Blackwell Scientific Publications, Oxford (1997). XML on-line corrected version: http://goldbook.iupac.org (2006-) created by M. Nic, J. Jirat, B. Kosata; updates compiled by A. Jenkins. ISBN 0-9678550-9-8. DOI:doi:10.1351/goldbook.IT07058 .
- ↑ David Arthur Johnson, Metals and Chemical Change,Open University, Royal Society of Chemistry, 2002,ISBN 0-85404-665-8
- ↑ IUPAC. Compendium of Chemical Terminology, 2nd ed. (the "Gold Book"). Compiled by A. D. McNaught and A. Wilkinson. Blackwell Scientific Publications, Oxford (1997). XML on-line corrected version: http://goldbook.iupac.org (2006-) created by M. Nic, J. Jirat, B. Kosata; updates compiled by A. Jenkins. ISBN 0-9678550-9-8.DOI:10.1351/goldbook.C01384
- ↑ Clayden, Jonathan; Greeves, Nick; Warren, Stuart; Wothers, Peter (2001). Organic Chemistry (1st ed.). Oxford University Press. ISBN 978-0-19-850346-0.
- ↑ Omer Markovitch and Noam Agmon (2007). "Structure and energetics of the hydronium hydration shells". J. Phys. Chem. A 111 (12): 2253–2256. doi:10.1021/jp068960g. PMID 17388314.

