Rep:Mod:YURU1
BH3 Molecule
Optimization of BH3
Optimization method used: RB3LYP
Basis set used: 6-31G (d.p)
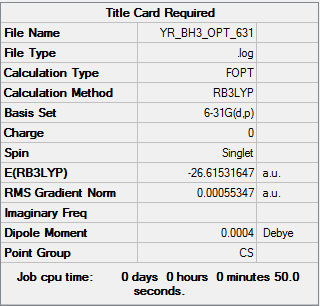
Figure 1 The summary table of optimasation
    Item               Value     Threshold  Converged?
 Maximum Force            0.000009     0.000450     YES
 RMS     Force            0.000005     0.000300     YES
 Maximum Displacement     0.000036     0.001800     YES
 RMS     Displacement     0.000018     0.001200     YES
Table 1 the item table
Frequency analysis of BH3
• Link to frequency LOG file
Low frequencies ---   -2.9884   -1.1079   -0.0054    1.6554    9.9523   10.0137
Low frequencies --- 1162.9840 1213.1744 1213.1770
Table 2 the frequency table
Borane molecule |
Figure 2 Jmol image BH3 Molecule
| wavenumber (cm-1 | Intensity (arbitrary units) | symmetry | IR active? | type |
| 1163 | 93 | A1 | yes | out-of-plane bend |
| 1213 | 14 | E | very slight | bend |
| 1213 | 14 | E | very slight | bend |
| 2582 | 0 | A1 | no | symmetric stretch |
| 2715 | 126 | E | yes | asymmetric stretch |
| 2715 | 126 | E | yes | asymmetric stretch |
Table 3 Vibrational analysis
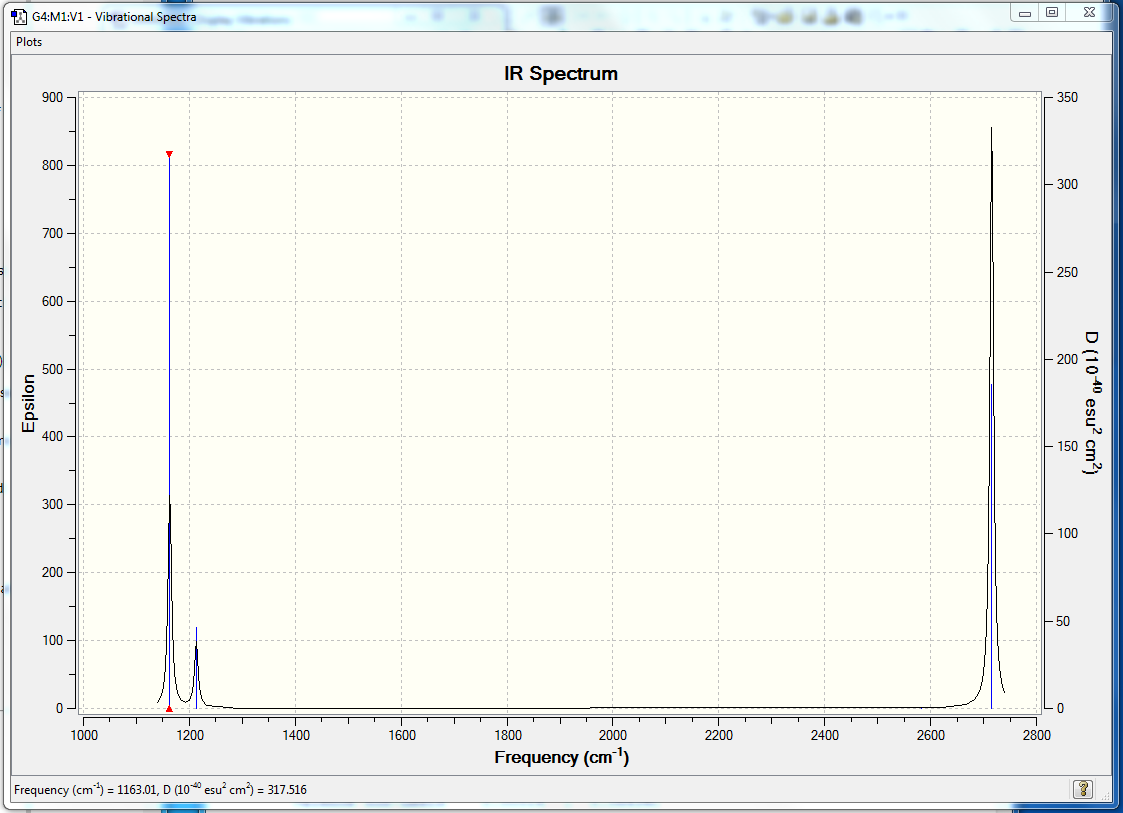
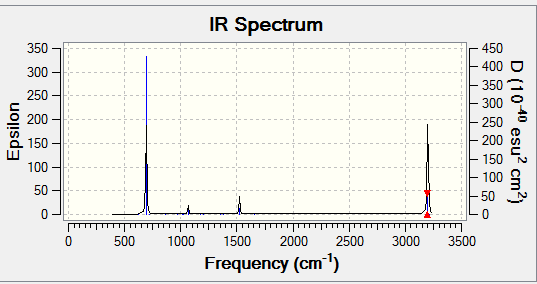
Figure 3 The expected IR spectrum of BH3
• Explanation to the vibration modes and the IR spectrum
There six vibration modes in total which agrees with the 3N-6 rule. However, only three signals can be found on the expected spectrum. The symmetric stretch mode is not IR active due to the fact that it does not result a change in the dipole moment. The two bending modes are energetically degenerate and the two asymmetric stretches are energetically degenerate causing the overlapping of the signals, resulting in only 3 signals could be found in the IR spectrum.
Visualising molecular orbitals of BH3
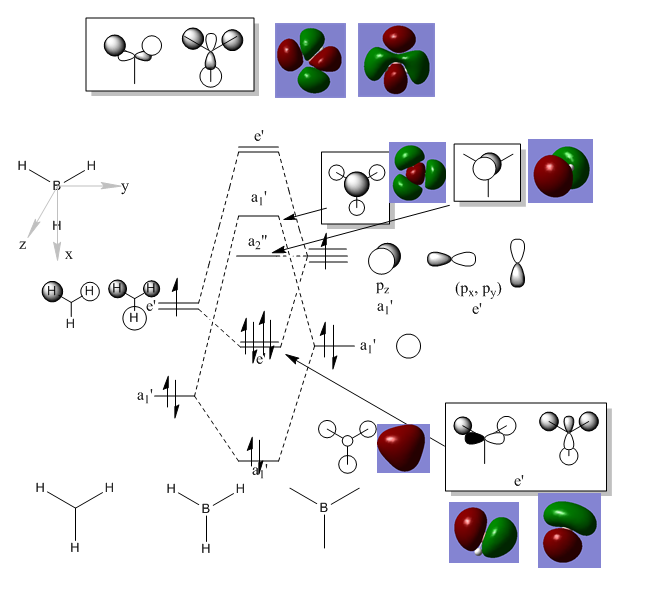
•There is no significant difference between MO theory and MO. How ever more interaction needs to be taked into consider when computing MO. Ng611 (talk) 23:48, 15 May 2018 (BST) 'more interaction' is a little vague. What exactly do you mean. You're correct for saying that there are minimal significant differences though.
• MO is extremely accurate and useful for finding structures and estimate energies of molecules.
Figure 4 the MO diagram and MO visualisation of BH3
Association energy
We first need to optimize BH3NH3.
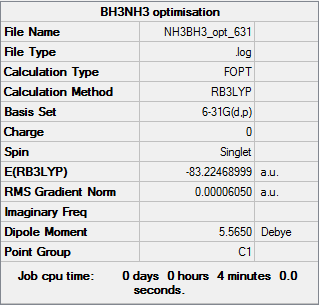
Figure 5 summary table of NH3NH3 optimisation
We then need to optimize NH3.
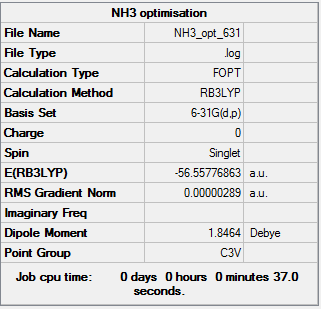
Figure 6 summary table of NH3 optimisation
By the principle of Hess's Law: Calculation of dissociation energy:
E(NH3)=-56.55776863 a.u.
E(BH3)=-26.61531647 a.u.
E(NH3BH3)=--83.22468999 a.u.
ΔE=E(NH3BH3)-[E(NH3)+E(BH3)]
  =-83.22468999+56.55776863+26.61531647
  =-0.05160489 a.u.
  =-135 KJ/mol
BBr3 Molecule
BBr3 Molecule optimisation
Optimization method used: RB3LYP
Basis set used: GEN
Figure 7 summary table of BBr3 optimisation
  Item               Value     Threshold  Converged?
 Maximum Force            0.000008     0.000450     YES
 RMS     Force            0.000005     0.000300     YES
 Maximum Displacement     0.000036     0.001800     YES
 RMS     Displacement     0.000023     0.001200     YES
Table 4 the item table for BBr3 optimisation
Frequency analysis of BBr3
Low frequencies ---   -0.1016   -0.0466   -0.0053  108.8524  109.2834  109.2835
Low frequencies --- 1166.7548 1215.7105 1215.7131
Table 5 the frequency table for BBr3 frequency analysis
Link to log file: Media:YR_BBr3_FREQ.log
Dspace Link:
Project: Aromaticity
Optimization method used: RB3LYP
Basis set used: 6-31G (d.p)
Benzene molecule
Figure 8 Summary table of benzene
Benzene optimization
        Item               Value     Threshold  Converged?
Maximum Force            0.000199     0.000450     YES
RMS     Force            0.000081     0.000300     YES
Maximum Displacement     0.000847     0.001800     YES
RMS     Displacement     0.000299     0.001200     YES
Table 5 the item table for benzene
Benzene frequency analysis
Link to the log file: Media:YR_C6H6_FREQ.LOG
Low frequencies ---   -4.6046   -4.6046   -0.0088   -0.0042   -0.0041    9.6590
Low frequencies ---  413.9386  413.9386  621.1428
Table 6 low frequencies of benzene
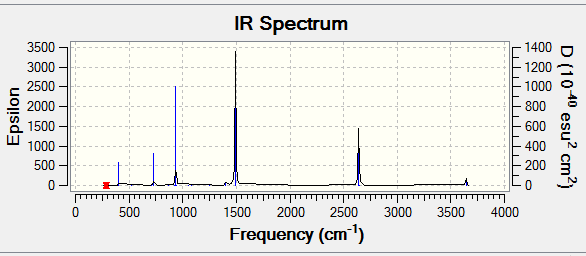
Figure 9 Expected IR of benzene
• No negative frequeny found
Benzene molecule |
Figure 10 Jmol of benzene
Benzene molecule
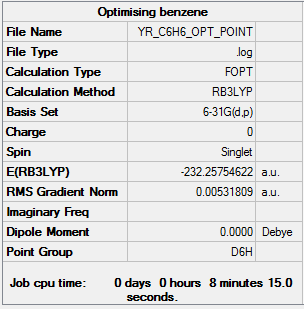
Borazine optimization
        Item               Value     Threshold  Converged?
Maximum Force            0.000085     0.000450     YES
RMS     Force            0.000033     0.000300     YES
Maximum Displacement     0.000251     0.001800     YES
RMS     Displacement     0.000075     0.001200     YES
Table 7 the item table for borazine
Borazine frequency analysis
Link to log file:Media:YR_B3N3_FREQ.LOG
Low frequencies ---   -6.8010   -6.4836   -6.4658   -0.0101   -0.0050    0.1536
Low frequencies ---  289.1988  289.2075  403.7534
Table 8 low frequencies of borazine
Figure 12 Expected IR of borazine
• No negative frequeny found
Borazine molecule |
Figure 13 Jmol of benzene
Charge analysis and intepretation
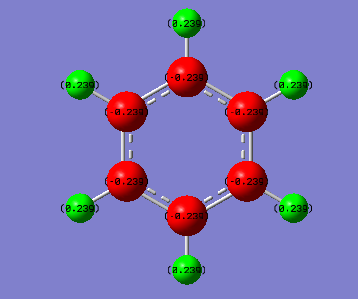
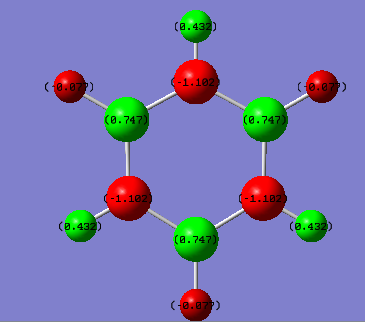
figure 14 (a) charge distribution of benzene (left) (b) charge distribution of borazine (right)
| element (cm-1 | charge (e) | electronegativity |
| C | -0.239 | 2.5 |
| H | +0.239 | 2.1 |
| element (cm-1 | charge (e) | electronegativity |
| N | -1.102 | 2.5 |
| H-B | -0.077 | 2.1 |
| H-N | 0.432 | 2.1 |
| B | 0.747 | 2.0 |
figure 9 (a) charge distribution of benzene (top) (b) charge distribution of borazine (bottom)
Discussion: For benzene molecule. All the C atoms are carrying the same charge and are δ-. All H atoms carries the same charge and are δ+ due to it is less electonegative compared to C.The charges are evenly distributed in the molecule resulting no net dipole-moment. This is due to the high symmetry of the molecule, which has D6h point group. This shows that the molecule has a C6 rotation axis and therefore all the 6 C are equivalent and all 6 H are equivalent.
However, the borazine molecule is less symmetric compared to benzene and has only a D3h symmetry with a C3 rotation axis. There 3 H of the 6 H are equivalent, and the rest 3H are equivalent to each other. H connected to electronegative N becomes δ+ and the H connected to electropositive B becomes δ+.
Ng611 (talk) 23:50, 15 May 2018 (BST) Excellent discussion! Remember to use identical colour scales though for ease of visual comparison.
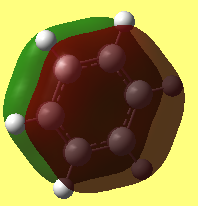
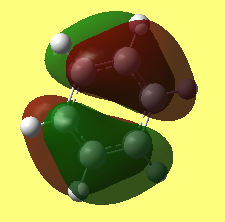
MO comparison of benzene and borazine
Ng611 (talk) 23:51, 15 May 2018 (BST) A reasonable MO analysis. I would add more rationalisation regarding differences between benzene and borazene's MO's
MO and aromaticity
Aromaticity describes a phenomenon that a planar cyclic molecule which satisfies Huckle's law are highly symmtric and extremely stable. Convensional ways view it as a struture with delocalisation of pi electrons. The resonance forms gives extreme stability. From MO point of view, it can be seen view as the the overlaping of orbitals, ie. Pz orbitals. As shown in the benzene and borazene MO above, many mixing of energy similar artomic orbitals of the same symmetry are found in aromatic compounds and this leads to the stabilization of the molecule.
The LCAO suggest that overlapping Pz gives the aromatic properties. However, this ignore many other orbital interaction resulting a inaccurate calculation to the the energy.
Ng611 (talk) 23:54, 15 May 2018 (BST) What you've written is true but it is a basic understanding that has largely been supplanted by more modern descriptions of aromaticity incorporating QM. A discussion of these modern models of aromaticity would have aided this discussion further, as would some additional discussion about experimental findings..
Ng611 (talk) 23:54, 15 May 2018 (BST) Adequate but missing a few bits. You generally didn't include the requisite data with your calculations, especially for NH3/BH3NH3 in Section1. Otherwise section 1 was good. Charge analysis was good but remember to use the same colour scale for both molecules. You also need to comment on the partial charges adding to 0 -- even if this is obvious to you, mention it. More detail in your MO discussion (WHY are the differences in orbital shapes) and your aromaticity discussion would have strengthened this section further.

