
Rep:Mod:YJY1234
BH3 analysis
A molecule of BH3 was drawn, optimized and analyzed using GaussView 5.0.9. Its vibrational mode and intensity, infra-red spectrum, molecular orbitals and NBO charge distribution were also computated and interpreted.
Structure Optimization
| File type | .log |
|---|---|
| Calculation type | FOPT |
| Calculation method | RB3LYP |
| Basis set | 3-21G |
| E (RB3LYP)/a.u. | -26.46 |
| RMS Gradient Norm/a.u. | 0.00020662 |
| Dipole Moment/Debye | 0.00 |
| Point group | D3h |
| Job CPU time | 5.0 s |
| Optimised B-H bond length/Å | 1.19 |
| Optimised H-B-H bond angle / ° | 120.0 |
The B-H bond length was set to be 1.50 Å before optimization, and the position of the boron atom was set to be fixed. After optimization, the bond length became 1.19 Å. This agrees with literature value [1] of B-H bond length of free BH3 molecules in gas phase. The optimized H-B-H angle is 120° , as expected from a trigonal planar molecule.
Diagram 1 - the relationship between optimization step number and total energy of optimized BH3

Diagram 2 - the relationship between optimization step number and RMS gradient norm of optimized BH3

We can see that the optimization is converged, as the final RMS gradient is less than 0.001.
Frequency analysis
| Mode number | Form of vibration | Description | Calculated frequency/cm-1 | Literature frequency[1]/ cm-1 | Infrared intensity | Symmetry |
|---|---|---|---|---|---|---|
| 1 |  |
Asymmetric stretching[2]: All H atoms move in and out of the BH3 plane in the same direction. The boron atom moves in the opposite direction, at a smaller amplitude. | 1144 | 1125 | 93 | a2" |
| 2 |  |
Two hydrogen atoms move towards and away from each other in the BH3 plane. The other H atom and the B atom moves perpendicularly in the BH3 plane, at a smaller amplitude. | 1204 | 1640 | 12 | e' |
| 3 |  |
Two H atoms and the boron atom rock in the BH3 plane. The other H atom rocks in the BH3 plane, in the opposite direction to the other two hydrogen atoms and at a larger amplitude. | 1204 | 1640 | 12 | e' |
| 4 |  |
Symmetric stretching [2]: All H atoms move towards and away from boron atom in the BH3 plane at the same amplitude. The central boron atom stays stationary. | 2598 | - | 0 | a1' |
| 5 |  |
One H atom stays stationary. The other two H atoms move towards and away from the central B atom such that when one B-H bond is compressed, the other one is stretched. The boron atom wags between the two moving H atoms at a smaller amplitude. | 2737 | 2808 | 104 | e' |
| 6 |  |
Two hydrogen atoms move towards and away from the central B atom at the same amplitude. The other H atom oscillates out of phase. The central boron atom moves toward and away from the oscillating H atom at a small magnitude. | 2737 | 2808 | 104 | e' |
| Comments | The calculated values are close to literature value, although they don't match perfectly. This is probably due to the approximations made in the modeling of the molecule and the calculations followed. | |||||
IR spectrum
Diagram 3 - the calculated IR spectrum of BH3

There are only three peaks in the spectrum, while there are six vibrations calculated. It is obvious that one of the vibrations will be missing from the spectrum, as its IR intensity was calculated to be 0 (mode number 4 in table 2). This because in this vibrational mode,the symmetric stretching of three 3 B-H bonds simultaneously at the same amplitude results in no change of overall dipole, hence IR inactive[3]. Furthermore, there are two degenerate vibrational frequencies occurring at 1204 cm-1 and 2737 cm-1. Therefore, 2 peaks (instead of the 4 peaks expected) are observed.
Molecular orbitals of BH3
Diagram 4 - The molecular orbital diagram of BH3

The file for of BH3 MO analysis:DOI:10042/to-9656
An MO digram of BH3 was constructed by linear combination atomic orbitals of the same symmetry. The "real" MOs in diagram 1 were computed using Gaussview, and they are included in the diagram for comparison with MOs constructed using LCAO method. There doesn't seem to be a significant difference in shape between the MOs constructed using two different methods. However, the computational method has a big advantage comparing to the LCAO method: it is able to determine the relative energies of the molecular orbitals. This is particular useful when the relative energies of two MOs are not immediately distinguishable by observation. For example, it would be difficult to decide whether 3a1' or 2e' is higher in energy using LCAO method. However using the computational method, the relative energies of MOs will be automatically calculated so we know that 3a1' is actually higher in energy.
NBO analysis
NBO analysis employs set of algorithms which dissect the electron distribution in a molecule into entitles that are familiar to chemists, such as the percentage of s and p orbitals in orbitals and the hybridization state of atoms.[4]
The results of NBO analysis are summarised below and the results are interpreted.
Diagram 5 - the NBO charge distribution of BH3

NBO analysis gives information about atomic natural charges. Diagram 5 shows that the NBO charge for boron is 0.332, while that for hydrogen is -0.111. As expected, the electron deficient boron has a positive charge.
Summary of Natural Population Analysis
                                      Natural Population
               Natural  -----------------------------------------------
   Atom  No    Charge         Core      Valence    Rydberg      Total
-----------------------------------------------------------------------
     B    1    0.33161      1.99903     2.66936    0.00000     4.66839
     H    2   -0.11054      0.00000     1.11021    0.00032     1.11054
     H    3   -0.11054      0.00000     1.11021    0.00032     1.11054
     H    4   -0.11054      0.00000     1.11021    0.00032     1.11054
=======================================================================
  * Total *    0.00000      1.99903     6.00000    0.00097     8.00000
The natural population analysis once again shows the natural charges of each atom in BH3.
Bond orbital/ Coefficients/ Hybrids
      (Occupancy)   Bond orbital/ Coefficients/ Hybrids
---------------------------------------------------------------------------------
    1. (1.99853) BD ( 1) B   1 - H   2
               ( 44.48%)   0.6669* B   1 s( 33.33%)p 2.00( 66.67%)
                                           0.0000  0.5774  0.0000  0.0000  0.0000
                                           0.8165  0.0000  0.0000  0.0000
               ( 55.52%)   0.7451* H   2 s(100.00%)
                                           1.0000  0.0000
    2. (1.99853) BD ( 1) B   1 - H   3
               ( 44.48%)   0.6669* B   1 s( 33.33%)p 2.00( 66.67%)
                                           0.0000  0.5774  0.0000 -0.7071  0.0000
                                          -0.4082  0.0000  0.0000  0.0000
               ( 55.52%)   0.7451* H   3 s(100.00%)
                                           1.0000  0.0000
    3. (1.99853) BD ( 1) B   1 - H   4
               ( 44.48%)   0.6669* B   1 s( 33.33%)p 2.00( 66.67%)
                                           0.0000  0.5774  0.0000  0.7071  0.0000
                                          -0.4082  0.0000  0.0000  0.0000
               ( 55.52%)   0.7451* H   4 s(100.00%)
                                           1.0000  0.0000
    4. (1.99903) CR ( 1) B   1           s(100.00%)
                                           1.0000  0.0000  0.0000  0.0000  0.0000
                                           0.0000  0.0000  0.0000  0.0000
    5. (0.00000) LP*( 1) B   1           s (  .00%)p 1.00(100.00%)
This section shows results of NBO partitioning the electron density of the whole molecule into atomic like orbitals. We can see that in a single bond between a boron atom and a hydrogen atom, 44.48% of the bond is contributed by boron orbitals, which has 33.33% s character and 66.67% p character. Thus, the boron forms 3 sp2 orbitals which interacts with s atomic oribtals from hydrogen. The boron lone pair is 100% in p character.
Second Order Perturbation Theory Analysis of Fock Matrix in NBO Basis
    Threshold for printing:   0.50 kcal/mol
                                                                             E(2)  E(j)-E(i) F(i,j)
        Donor NBO (i)                     Acceptor NBO (j)                 kcal/mol   a.u.    a.u.
===================================================================================================
within unit  1
  4. CR (   1) B   1                / 10. RY*(   1) H   2                    1.51    7.54    0.095
  4. CR (   1) B   1                / 11. RY*(   1) H   3                    1.51    7.54    0.095
  4. CR (   1) B   1                / 12. RY*(   1) H   4                    1.51    7.54    0.095
This section outlines the various interactions between various molecular orbitals.
Natural Bond Orbitals (Summary)
                                                           Principal Delocalizations
          NBO                        Occupancy    Energy   (geminal,vicinal,remote)
====================================================================================
Molecular unit  1  (H3B)
    1. BD (   1) B   1 - H   2          1.99853    -0.43712
    2. BD (   1) B   1 - H   3          1.99853    -0.43712
    3. BD (   1) B   1 - H   4          1.99853    -0.43712
    4. CR (   1) B   1                  1.99903    -6.64476  10(v),11(v),12(v)
    5. LP*(   1) B   1                  0.00000     0.67666
    6. RY*(   1) B   1                  0.00000     0.37177
    7. RY*(   2) B   1                  0.00000     0.37177
    8. RY*(   3) B   1                  0.00000    -0.04532
    9. RY*(   4) B   1                  0.00000     0.43446
   10. RY*(   1) H   2                  0.00032     0.90016
   11. RY*(   1) H   3                  0.00032     0.90016
   12. RY*(   1) H   4                  0.00032     0.90016
   13. BD*(   1) B   1 - H   2          0.00147     0.41201
   14. BD*(   1) B   1 - H   3          0.00147     0.41201
   15. BD*(   1) B   1 - H   4          0.00147     0.41201
      -------------------------------
             Total Lewis    7.99463  ( 99.9329%)
       Valence non-Lewis    0.00441  (  0.0551%)
       Rydberg non-Lewis    0.00097  (  0.0121%)
      -------------------------------
           Total unit  1    8.00000  (100.0000%)
          Charge unit  1    0.00000
In this section, the occupancy and energy of the B-H bond are recorded, as well as the lone pair. From the results, we can see that among the unoccupied orbitals (orbitals which have 0 occupancy), orbital 8 is the one with lowest energy (-0.04532 a.u.). This is known as the LUMO.
TlBr3 analysis
A molecule of TlBr3 was drawn, optimized and analyzed using GaussView 5.0.9 using the same method as BH3 above. As with BH3, the vibrational intensity and IR spectrum were computed.
Structure optimization
Optimization of the structure of TlBr3 was performed using GaussView 5.0.9.
| File type | .log |
|---|---|
| Calculation type | FOPT |
| Calculation method | RB3LYP |
| Basis set | LANL2DZ |
| E (RBG3LYP)/ a.u. | -91.22 |
| RMS gradient norm/a.u. | 0.0000009 |
| Point group | D3h |
| Job CPU time | 21 s |
| Optimised Tl-Br bond length/Å | 2.65 |
| Optimised Br-Tl-Br bond angle/° | 120.0 |
| Optimisation file | DOI:10042/to-9937 |
The optimized Tl-Br length is 2.65Å. Literature value[5] of Tl-Br bond length in TlBr3·4H2O, measured by X-ray diffraction, is 2.52Å. Another literature[1], which measures Tl-Br bond length of TlBr molecule in gaseous phase, is 2.62Å. The computer calculated bond length is reasonably close to literature values. The optimized Br-Tl-Br bond angle is 120.0°, which is as expected for trigonal planar structure.
Diagram 6 - the relationship between optimization step number and total energy of optimized TlBr3

Diagram 7 - the relationship between optimization step number and RMS gradient norm of optimized TlBr3

The final RMS gradient norm is 0.0000009 a.u., less than 0.001 a.u.. Thus the optimization of TlBr3 is converged.
Vibrational frequency analysis
| Mode number | Form of vibration | Description | Calculated frequency/cm-1 | Literature frequency[6]/ cm-1 | Infrared (intensity) | Symmetry |
|---|---|---|---|---|---|---|
| 1 |  |
Two bromine atoms move towards and away from each other. The remaining bromium and Tl atom move in the plane of TlBr3, at a smaller amplitude. | 46 | - | 4 | e' |
| 2 |  |
One of the bromine atoms move at a larger amplitude, towards one of the other two bromine atoms at a time. The other two bromine atoms and the Tl atom move at a smaller amplitude. | 46 | - | 4 | e' |
| 3 |  |
All three Br atoms move in and out of the TlBr3 plane in the same direction. The Tl atom moves in the opposite direction, at a smaller amplitude. | 52 | - | 6 | a2" |
| 4 |  |
All three Tl-Br bonds stretch symmetrically. The Tl atom stays stationary. | 165 | - | 0 | a1' |
| 5 |  |
One of the bromine atoms stay stationary. The other two Tl-Br bonds stretch asymmetrically. The Tl atom moves in the TlBr3 plane at a smaller amplitude. | 211 | 220 | 25 | e' |
| 6 |  |
Two Br atoms move towards and away from the central Tl atom in a concerted motion. The other Br atom moves away from the central atom when the other two atom move towards it. | 211 | 220 | 25 | e' |
File for vibrational frequency analysis of TlBr3: DOI:10042/to-9944
The literacy IR frequency appears very close to the calculated frequency, although not exactly the same. This is probably because in literature, the IR was measured for TlBr3 in solution. TlBr3 exists as TlBr3(OH2)2 in solution. The presence of complexed water molecules may affect the position of the peak.
Diagram 8 - the calculated IR spectrum of TlBr3

There are 6 TlBr3 molecular vibrations, but only 3 peaks in the IR spectrum. This is because firstly, one of the vibrations (mode number 4) has zero IR intensity, so it is not observed in the spectrum. Secondly, mode number 1 and 2 are degenerate, so only one peak would be observed in the spectrum. The same goes for mode number 5 and 6.
The same method and basis set need to be used for both optimization and frequency calculation. This is because by definition, vibrational analysis is valid only when the first derivatives of the energy with respect to displacement of the atoms are zero.[7]If different method/basis set were used for vibrational calculation, the result of the vibrational analysis would not be valid, as the computed structure would not correspond to the optimized structure.
A frequency analysis essentially involves taking the second derivative of the potential surface, hence obtaining positive frequencies confirms that the structure obtained was a minimum. The IR spectrum, including the peak position and intensity, are computed, which can be compared with literature.
The "low frequencies" for TlBr3 are at -3 cm-1, -0.0026 cm-1, -0.0004 cm-1, 0.0015 cm-1, 4 cm-1 and 4 cm-1 (values are rounded). The lowest "real" normal mode is at 46 cm-1, much higher than the "low frequencies".
In some structures, Gaussview do not draw in the expected bonds. This does not necessarily mean there is no bond. The software has an internal list of bond distances. If the computed bond length is outside this, Gaussview would not draw in the bonds. This internal list of bond distances are for organic molecules. However for this study we are mainly working with inorganic molecules, which typically have longer bonds comparing to organic molecules.
A chemical bond is the attraction force between the negatively charged electron cloud and two or more positively charged nuclei, which holds the atoms together to allow the formation of chemical compounds. Throughout history, there have been lots of models established in attempt to explain the properties of a bond, the most famous among them are the ionic model, in which the atoms were considered to be charged spheres, held together by electrostatic attractions between them. The ultimate description of a chemical bond lies in quantum mechanics, which involves solving the Shrödinger equation. However this equation can only be solved exactly for two particles.
Isomers of Mo(CO)4L2
In this section, the relative thermal stability and spectral characteristics of the cis and trans isomers of Mo(CO)4(PCl3)2 are predicted using GaussView 5.0.9.
Structure optimisation
| Properties | cis-Mo(CO)4(PCl3)2 | trans-Mo(CO)4(PCl3)2 |
| Molecule | 
|
|
|---|---|---|
| File Type | .log | .log |
| Calculation Type | FOPT | FOPT |
| Calculation Method | RB3LYP | RB3LYP |
| Basis Set | LANL2DZ | LANL2DZ |
| Final Energy/ a.u. | -623.5771 | -623.5759 |
| RMS Gradient Norm/a.u. | 0.00000847 | 0.00001183 |
| Dipole Moment/Debye | 1.3109 | 0.0002 |
| Job time | 51 minutes 29 seconds | 53 minutes 11 seconds |
| DOI | DOI:10042/to-9650 | DOI:10042/to-9649 |
| Bonds | Optimized bond length in the cis isomer/Å | Optimized bond length in the trans isomer/Å | Literature[1]/Å |
|---|---|---|---|
| Mo-C | 2.01 (trans to PCl3 groups); 2.06 (cis to PCl3 groups) | 2.06 | 2.11 |
| C=O | 1.17 | 1.17 | 1.17 |
| Mo-P | 2.51 | 2.45 | 2.46 (For general M-PMe3 length) |
| P-Cl | 2.24 | 2.24 | 2.01 (determined from X-ray and neutron diffraction
measurements on organic crystals) |
According to table 5, the energy of the cis isomer is only slightly lower than the trans isomer (by 0.0012 a.u., 3.15 kJ mol-1). Initially, we would expect the trans isomer to be more stable, as the bulky PCl3 groups are further away. However, in the cis isomer, the Cl ligands are trans to CO ligands, which are good π acceptors. This trans interaction stabilises the whole isomer. This stabilisation energy is not big, as the cis isomer is also destabilized by the steric hindrance between the two PCl3 groups.
To alter the relative ordering of the cis and trans isomers, we can increase the size of L ligands in the PL3 groups, (for example, use Ph groups instead of Cl groups). This will largely increase the extent of steric clash between the two PL3 groups of the cis isomer. Eventually it is expected that the cis isomer would be destabilized more by steric hindrance than stabilised by trans interaction, and the trans isomer would be lower in energy.
Vibrational frequency analysis
File for cis isomer frequency analysis: DOI:10042/to-9652
File for trans isomer frequency analysis:DOI:10042/to-9651
| Mode number | Form of the vibration | Calculated frequency/cm-1 | Infrared intensity |
|---|---|---|---|
| 1 |  Click to view the GIF file Click to view the GIF file |
11 | 0 |
| 2 |  Click to view the GIF file Click to view the GIF file |
18 | 0 |
| 3 |  Click to view the GIF file Click to view the GIF file |
42 | 0 |
| Mode number | Form of the vibration | Calculated frequency/cm-1 | Infrared intensity |
|---|---|---|---|
| 1 | -5 | 0 | |
| 2 | -2 | 0 | |
| 3 | 37 | 0 |
Only a small amount of energy is required for low frequency vibrations to happen. In fact, the energy required is so small that the ground state vibrational levels are significantly depopulated at room temperature.[8] Therefore the complex undergoes such vibrations (in this case, the rocking mode) even at room temperature.
| Calculated frequency/cm-1 | Literature frequency*[9]/ cm-1 | Intensity |
|---|---|---|
| 1945 | 1935 | 763 |
| 1949 | 1943 | 1498 |
| 1958 | 1958 | 632 |
| 2023 | 2047 | 598 |
- The literature frequencies are obtained from experimental IR spectrum of cis-Mo(CO)4P(OPh)3 measured in tetrachloroethylene solution
| Calculated frequency/cm-1 | Literature frequency*[10]/ cm-1 | Intensity |
|---|---|---|
| 1950 | 1896 | 1745 |
| 1951 | 1896 | 1463 |
| 1977 | - | 0 |
| 2031 | - | 0 |
- The literature frequencies are obtained from experimental IR spectrum of trans-Mo(CO)4[P(OCH3)3]2
Comparing the data from table 9 and 10, we can see that the carbonyl stretching frequencies are different for the two isomers. In general, the frequencies are higher for the trans isomer. This is due to the different relative positions of the CO ligand to the PCl3 ligands. PCl3 is a π accepting ligand, therefore its position relative to the CO ligand will affect the CO bond strength, hence its frequencies.
For the cis isomer, the same number of bands predicted from symmetry were obtained. The molecule is not symmetrical, hence all the CO stretching bands are IR active. The trans isomer, on the other hand, is symmetrical. Therefore the bands at 1977 cm-1 and 2031 cm-1 are not observed due to very low/zero IR intensity (the symmetrical CO stretches result in no overall change in dipole moment).
The literature CO stretching frequencies are not well matched to the calculated values. This is partly because literature frequencies are for compounds with a slightly different L group. The other reason could be that Gaussview does not take the effect π back bonding from the metal to the carbonyl groups into account.
Diagram 9 - the calculated IR spectrum of cis Mo(CO)4(PCl3)2

Diagram 10 - the calculated IR spectrum of trans Mo(CO)4(PCl3)2
![]()
Miniproject:Explore bonding in main group halides
Introduction
In this miniproject, four isomers of Al2Cl4Br2 are investigated using computational methods in attempt to see which of the four structures is preferred. The IR spectra of the four compounds are computed and compared, and the MOs of one of the isomers are computed as well. The NBO charge distribution of the four isomers are also calculated and compared to illustrate the effect of bonding on the charge distribution of atoms.
The structures of the four isomers are shown in the diagram below.

Optimisation
Optimisation allows us to find the most stable configuration of the four isomers and allows further analysis of the four molecules. By comparing the energies of the optimised structure, which of the four isomers is the most stable in energy can be found. The structures of the four molecules were optimised using GaussView 5.0.9 using the RB3LYP method and 6-31G(d) basis set. The maximum cycle was set to 50 to ensure the calculations would converge in a reasonable amount of time.
| Molecules | [1] | [2] | [3] | [4] |
|---|---|---|---|---|
| 3D optimised structure | 
|

|

|

|
| File type | .log | .log | .log | .log |
| Calculation type | FOPT | FOPT | FOPT | FOPT |
| Calculation method | RB3LYP | RB3LYP | RB3LYP | RB3LYP |
| Basis set | 6-31G(d) | 6-31G(d) | 6-31G(d) | 6-31G(d) |
| E (RB3LYP)/a.u. | -7469.54 | -7469.54 | -7469.54 | -7469.54 |
| RMS Gradient Norm / a.u. | 0.00000561 | 0.00002299 | 0.00000913 | 0.00000641 |
| Dipole Moment /Debye | 0.0012 | 0.9779 | 0.0018 | 1.1359 |
| Job CPU time | 28 minutes 50 seconds | 27 minutes 15 seconds | 25 minutes 25 seconds | 30 minutes 32 seconds |
| DOI files | DOI:10042/to-9675 | DOI:10042/to-9676 | DOI:10042/to-9677 | DOI:10042/to-9678 |
In table 11, the energy of the isomers are rounded to 2 d.p., hence the energies appear the same for all the isomers. To distinguish which isomer is the most stable one, the more accurate energy of each isomer are summarised table 12.
| Compounds | Compound [1] | Compound [2] | Compound [3] | Compound [4] |
|---|---|---|---|---|
| Energy / a.u. | -7469.54264968 | -7469.53789382 | -7469.53758998 | -7469.53762843 |
| Energy / kJ mol-1 | -1.9611284 ×10⁷ | -1.9611271×10⁷ | -1.9611271×10⁷ | -1.9611271×10⁷ |
We can see that compound [1] is slightly more stable than the other three compounds by 13 kJ mol-1. It seems that the bromine atoms prefer to stay in the bridging position. However, as the energy difference is quite small, the four isomers can probably undergo interchange at room temperature.
| Molecules | [1] | [2] | [3] | [4] | Literature[11] |
|---|---|---|---|---|---|
| Terminal Al-Cl bond length/Å | 2.10 | 2.10 | 2.10 | 2.10 | 2.06 |
| Terminal Al-Br bond length/Å | N/A | 2.23 | 2.23 | 2.23 | 2.23 |
| Bridging Al-Cl bond length/Å | N/A | 2.29, 2.31 | 2.30 | 2.30 | 2.25 |
| Bridging Al-Br bond length/Å | 2.44 | N/A | N/A | N/A | 2.43 |
| Terminal Br-Al-Br bond angle/° | N/A | 125.4 | N/A | N/A | 122.1 |
| Terminal Cl-Al-Cl bond angle/° | 120.3 | 121.0 | N/A | N/A | 122.1 |
| Terminal Cl-Al-Br bond angle/° | N/A | N/A | 122.8 | 122.6 | - |
| Bridging Br-Al-Br bond angle/° | 92.0 | N/A | N/A | N/A | 91.7 |
| Bridging Cl-Al-Cl bond angle/° | N/A | 91.2, 90.2 | 90.7 | 90.6 | 90.1 |
The literature values are taken from experimental measurements of AlCl6 and AlBr6. The calculated values appear well agreed with the literature values. The bridging Al-Cl/Al-Br bonds are slightly longer than the corresponding terminal Al-Cl/Al-Br bonds. This is because the terminal bonds are 2-centre-2-electron bonds while the bribing bonds are 3-center-2-electron bonds in which the three electrons are shared between the three atoms. As a result, the bridging bonds are longer and weaker than the terminal ones.
Vibrational Frequency analysis
Diagram 11 - the calculated IR spectrum of compound [1]

Diagram 12 - the calculated IR spectrum of compound [2]

Diagram 13- the calculated IR spectrum of compound [3]

Diagram 14 - the calculated IR spectrum of compound [4]

Comparing the key parts of the IR spectra of the four compounds, we can see that they all have a very weak peak at around 15 cm-1 due to ring pukering. In literature [11], ring pukering for Al2Cl6 occurs at 25 cm-1.
Molecules [2],[3] and [4] only have one weak peak at around 124 cm-1 due to Xt-Al-Xt wagging. In literature [11], Xt-Al-Xt wagging occurs at 123 cm-1 for Al2Cl6 and 89 cm-1 Al2Br6 .
Molecules [2],[3] and [4] also have a weaker peak at around 165 cm-1 due to ring bending. The ring bending frequency is at 219 cm-1 for Al2Cl6[11].
Unlike [2],[3] and [4],molecule [1] has three peaks in the 100-140 cm-1 region : 110 cm-1 due to Cl(t)-Al-Cl(t) rock, 126 cm-1 due to Cl(t)-Al-Cl(t) scissoring, 137 cm-1 due to ring bending, but lacks the peak at 165 cm-1 (the ring bending is shifted to 137 cm-1, which is due to the fact that for [1], Br atoms act as bridging atoms, instead of Cl) . In the literature report[11] for vibration peaks of Al2Cl6, Cl(t)-Al-Cl(t) rock is at 115 cm-1, Cl(t)-Al-Cl(t) scissoring is at 143 cm-1. For Al2Br6, ring bending occurs at 139 cm-1 in literature[11].
All four molecules have a peak at around 270 cm-1 due to Al-X(b) stretching, but the peak is more intense for compound [1], while less intense for the other compounds, especially for compound [2]. In literature[11], Al-Cl(b) stretching is at 281 cm-1 and Al-Br(b) stretching is at 247 cm-1.
In the 300-700 cm-1 region, compound [3] and [4] have almost identical peaks: a medium peak at around 412 cm-1 due to symmetrical stretching of Al-Cl(b), followed by a strong peak at 430 cm-1 due to asymmetric stretching of Al-Br (t), and a strong peak at 586 cm-1 due to asymmetric stretching of Al-Cl(t). There is a very weak peak at 472 cm-1 in the spectrum of compound [4] which is not present in the spectrum of compound [3]. In literature[11], symmetrical stretching of Al-Cl(b)is at 418 cm-1. Asymmetric stretching of Al-Br(t) occurs at 489 cm-1, and asymmetric stretching of Al-Cl(t) is at 614 cm-1.
The spectra of [1] and [2] in the 300-700 cm-1 region is quite different from that of [3] and [4].This is mainly due to the fact that [1] and [2] has identical terminal halogen atoms at each side of the molecule, while [3] and [4] has 1 terminal Cl and 1 terminal Br at each side of the molecule.
Compound [1] has one medium peak at 366 cm-1 due to Al-Br(b) symmetrical stretching, followed by two strong peaks at 471 cm-1 due to Al-Cl(t)symmetrical stretching and 602 cm-1 due to Al-Cl(t) stretching. In literature[11], Al-Br(b) symmetrical stretching is at 342 cm-1, Al-Cl(t)symmetrical stretching is at 483 cm-1, Al-Cl(t) stretching is at 626 cm-1.
Compound 2 has a weak peak at 324 cm-1 which is not present in any other compounds. It has a strong peak at 417 cm-1 due to Al (close to the 2 terminal Br atoms - Cl(b) symmetrical stretch, followed by two distinct medium peaks at 504 cm-1 due to Al (close to 2 terminal Cl atoms - Cl(b) and 535 cm-1 Al-Br(t) asymmetric stretch. None of the other compounds have any peaks in the 500-550 cm-1 region. The peak at 609 cm-1 is due to Al-Br(t) asymmetric stretch. All compounds have a peak near 600 cm-1, but the peak is less intensive for compound 2.
The file for vibrational analysis of [1]:DOI:10042/to-9680
The file for vibrational analysis of [2]:DOI:10042/to-9681
The file for vibrational analysis of [3]:DOI:10042/to-9682
The file for vibrational analysis of [4]:DOI:10042/to-9683
MO analysis
The molecular orbitals of compound [1] was calculated using Gaussview using the same method and basis set as optimization.
There are 82 occupied MOs in total, and it would be very difficult to document all the occupied MOs here. Therefore, only the core molecular orbitals are documented and analyzed.
Diagram 15 - the core MOs of compound [1]
 HOMO-6 |
 HOMO-5 |
 HOMO-4 |
 HOMO-3 |
 HOMO-2 |
 HOMO-1 |
 HOMO |
 LUMO |
 LUMO+1 |
you should examine the electronic structure analysing the MOs of one molecule in some detail, this means documenting ALL the occupied and non-core MOs, considering only the HOMO and LUMO is not sufficient. Do not examine unoccupied orbitals except for the 1 and 2LUMO, LUMO orbitals are not well represented by the methods you are using. You should pick 5-10 MOs to discuss in detail (considering their LCAO make-up, bonding characteristis
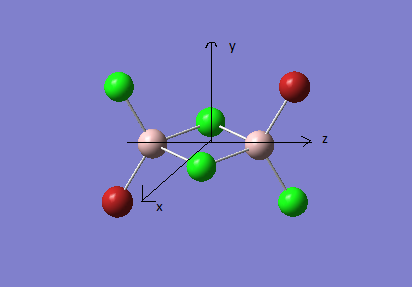
In the discussion below, the axis are labelled as below
Diagram 16 - the definition of axis
| MOs | LCAO make up | Discussions |
|---|---|---|
| HOMO-6 | py orbitals from the 4 Cl atoms; py orbitals from the 2 Br atoms | The bonding interactions between the py orbitals of the 2 Cl atoms on each side stabilize the whole molecule. The antibonding interactions between the two py orbitals of the Br atoms destabilizes the atom. The overall effect is stabilizing. |
| HOMO-5 | Pz orbitals from the 4 Cl atoms; pz orbitals from the 2 Br atoms | The bonding interactions between the pz orbitals of the 2 Cl atoms on each side stabilize the whole molecule. The bonding interactions between the pz orbitals of the 2 Br atoms also stabilize the whole molecule. The antibonding interactions between the pz orbitals of Cl and Br is destabilizing. The antibonding interactions between the pz orbitals of Cl atoms on different sides of the molecule is destabilizing as well. However as the atoms are further away, the interaction is weak and the overall effect is stabilizing. |
| HOMO-4 | 4 py orbitals from the 4 Cl atoms | The interactions between these py orbitals are mainly antibonding interactions, hence destabilizes the molecule. |
| HOMO-3 | py orbitals from the 4 Cl atoms; pz orbitals from the 2 Br atoms | The bonding interactions between the py orbitals of the 2 Cl atoms on each side stabilize the whole molecule. The antibonding interactions between the 2 Br pz orbitals are destabilizing. The interactions between the Br orbitals and the Cl orbitals are also destabilizing. The overall effect is stabilizing. |
| HOMO-2 | 4 pz orbitals from the 4 Cl atoms | The interactions between these pz orbitals are mainly antibonding interactions, hence destabilizes the molecule. |
| HOMO-1 | py orbitals from the 4 Cl atoms;px orbitals from the 2 Br atoms | Antibonding interactions between the py orbitals of the 2 Cl atoms on each side destabilize the whole molecule. Antibonding interactions between the px orbitals of the 2 Br atoms are destabilizing as well. There are weak bonding interactions between py orbitals of Cl atoms on different sides of the molecule which stabilizes the molecule. |
| HOMO | pz orbitals from the 4 Cl atoms; px orbitals from the 2 Br atoms | The antibonding interactions between the pz orbitals of the 2 Cl atoms on each side destabilize the whole molecule; The bonding interactions between the 2 Br px orbitals stabilizes the whole molecule. |
The file for MO analysis of [1]:DOI:10042/to-9685
NBO analysis
Diagram 16 - the NBO charge distribution of [1]

Diagram 17 - the NBO charge distribution of [2]

Diagram 18 - the NBO charge distribution of [3]

Diagram 19 - the NBO charge distribution of [4]

Comparing diagram 17, 18 and 19, we can see that the terminal atoms have an impact on the charge distributions of the Al atoms. When Al is linked to 2 Cl atoms, it has the most positive charge (0.528); when Al is linked to 1 Br and 1 Cl, the charge is slightly more negative (0.493); when Al is linked to 2Br atoms, the charge is the most negative (0.457). This is an expected result. Cl is more electronegative than Br, hence will attract the electron cloud surrounding Al more, and hence Al will become more positively charged.
Comparing diagram 16 and 17, we can see that the bridging atoms have an impact on the charge distribution of the Al atoms. When Al is linked to 2 Br atoms, it has the more negative charge (0.528); when it is linked to 2 Cl atoms, it is more positively charged (0.532). This can also be explained by the fact that Cl is more electronegative than Br, hence attracts the electron cloud surrounding Al more.
Bridging Cl atoms appear to be more positively charged than terminal Cl atoms. The bridging Cl, which is part of the 3-center-2-electron bond, is expected to be more positively charged than the terminal 2-centre-2-electron bond. A study [12]of technetium tetrahalides by Weck et al., produced similar results: the terminal halogens appear to be more negatively charged than bridging halogens. Also, if we compare diagram 16 and 17, we can see that bridging Br atoms appear to be more positively charged than terminal Br atoms as well.
The file for NBO analysis of [1]:DOI:10042/to-9685
The file for NBO analysis of [2]:DOI:10042/to-9686
The file for NBO analysis of [3]:DOI:10042/to-9687
The file for NBO analysis of [4]:DOI:10042/to-9688
Conclusion
From optimization of the four molecules, we know that structure [1] is the most stable among the 4 structures. The vibrational frequencies compare well with literature, and it was found that substituting Cl by Br has the effect of lowering the vibrational frequency. In the NBO analysis, it was found that the charge distribution of the halogen atoms depends on their position within the molecule. Bridging halogen atoms are more positively charged than terminal halogen atoms due to the 3-centre-2-electron bonds spreading out the electrons in the bridging bonds.
References
- ↑ 1.0 1.1 1.2 1.3 W. M. Haynes , David R. Lide et al., "CRC handbook of chemistry and physics", 2001, 92th edition, pp.9-12, 9-17, 9-18, 9-21, 9-30, 9-102
- ↑ 2.0 2.1 J.C.Merlin, J.P.Conard, J. Chem. Educ., 2006, 83, 1393:DOI:10.1021/ed083p1393
- ↑ P.J. Larkin, "Infrared and Raman Spectroscopy; Principles and Spectral Interpretation", 2011, 1st edition, pp.14
- ↑ E.G. Lewars, "Modeling marvels: computational anticipation of novel molecules", 1st edition, 2008, pp.28
- ↑ J. Glaser, Acta Chem. Scand. ,1979, 33a, 789
- ↑ J. Blixt, J.Glaser, et al., J. Am. Chem. Soc., 1995, 117, 5089: DOI:10.1021/ja00123a011
- ↑ http://www.gaussian.com/g_whitepap/vib.htm#SECTION00035000000000000000/ Accessed 28/10/2011
- ↑ Y. C. Shen, P. C. Upadhya, E. H. Linfield, and A. G. Davies, Appl. Phys. Lett., 2003, 82, 2350: DOI:10.1063/1.1565680
- ↑ D.J. Darensbourg, R.L. Kump, Inorg. Chem., 1978, 17, 2680: DOI:10.1021/ic50187a062
- ↑ F. A. Cotton, Inorg. Chem., 1964, 3, 702: DOI:10.1021/ic50015a024
- ↑ 11.0 11.1 11.2 11.3 11.4 11.5 11.6 11.7 11.8 K.Aarset, Q. Shen, et al., J. Phys. Chem. A., 1999, 103, 1644
- ↑ P. F. Weck, E.Kim et al.,Inorg. Chem., 2009, 48, 6555"DOI:10.1021/ic900476m