Rep:Mod:YH11218
NH3 molecule
Summary of optimisation results
| Calculation Method | RB3LYP |
| Basis Set | 6-31G(d.p) |
| E(RB3LYP) | -56.55776873 a.u. |
| RMS Gradient Norm | 0.00000485 a.u. |
| Point Group | C3V |
Geometric information
| Bond Length (N-H) | 1.02 Å |
| Bond Angle (H-N-H) | 106° |
Item table
       Item                Value       Threshold  Converged?
 Maximum Force            0.000004     0.000450      YES
 RMS     Force            0.000004     0.000300      YES
 Maximum Displacement     0.000072     0.001800      YES
 RMS     Displacement     0.000035     0.001200      YES
Jmol dynamic image with .log file link
The optimisation file is linked to here
Vibrational frequency
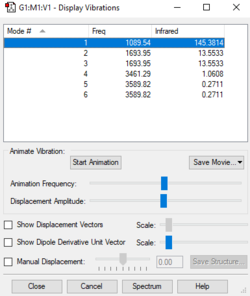
| Wavenumber (cm-1) | 1090 | 1694 | 3461 | 14 | ||
| Symmetry | A1 | E | A1 | E | ||
| Intensity | 145 | 14 | 1 | 0 | ||
| Image | 
|
 
|

|
 
| ||
The number of vibrational modes can be determined by using the 3N-6 rule for non-linear molecules, where N is the number of atoms. Since NH3 has four atoms, it would be expected that there will be six vibrational modes as shown by the number of frequencies in the Screenshot of "Display Vibrations" window in Gaussview. There are two pairs of modes which are degenerate (i.e. identical values for 'Infrared'): Mode #2/#3 and Mode #5/#6. The frequencies at 1089.54cm-1 and 1694cm-1 are bending vibrations whilst the other modes are stretching vibrations. Mode #4 is highly symmetric and Mode #1 is known as the 'umbrella' mode. Since there are two pairs of degenerate frequencies, only four bands would be expected to be seen experimentally. However since Mode #4 and Mode #5/#6, have a very low intensity (approximately 1 and 0, respectively), only the frequencies for Mode #1 and Mode #2/3 will be seen i.e. two bands.
Charge analysis
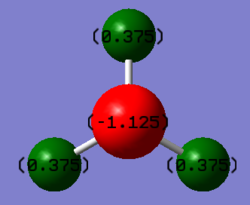
| Nitrogen | –1.125 |
| Hydrogen | 0.375 |
According to the Pauling scale of electronegativity ('the power of an atom to attract electrons to itself'[1]), nitrogen and hydrogen have an electronegativity of 3.04 and 2.20 respectively. Therefore it would be expected that nitrogen has a negative charge whilst the three hydrogens have a positive charge.
- ↑ IUPAC, Compendium of Chemical Terminology, 2nd ed. (the "Gold Book") (1997). Online corrected version: (2006–) "Electronegativity". doi:10.1351/goldbook.E01990
N2 molecule
Summary of optimisation results
| Calculation Method | RB3LYP |
| Basis Set | 6-31G(d.p) |
| E(RB3LYP) | -109.52412868 a.u. |
| RMS Gradient Norm | 0.00000060 a.u. |
| Point Group | D*H |
Geometric information
| Bond Length (N-N) | 1.11 Å |
Item table
       Item               Value       Threshold    Converged?
Maximum Force            0.000000     0.000450       YES
RMS     Force            0.000000     0.000300       YES
Maximum Displacement     0.000000     0.001800       YES
RMS     Displacement     0.000001     0.001200       YES
Jmol dynamic image with .log file link
The optimisation file is linked to here
Vibrational frequency

| Wavenumber (cm-1) | 2457 |
| Symmetry | SGG |
| Intensity | 0 |
| Image | 
|
Charge analysis
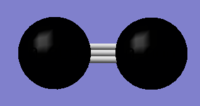
| Nitrogen | 0.000 |
Mono-metallic transition metal complex
DEKFUX |
The crystal structure DEKFUX can be found in the Cambridge Crystallographic Data Centre (CCDC)
| Bond Length (N-N) | 1.086 Å |
The N-N bond distance calculated computationally using Gaussian is different from the one determined experimentally in the crystal structure. The Gaussian calculation is limited by the calculaton method, RB3LYP, and basis set, 6-31G(d.p). A different computational chemistry software package may result in a more accurate value obtained for the bond length. It would be expected that the N-N bond is longer in the transition metal complex since the bond from the diatomic nitrogen ligand to Ru would weaken the N-N bond. The experimentally determined bond may be shorter due to the steric effects of other ligands surrounding the Ru atom.
H2 molecule
Summary of optimisation results
| Calculation Method | RB3LYP |
| Basis Set | 6-31G(d.p) |
| E(RB3LYP) | -1.17853936 a.u. |
| RMS Gradient Norm | 0.00000017 a.u. |
| Point Group | D*H |
Geometric information
| Bond Length (H-H) | 1.74 Å |
Item table
       Item               Value       Threshold   Converged?
Maximum Force            0.000001     0.000450       YES
RMS     Force            0.000001     0.000300       YES
Maximum Displacement     0.000000     0.001800       YES
RMS     Displacement     0.000000     0.001200       YES
Jmol dynamic image with .log file link
The optimisation file is linked to here
Vibrational frequency
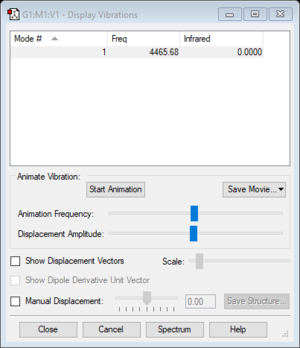
| Wavenumber (cm-1) | 4466 |
| Symmetry | SGG |
| Intensity | 0 |
| Image | 
|
Charge analysis
| Hydrogen | 0.000 |
Haber-Bosch Process
| E(NH3) | –56.55776(87) a.u. |
| 2×E(NH3) | –113.11553(75) a.u. |
| E(N2) | –109.52412(87) a.u. |
| E(H2) | –1.17853(94) a.u. |
| 3×E(H2) | –3.535618(08) a.u |
| ΔE=2×E(NH3)–[E(N2)+3×E(H2)] | –0.05579072 a.u. |
| –146.5 kJ/mol |
The most stable species will have the lower energy. Therefore the product, NH3, (–113.11553 a.u.) is more stable than the reactants, N2 and 3H2, (-113.05974 a.u.).
ClF5 molecule
Summary of optimisation results
| Calculation Method | RB3LYP |
| Basis Set | 6-31G(d.p) |
| E(RB3LYP) | -958.98366399 a.u. |
| RMS Gradient Norm | 0.00005949 a.u. |
| Point Group | C4V |
Geometric information
| Bond Length (Cl-F) | 1.70 Å |
| Bond Angle (F-Cl-F) | 86° |
Item table
      Item                Value       Threshold   Converged?
Maximum Force            0.000077     0.000450       YES
RMS     Force            0.000033     0.000300       YES
Maximum Displacement     0.000558     0.001800       YES
RMS     Displacement     0.000148     0.001200       YES
Jmol dynamic image with .log file link
The optimisation file is linked to here
Vibrational frequency
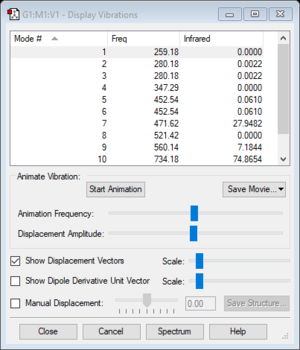
| Wavenumber (cm-1) | 259 | 280 | 347 | 453 | 472 | 521 | 560 | 734 | 804 | |||
| Symmetry | B2 | E | B1 | E | A1 | B2 | A1 | A1 | E | |||
| Intensity | 0 | 0 | 0 | 0 | 28 | 0 | 7 | 75 | 403 | |||
| Image | 
|
 
|

|
 
|

|

|

|

|
 
| |||
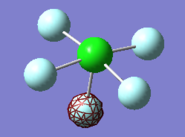
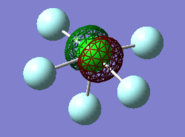
Using the 3N-6 rule, one would expect twelve vibrational modes. However only three or four modes would be seen in an experimental spectrum of ClF5. There are three pairs of degenerate modes (Mode #2/#3, Mode #5/#6 and Mode #11/#12). Furthermore only modes #7, #9, #10 and #11/#12 have an intensity greater than zero. Mode #9 has an intensity of seven and therefore would require a highly precise spectrometer in order to detect that vibrational mode.
Charge analysis

| Chlorine | 1.998 |
| Fluorine | –0.415 |
Fluorine has a higher electronegativity than chlorine (due to a high atomic number and small distance between the valence electron and the nucleus) and therefore fluorine will have a δ- charge since the electrons will be asymmetrically distributed towards the fluorine in the Cl-F bond.
Molecular orbitals
[CN]- molecule
Summary of optimisation results
| Calculation Method | RB3LYP |
| Basis Set | 6-31G(d.p) |
| E(RB3LYP) | –92.82453153 a.u. |
| RMS Gradient Norm | 0.00000005 a.u. |
| Point Group | C*V |
Geometric information
| Bond Length (C-N) | 1.18 Å |
Item table
       Item                Value      Threshold    Converged?
 Maximum Force            0.000000    0.000450        YES
 RMS     Force            0.000000    0.000300        YES
 Maximum Displacement     0.000000    0.001800        YES
 RMS     Displacement     0.000000    0.001200        YES
Jmol dynamic image with .log file link
The optimisation file is linked to here
Vibrational frequency
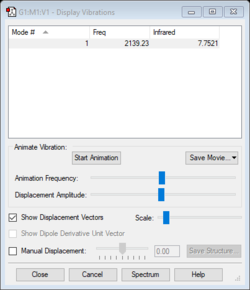
| Wavenumber (cm-1) | 2139 |
| Symmetry | SSG |
| Intensity | 8 |
| Image |
Since CN- is a diatomic linear molecule, the number of vibrational modes is one. The stretching vibrational mode involves a change in dipole since the C-N bond is polar and is thereofre IR active.
Charge analysis
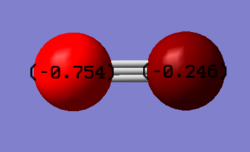
| Carbon | –0.246 |
| Nitrogen | –0.754 |
Nitrogen is the more electronegative atom compared to carbon (3.04 and 2.55, respectively) and therefore the nitrogen will attract electrons towards it. The NBO charge distribution value of is negative for both atoms since there is an overall -1 charge on the molecule.
Molecular orbitals
Marking
Note: All grades and comments are provisional and subject to change until your grades are officially returned via blackboard. Please do not contact anyone about anything to do with the marking of this lab until you have received your grade from blackboard.
Wiki structure and presentation 1/1
Is your wiki page clear and easy to follow, with consistent formatting?
YES
Do you effectively use tables, figures and subheadings to communicate your work?
YES
NH3 1/1
Have you completed the calculation and given a link to the file?
YES
Have you included summary and item tables in your wiki?
YES
Have you included a 3d jmol file or an image of the finished structure?
YES
Have you included the bond lengths and angles asked for?
YES
Have you included the “display vibrations” table?
YES
Have you added a table to your wiki listing the wavenumber and intensity of each vibration?
YES
Did you do the optional extra of adding images of the vibrations?
YES
Have you included answers to the questions about vibrations and charges in the lab script?
YES
N2 and H2 0.5/0.5
Have you completed the calculations and included all relevant information? (summary, item table, structural information, jmol image, vibrations and charges)
YES
Crystal structure comparison 0.5/0.5
Have you included a link to a structure from the CCDC that includes a coordinated N2 or H2 molecule?
YES
Have you compared your optimised bond distance to the crystal structure bond distance?
YES
Haber-Bosch reaction energy calculation 1/1
Have you correctly calculated the energies asked for? ΔE=2*E(NH3)-[E(N2)+3*E(H2)]
YES
Have you reported your answers to the correct number of decimal places?
YES
Do your energies have the correct +/- sign?
YES
Have you answered the question, Identify which is more stable the gaseous reactants or the ammonia product?
YES
Your choice of small molecule 3.5/5
Have you completed the calculation and included all relevant information?
YES
You could have more specific regarding the bond angles and lengths. E.g. the Fax-Cl-Feq bond angle is different from the Feq-Cl-Feq bond angle.
Have you added information about MOs and charges on atoms?
YES
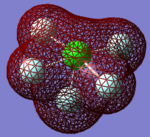
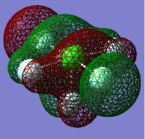
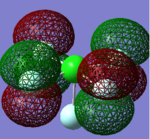
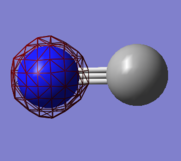
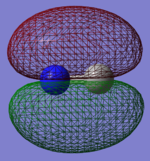
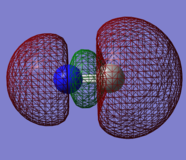
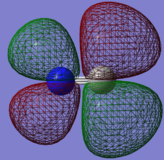
Your information on the MOs are correct but minimal and without any discussion. The first two MOs would be labelled as non-bonding because the have no effect on the overall bonding situation. The last MO is an out-of phase combination of the 2p orbitals. However, no overlap can be seen. Therefore, this as a non-bonding MO as well. You could have discussed the relative energies of the MOs.
Independence 1/1
If you have finished everything else and have spare time in the lab you could:
Check one of your results against the literature, or
Do an extra calculation on another small molecule, or
YES
Do some deeper analysis on your results so far

