
Rep:Mod:Y3LAWCHCOMP
Part 1A: Conformational Analysis using Molecular Mechanics:
The first part of this section investigates the relative energies of different conformations of molecules from which it is possible to predict whether a molecule is formed under kinetic or thermodynamic control. The relative energies of the different conformations investigated below were minimised using force field calculations based on the concepts of molecular mechanics. These computed energy values are termed 'steric energies', and the lower the energy values, the more stable the product.
i) Hydrogenation of Cyclopentadiene Dimer

The dimerisation of cyclopentadiene yields two possible product conformations- the exo- conformer (1) and the endo- conformer (2). The dimerisation of cyclopentadiene is an example of a Diels-Alder reaction, and it follows that the endo- product is the conformation that is preferentially adopted upon formation as described by the Woodward-Hoffmann rules for orbital symmetry.[1] For the computational analysis, the molecules were drawn on ChemDraw and imported into the ChemBio 3D software package to be minimised using MMFF94 molecular mechanics calculations. The resulting minimised energies are given in the table below:
| Product | Energy/ kcalmol-1 |
| Exo- | 55.3791 |
| Endo- | 58.1936 |
The results show that the endo- product is in fact the higher energy conformer of the two, which suggests that its formation is under kinetic control. The dimerisation is therefore predicted to be irreversible as the lower energy (i.e. most stable) conformer would be expected under reversible conditions. One reason why the kinetic product is favoured in this case may be due to possible orbital interactions between the two cyclopentadiene rings in the kinetic transition state which are not possible in the thermodynamic transition state as the orbitals are too far apart (rings 'facing away' from each other). Thus the kinetic transition state is more stabilised as the geometric overlap is more efficient.[2]
The hydrogenation of endo-dicyclopentadiene can also be investigated using molecular mechanics calculations. There are two double bonds present in the molecule, one of which may be initially reduced during hydrogenation to form one of two possible isomers, shown above as structures (3) and (4). For this example, the MMFF94 energy minimisation calculation predicts that isomer 4 is more stable than 3. A breakdown of this steric energy value into its five contributing terms (stretching, bending, torsion, van der waals and electrostatic terms) obtained using the Avogadro software is shown in the table below:
| Energy/ kcalmol-1 | |||||||
|---|---|---|---|---|---|---|---|
| Product | Steric Energy | Estr | Ebend | Etor | Evdw | Eelec | Eother * |
| 3 | 50.446 | 3.311 | 31.959 | -1.487 | 13.633 | 5.120 | -2.090 |
| 4 | 41.266 | 2.830 | 24.673 | -0.406 | 10.684 | 5.147 | -1.661 |
* Eother = Estr+bend + Enon-vdw contributions which reduce the minimum energy
The calculated results indicate that isomer 4 has the lower calculated energy, and thus is the predicted thermodynamic product. On the contrary, isomer 3 is the predicted kinetic product as it is has a higher steric energy. The isomer that is observed in reality is isomer 4 in which the double bond is retained on the 5-membered ring. The explanation for this observation comes from comparing the enthalpies of hydrogenation for a C=C double bond on cyclohexene and cyclopentene. The cyclohexene double bond has the higher enthalpy of hydrogenation and thus is the more reactive bond, and so hydrogen will add regioselectively across that double bond to yield a cyclohexane ring.[3] Therefore, the molecular mechanics calculation predicts that the hydrogenation takes place under thermodynamic control. The relative stability of the two isomers can be analysed by looking at the different energy components and their contributions to the minimised energy. It is indicated that the increase in steric energy for product 3 is mainly due to the larger Ebend and Evdw values, which are the contributions from unfavourable angles between atoms and non-bonded interactions. What is particularly interesting to note is that isomer 3 is predicted to be slightly more stable in terms of Estr and Etor contributions, although the difference in these values when compared to those found for isomer 4 is clearly less profound.

Atropisomers are stereoisomers that exist when there is an energy barrier of rotation that allows the isolation of two (or more) separate conformations. This is the case for one of the intermediates in the synthesis of taxol as suggested by Elmore and Pacquette.[4] The conformation adopted here will be the structure that is most stable (i.e. exhibits the lower steric energy). The two structures shown on the right exhibit only difference- the relative position of the carbonyl group, but it is the bridgehead olefin group that prevents ready interconversion between the two stereoisomers (alkenes like this are termed hyperstable). Both molecules (9) and (10) were drawn using ChemDraw and their energies calculated using the MMFF94 model in Avogadro and shown in the table below:
| Atropisomer | Energy/ kcalmol-1 |
| 9 | 70.5477 |
| 10 | 60.5716 |
It is clear from the results that atropisomer 10 has the lower energy of the two molecules, and thus is preferentially adopted. An inspection at the energy contributions reveals that the difference in energy can be attributed (almost) solely to the Ebend term (9 = 28.3491 kcalmol-1 , 10 = 18.8423 kcalmol-1 ). One explanation for why isomer 10 is favoured may be that the carbonyl group is pointing down with respect to the hydrogen atoms highlighted in the structures above, and this leads to an anti-periplanar arrangement with the hydrogen atoms and an approximate bond angle of 180 °. In atropisomer 9, the carbonyl group no longer has this favourable anti-periplanar arrangement as it is now pointed in the plane as the hydrogen atoms, which leads to an increase in the Ebend term.
By adjusting the positions of the atoms manually in a structure, it is possible to find the conformation of the molecule that will have the lowest steric energy and thus will most likely be adopted. Some modifications that could be made to ensure that the atropisomers above have the lowest energy are: i) drawing a chair conformation for the cyclohexane, ii) having an anti-periplanar relationship between the carbonyl group and the hydrogen atoms indicated. The lowest energy found for atropisomer 10 is the one discussed above; the lowest energy found for 9 is this conformation (9a) where the hydrogens are trans- to the one other and the hydrogen on the alpha carbon relative to the carbonyl group is pointing down (E = 62.2780 kcalmol-1 ).
In the atropisomers above, the C=C double bond is positioned adjacent to the 'bridgehead' group, and is described as being 'hyperstable'. Reactions towards hyperstable alkenes are typically not seen due to their thermodynamic stability, and it is this double bond that prevents the interconversion between the two stereoisomers. Bridgehead olefins in small rings are unfavoured according to Bredt's Rule mainly due to the fact that having a double bond in that position would be equivalent to having a trans- double bond in the ring which does not occur due to high ring and angle strains. However, the size of the ring in atropisomers 9 and 10 allows the accommodation of a bridgehead olefin (a violation of Bredt's Rule). According to Maier and Scheyler, a hyperstable olefin is defined as one in which the olefin strain (steric energy of polycycloalkene - steric energy of polycycloalkane) is a negative value.[5] Taking atropisomer 10 and its corresponding polycycloalkane as an example, it is found that the polycycloalkane has a higher steric energy (E = 90.5874 kcalmol-1 ), which generates an olefin strain value of approximately -30 kcalmol-1 . Analysis of the different contributions reveals that the stability of isomer 10 compared to its polycycloalkane is due to much smaller values for the Ebend and Etor terms. This indicates that there is greater angle and torsional strain in the polycycloalkane which in turn leads to the bridgehead olefin being more stable. Thus any addition reactions across this hyperstable double bond are likely to be unfavoured thermodynamically and very slow as the resulting product will be higher in energy.
Part 1B: Spectroscopic Simulations using Quantum Mechanics:
Aside from looking at steric energies and anaylsising the different energy contributions using molecular mechanics, it is also possible to simulate NMR spectra and carry out vibrational analyses to obtain the Gibbs Free Energy of the molecule using the Gaussian BLY3P quantum mechanical calculations. The accuracy of the generated spectra will depend on several factors which will be discussed below in relation to a second pair of intermediates in the synthesis of taxol. Other than chemical shifts, the spin-spin couplings can also be computed but due to the calculations taking up to 36 hours, this was not attempted.

On the right are shown two other intermediates 17 and 18 from the synthesis of taxol as described by Pacquette for which there is available spectroscopic data. As in Part 1A, the minimum energy of the molecules was initially calculated using the MMFF94 molecular mechanics model on Avogadro.
| Molecule | Energy/ kcalmol-1 |
| 17 | 129.7962 |
| 18 | 100.5115 |
The results and explanations of the minimised energies are essentially the same reasons as those explained for the atropisomers 9 and 10. Finding the lowest energy of the molecules is essential for the NMR simulation as the lower the steric energy, the more accurate the predicted spectrum will be and the better the chemical shifts will match with those recorded in the literature (providing the assignments there are correct). These predictions are often conformationally sensitive, and will lead to distorted shifts if not careful. The NMR spectrum is generated using the Gaussian extension in the Avogadro software by selecting the following parameters:
- Calculation = Opt+Freq; Theory = B3LYP; Basis Set = 6-31G(d,p); Key Words = FREQ (for vibrational analysis), NMR and EmpiricalDispersion=GD3
The solvent chosen for the Gaussian Input file for this exercise was benzene (chosen for valid comparisons to literature where the spectrum was recorded in deuterated benzene). Once these parameters were set, the input file was uploaded to the HPC for processing. The result of this is a Gaussian Checkpoint File DOI:10042/27304 which can be downloaded and opened in GaussView 5.0 where, if the quantum calculations were successful, the predicted NMR spectrum can be opened.
 |
 |
| Computed chemical shift/ ppm | Literature chemical shift[6]/ ppm |
| 5.97 | 5.21 |
| 3.12, 2.95, 2.89, 2.80 | 3.00-2.70 |
| 2.67, 2.54, 2.42 | 2.70-2.35 |
| 2.31, 1.98, 1.83 | 2.20-1.70 |
| 1.64 | 1.58 |
| 1.53, 1.34, 1.27, 1.21 | 1.50-1.20 |
| - | 1.10, 1.07, 1.03 |
| 0.96, 0.90, 0.60 | - |
The predicted 1H NMR of the taxol intermediate correlates fairly well with literature with the exception of two regions of the spectrum. Firstly, the predicted peak at 5.97 ppm is found to correlate to the peak at 5.21 ppm, which gives rise to a relatively large difference (0.76 ppm) compared to the differences between other values. These peaks represent the alkene proton which is shown on the structures above. Secondly, the peaks at the lower end of the spectrum also have a slightly larger difference (if 1.03 ppm peak corresponds to literature peak at 0.60, this leads to a difference of 0.43). Due to couplings between inequivalent protons, it is difficult in the experimentally obtained spectrum to assign individual peaks as seen in the regions 3.00-2.70 ppm and 2.70-2.35 ppm which are denoted as multiplets. This is not the case in the computationally predicted spectrum, in which the peaks can be attributed to individual protons. Another observation is that the literature assigned multiplet at 3.00-2.70 ppm corresponds to 6 protons (i.e. integration = 6), but for the four peaks corresponding to that region in the predicted spectrum gives rise to an 7 protons (sum of the degeneracies of the peaks = 7). This mismatch also occurs for the region between 1.50-1.20 ppm. It could be that the Gaussian software incorrectly predicts extra peaks in the wrong regions or that the spectrum in the literature is partially incorrect.
| Computed chemical shift/ ppm | Literature chemical shift[7]/ ppm | Difference/ ppm |
| 211.93 | 211.49 | 0.42 |
| 147.86 | 148.72 | 0.86 |
| 120.13 | 120.90 | 0.77 |
| 92.84 | 74.61 | 18.23 |
| 65.94 | 60.53 | 5.41 |
| 54.94 | 51.30 | 3.64 |
| 54.76 | 50.94 | 3.82 |
| 49.53 | 45.53 | 4.00 |
| 48.04 | 43.28 | 4.76 |
| 45.65 | 40.82 | 4.83 |
| 44.47 | 38.73 | 5.74 |
| 41.47 | 36.78 | 4.69 |
| 38.51 | 35.47 | 3.04 |
| 33.70 | 30.84 | 2.86 |
| 32.47 | 30.00 | 2.47 |
| 28.36 | 25.56 | 2.80 |
| 26.50 | 25.35 | 1.15 |
| 24.45 | 22.21 | 2.24 |
| 24.01 | 21.39 | 2.62 |
| 22.58 | 19.83 | 2.75 |
On the whole, the predicted and experimentally-found chemical shifts correlate very well for the 13C spectra. Because of the low natural abundance of 13C nuclei, these spectra are less complicated than the equivalent 1H spectra in terms of the absence of multiplicities and integration, which in this case allows each carbon atom to be assigned to an individual peak and for the literature and computed peaks to be paired up. Some obvious assignments include the carbonyl carbon being the peak with the highest chemical shift and the alkene carbons being the two peaks at approximately 148 ppm and 120 ppm. Only in three places is there a difference greater than 5 ppm between the computed and literature shifts, and the largest of these is for the predicted peak at 92.84 ppm which corresponds to the carbon atom on the cyclohexane ring which is bound to 2 sulphur atoms. The experimentally determined chemical shift is significantly lower due to spin-orbit coupling effects that are not accounted for in the quantum model, and correction factors should be applied in order to obtain a more accurate estimation. C-X correction factors have been well investigated for simulations involving halogenated compounds,[8] but less so for C-S containing compounds. The two other places where the difference between the predicted and literature quoted peaks is greater than 5 may indicate that the conformation of the molecule used to predict the NMR spectrum could be further minimised at the corresponding carbon atoms.
Vibrational analysis of the intermediates is also possible by inserting the key word 'FREQ', and thermodynamic parameters can be found from the log output file of the HPC calculation used for the NMR analysis. The calculated parameters for the taxol intermediate above (18) are shown below:
| Energy/ Hartree | |
| Zero-point correction | 0.467985 |
| Thermal correction to Energy | 0.489383 |
| Thermal correction to Enthalpy | 0.490328 |
| Thermal correction to Gibbs Free Energy | 0.421253 |
| Sum of electronic and zero-point Energies | -1651.415409 |
| Sum of electronic and thermal Energies | -1651.394010 |
| Sum of electronic and thermal Enthalpies | -1651.393066 |
| Sum of electronic and thermal Free Energies | -1651.462141 |
The first thing to note is the the energies are given in atomic units (also called a Hartree) and one Hartree = 627.15 kcalmol-1. The 'Sum of electronic and thermal free energies' is the calculated Gibbs Free Energy of the molecule = -1,036,308.36 kcalmol-1. It is also possible to obtain a free energy value for the other isomer (17) DOI:10042/27307 and make a comparison to see which of the two isomer is thermodynamically more stable. Isomer 17 gives a Gibbs Free Energy of -1651.442854 hartrees = -1,036,296.26 kcalmol-1, which gives a difference of the two isomers as approximately 12 kcalmol-1. This shows that isomer 18 is predicted to be more stable than isomer 17.
Part 2: Analysis of the Properties of the Synthesised Alkene Epoxides:
The second part of this computational module investigates the calculated properties and spectra of different epoxides. In recent years, the development of specialist catalysts for chiral synthesis has lead to reactions that will selectively produce one enantiomer, which can the be characterised using spectroscopy and polarimetry in a laboratory setting. As this experiment is linked with the 1S synthesis experiment, the same four starting alkenes will also be used for computational analysis. The crystal structures of the Shi and Jacobsen catalysts, some simulated NMR spectra and assignments of chosen epoxides using optical techniques will be presented below. Finally, a consideration of some non-bonded interactions will be presented using two models for one selected transition state of one of the catalysed epoxidations.
i) Crystal Structures of the Shi and Jacobsen Asymmetric Catalysts

The Shi and Jacobsen catalysts are two examples used in enantioselective epoxidation reactions. The Shi catalyst is an organocatalyst derived from fructose in which the stable pre-catalyst exhibits a carbonyl group which can be subsequently activated using oxone or peroxymonopersulfuric acid to the active catalyst. The Jacobsen catalyst is a manganese co-ordination compound that is bound to a tetradentate salen-like ligand and a chloride ligand in the stable pre-catalyst. Upon oxidation from the Mn(III) to the Mn(V) oxidation state, the catalyst becomes active and can catalyse epoxidations. The crystal structures of the two pre-catalysts were found by searching the Cambridge Crystal Database using the Conquest program and visualised using Mercury. These are shown below with a short discussion on some interesting structural features:

| O-C-O | Left O-C Bond Length/ Å | Right C-O Bond Length/ Å |
| O1-C9-O2 | 1.423 | 1.454 |
| O6-C2-O2 | 1.415 | 1.423 |
| O5-C10-O4 | 1.428 | 1.456 |
The Shi pre-catalyst crystal structure [9] contains three O-C-O bond frameworks within the molecule: O1-C9-O2, O6-C2-O2 and O5-C10-O4 (see diagram for labels). Typically an O-C-O fragment would suggest that anomeric effects are present, and this can be confirmed by analysis of the C-O bond lengths(the lone pair on one oxygen acts as the donor and the C-O σ* orbital (where this O is the other oxygen) acts as the acceptor). Donation into the C-O σ* orbital weakens that particular C-O bond and strengthens the donating O-C bond (due to partial double bond character),[10] and thus it can be observed by seeing one shortened C-O bond and one lengthened C-O bond. The bond lengths are given in the table below, from which it is seen that O6-C2-O2 does not exhibit any anomeric effect as there is only a small difference in the C-O bond lengths which is not a large enough difference to quantify any donor-acceptor behaviour. One reason for the slight difference in bond lengths may be due to the oxygen atoms being on different sized rings- O6 is situated on a 6-membered ring whereas O2 is situated on a 5-membered ring, and thus bonds are expected to be shorter in the 6-membered ring. Another explanation could be invoked by looking at the relative positions of the atoms- the lone pair on O6 cannot align itself anti-periplanar to the C2-O2 σ* orbital, and so an anomeric effect is not observed.

An analysis of the non-bonded interactions in the Jacobsen pre-catalyst crystal structure [11] shows one non-bonded interaction that corresponds to the interaction of the two carbon atoms of the tert-butyl groups as shown in the diagram on the right. This non-bonded interaction has a calculated distance of 3.697 Å, which is slightly greater than the sum of the van der waals radii of two carbon atoms (1.70 Å per carbon = total distance of 3.40 Å). The distance of two van der waals radii corresponds to the maximum attraction between two atoms, and in this case, as the distance between the two carbons is slightly greater than this value there will be a favourable, attractive non-covalent interaction present (albeit a relatively weak one). This close approach of carbon atoms means that the alkene can only approach the catalyst in a certain way (cannot approach on the face with the tert-butyl groups), and thus the resulting epoxide formed will be predominantly the cis- isomer and not the trans-. It has been investigated that having tert-butyl groups in these also leads to better enantioselectivity over both smaller and bulkier groups[12] (smaller groups e.g. methyl will either not show a non-bonded interaction as the distance between the methyl carbons would be too far apart or the interaction will be too weak to prevent a potential approach of the epoxide from that face; bulkier groups e.g. p-tolyl would reduce the distance between the interacting groups leading to unfavourable steric clashes).
ii) The calculated NMR Properties of the Products
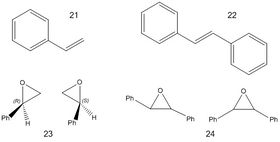
The two starting alkenes chosen for computational modelling in this wiki are styrene (21) and trans-stilbene (22), which when subjected to asymmetric catalysis can form either (R) or (S) styrene oxide (22) and cis or trans-stilbene oxide (23). There are four possible enantiomers for stilbene oxide (R,R; R,S; S,R and S,S). The NMR spectra for (S)-styrene oxide DOI:10042/10042/27303 , and both cis-stilbene oxide DOI:10042/27302 and trans-stilbene oxideDOI:10042/27301 were generated using the same method as that described above for the taxol intermediate with the exception that the solvent chosen for this exercise was chloroform in order to make valid comparisons with the literature data.
 |
 |
The quantum mechanically computed 1H and 13C NMR spectra of styrene oxide are shown above. The literature values of the 1H NMR chemical shifts are: 'δ/ ppm: 2.76, 3.10, 3.82, 7.27-7.33,'[13] which match the predicted values relatively closely. The 13C NMR seems to be in good agreement with what is expected. Whilst NMR spectroscopy is perhaps not the best method for distinguishing between enantiomers, it can be used to differentiate between diastereomers, for example, cis- and trans- stilbene oxide. The predicted spectra show that for the cis- form, the two phenyl rings will be in the same chemical environment,and thus there will be degenerate peaks, whereas for the trans- form,the two phenyl rings are no longer the same (the peaks will be found in the same region but will be separate). A second difference that can be observed in the predicted 1H NMR spectra is the chemical shift of the two protons at either end of the epoxide carbons- for protons that are cis- the peaks are found further downfield than the trans isomer.
 |
 |
iii) Assigning the Absolute Configuration of the Products
There are three chiroptic properties described in this section that can be used to assign absolute configurations of the epoxides under investigation: the Optical Rotatory Power (ORP), the Electronic Circular Dichroism (ECD) and the Vibrational Circular Dichroism (VCD). Optical Rotatory Power is a measure of the degree a chiral molecule is turned when exposed to a specific wavelength of plane-polarised light so that enantiomers can be distinguished purely by the direction of motion. It is also possible to assign chiral molecules using circular dichroism spectroscopy. In this technique, circular polarised light is shone onto a chiral molecule and the extent of the absorptions of both left-directed and right-directed circular polarised light is measured and the difference calculated. Electronic and vibrational CD spectra can be generated, but the techniques are relatively new and there are not many literature results for these spectra for comparison.
 |
Optical rotation remains the best method to assign absolute configurations for enantiomeric products. The calculation for the optical rotation was carried out by taking the log file of the quantum-mechanical optimised NMR output from the HPC and editing the file by inserting the key words polar(optrot) and CPHF=RdFreq. The file is then resubmitted to the HPC until the calculation has finished, which then allows the Gaussian log file to be downloaded and opened to reveal the calculated [ALPHA] value at 589 nm.
Styrene oxide= 30.47 deg. DOI:10042/27326 , lit. value = 32.1 deg[14]
Trans-stilbene oxide = 298.04 deg. DOI:10042/27338 , lit. value = 239.2 deg.[15]
Cis-stilbene oxide= -0.02 deg. DOI:10042/27341
Looking at the comparisons between the predicted value and the literature value, the calculated values for (S)-styrene oxide and trans-stilbene oxide correlate quite well. No suitable literature reference was found for cis-stilbene. If more time was available, more wavelengths would have been explored to see the effect of changing the wavelength of the plane-polarised light on the optical rotation.
iv) Using the calculated properties of transition state for β-methyl styrene

For this section, the transition state for the epoxidation of cis-β-methyl styrene and one of the catalysts is investigated (in this case the Jacobsen catalyst). Essentially, a comparison will be made between two diastereomeric transition states to see which one has the lowest Gibbs Free Energy (R,S [16] and S,R[17] cis-β-methyl styrene will be compared for this exercise).
For the (R,S)-isomer, the lowest Gibbs Free Energy of the transition state was found to be -3383.251060 Hartrees, which = -2,123,022.54 kcalmol-1. For the (S,R)-isomer, the lowest Gibbs Free Energy of the transition state was found to be -3383.259559 Hartrees, which = -2,123,027.88 kcalmol-1 .
(S,R) is shown to be the more stable isomer, and the Gibbs free energy difference = -5.34 kcalmol-1.
v) Investigating the Non-Covalent Interactions in the Active Site of One Reaction Transition State
Orbital |
Analysis of the non-covalent interactions in the active site of a reaction transition state can indicate certain things about a reaction for example the approach of the reactant and the stereochemical outcome of the product. The reaction transition state that has been selected is that of styrene oxide and the Shi catalyst.The checkpoint file was downloaded[18] and the electron density of the different positions in the transition state was calculated. The Shi catalyst is found to function by going through a specific geometry in its transition state- the spiro transition state or the planar transition state. The colour of the interactions shows that there are favourable interactions (green) taking place between the alkene and catalyst, but there are some yellow interactions, which are mildly repulsive between the phenyl ring of the methyl styrene and the catalyst, which pushes the phenyl group 'away' as the favourable interactions between the double bond and the catalyst, and thus predominantly trans alkenes are formed.
vi) Investigating the Electronic Topology (QTAIM) in the Active Site of One Reaction Transition State

vii) Potential New Candidate for Further Investigation
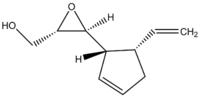
An interesting example that could be included in future investigations is 3-(5'vinylcyclopent-2'-enyl)oxirane-2-methanol, which has a literature value for the optical rotation of the (2S,3S,1'S,5'S)-isomer [ALPHA] = 304.6 deg at 578 nm.[19] This epoxide is a naturally occuring, biologically active molecule found in the brown alga Perithalia caudata which contains four stereocentres, corresponding to 16 possible stereoisomers (perhaps it is too complex given the large timescales required for the calculations, but if the files were provided it could prove to be an interesting exercise).
References:
- ↑ R. Hoffmann and R. B. Woodward, J. Am. Chem. Soc., 1965, 87, 2046
- ↑ W. C. Herndon and L. H. Hall, Tetrahedron Letters, 1967, 8, 3095
- ↑ P. T. T. Cheung, Encyclopedia Of Polymer Science and Technology, John Wiley & Sons, Inc., New York, 2001, vol. 5, pp. 759-776
- ↑ S. W. Elmore and L. A. Pacquette, Tetrahedron Letters,1991, 32, 319
- ↑ W. F. Maier , P. V. R. Schleyer, J. Am. Chem. Soc., 1981, 103, 1891
- ↑ L. A. Paquette, N. A. Pegg, D. Toops, G. D. Maynard and R. D. Rogers, J. Am. Chem. Soc., 1990, 112, 277
- ↑ L. A. Paquette, N. A. Pegg, D. Toops, G. D. Maynard and R. D. Rogers, J. Am. Chem. Soc., 1990, 112, 277
- ↑ M. Kaupp, O. L. Malkin and V. G. Malkin, Chem. Phys. Lett., 1997, 265, 55
- ↑ Z. Wang, S. M. Miller, O. P. Anderson and Y. Shi, J. Org. Chem., 2001, 66, 521
- ↑ A. Vila and R. A. Mosquera, J. Comput. Chem., 2007, 28, 1516
- ↑ J. W. Yoon, T. S. Yoon, S. W. Lee and W. Shin, Acta Crystallogr., Sect. C: Cryst. Struct. Commun., 1999, 55, 1766
- ↑ T. Katsuki,Coord. Chem. Rev., 1995, 140, 189
- ↑ D. B. Cordes, T. J. Kwong, K. A. Morgan and B. Singaram, Tetrahedron Letters, 2006, 47 349
- ↑ H. Lin, J. Qiao, Y. Liu and Z. Wu, J. Mol. Catal. B Enzym., 2010,67, 236
- ↑ S. Denmark and H. Matsuhashi, J. Org. Chem., 2002,67, 3479
- ↑ Rzepa, Henry S. (2013): Gaussian Job Archive for C37H46ClMnN2O3. figshare. http://dx.doi.org/10.6084/m9.figshare.740437
- ↑ Rzepa, Henry S. (2013): Gaussian Job Archive for C37H46ClMnN2O3. figshare. http://dx.doi.org/10.6084/m9.figshare.740436
- ↑ Rzepa, Henry S. (2013): Gaussian Job Archive for C20H26O7. figshare. http://dx.doi.org/10.6084/m9.figshare.823545
- ↑ D. Wirth, W. Boland and D. G. Müller, Helvetica Chimica Acta, 1992, 75, 751