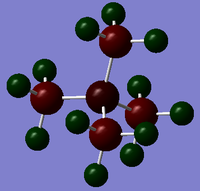
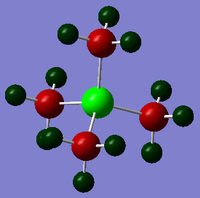
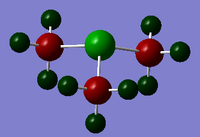
Rep:Mod:Y3INORGJW
Inorganic computational assignment - Week 1
Creating and optimising a BH3 molecule
Using 3-21G Basis set
The first part of this assignment involved the use of Gaussview to create a BH3 molecule with C1 symmetry by manually setting the bonds to three different bond lengths: 1.53, 1.54 and 1.55 Å. The BH3 molecule was optimised under the following commands:
method: B3LYP basis set: 3-21G calculation type: OPT
B3YLP is one of the energy functionals of the density functional methods(DFT). It is a hybrid functional and the energy reported in the DFT calculation is reported in a similar method to that of Hartree-Frock calculations. The use of the B3LYP method is combined with the basis set 3-21G which is an example of a split-valence basis set. Since in molecular bonding, it is the valence electrons that are involved in bonding, the valence electrons are represented by a composition of primitive Gaussian functions; thus giving rise to the 3-21G basis set. The method type OPT represents the energy optimisation calculation of the molecule. Under this selection of commands, Gaussian determines the optimum position of the nuclei of the BH3 molecule.
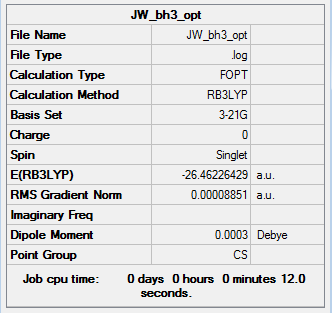
The optimisation of the BH3 molecule was checked to have been successful by checking that the gradient, which represents the rate of change of energy, is close to zero and that calculated set of forces and displacements had converged. This convergence shows that the force and displacement values has reached a constant value of approximately 0 and this represents the fact that the energy of the molecule remains constant when the nuclei undergo small displacements. The information is shown below.
 |
         Item               Value     Threshold  Converged?
 Maximum Force            0.000220     0.000450     YES
 RMS     Force            0.000106     0.000300     YES
 Maximum Displacement     0.000709     0.001800     YES
 RMS     Displacement     0.000447     0.001200     YES
 Predicted change in Energy=-1.672479D-07
 Optimization completed.
    -- Stationary point found.
|
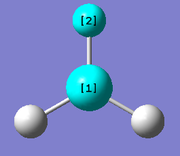
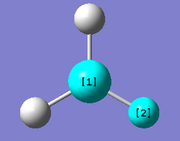
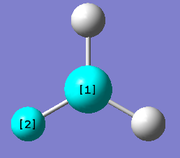
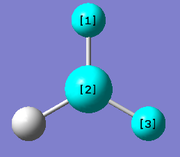
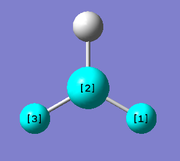
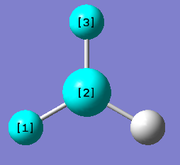
The point group of the optimised molecule is has Cs symmetry. However, up to 3 dp, the bonds have a D3h symmetry point group, whereas the bond angles show a greater difference as shown in table 1.
| Bond lengths / Å | ||
|---|---|---|
| 1.19467 | 1.19480 | 1.19445 |
 |
 |
|
| Bond angles / ° | ||
| 120.016 | 119.986 | 119.998 |
 |
 |
|
Using 6-21G (d,p) Basis set
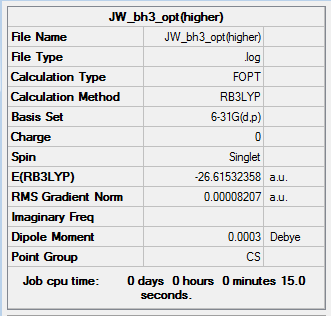
The basis set used in this optimisation is a very simple basis set and thus the results from the calculation shows larger deviations from observed values when compared to a more complex complex basis set. A more complex basis set is 6-31G(d,p) and this was used to further optimise the structure of BH3. This results are shown below.
 |
         Item               Value     Threshold  Converged?
 Maximum Force            0.000204     0.000450     YES
 RMS     Force            0.000099     0.000300     YES
 Maximum Displacement     0.000875     0.001800     YES
 RMS     Displacement     0.000418     0.001200     YES
 Predicted change in Energy=-1.452205D-07
 Optimization completed.
    -- Stationary point found.
|
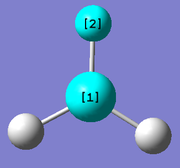
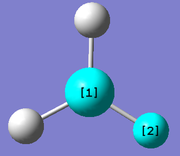
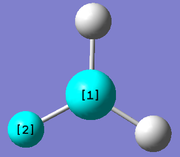
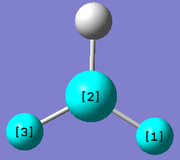
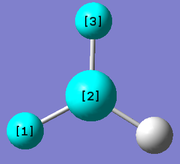
The optimisation can be confirmed to have worked by the low gradient value of 0.00008207 a.u. and the convergence of the collections of forces and displacements. The B-H bond distances and H-B-H bond angles of this more detailed optimisation are tabualted in table 2.
| Bond lengths / Å | ||
|---|---|---|
| 1.19264 | 1.19276 | 1.19243 |
 |
 |
|
| Bond angles / ° | ||
| 120.015 | 119.987 | 119.999 |
 |
 |
|
The average optimised B-H bond length is 1.19Å which conincides with that reported in the literature.[1]
Comparing 3-21G and 6-21G (d,p) basis sets
Table 3 shows the comparison between the B-H bond lengths and the H-B-H bond angles of the the two optimisations using two different basis sets. Using the 3-21G basis set yields slightly longer bond lengths than using 6-31G(d,p) whereas the bond angles are very similar in both cases. The average difference in the bond lengths and bond angles using the 6-31G(d,p) basis set calculation are lower. This shows that the 6-31G(d,p)basis set gives optimised values that are closer to D3h symmetry, which is characterised by equal bond lengths and equal 120° bond angles.
| Bond lengths / Å | Average bond length difference / Å | Bond angle / ° | Average bond angle difference / ° | |
|---|---|---|---|---|
| 3-21G | ||||
| 1.19467 | 0.000233 | 120.016 | 0.0200 | |
| 1.19480 | 119.986 | |||
| 1.19445 | 119.998 | |||
| 6-31G(d,p) | ||||
| 1.19263 | 0.000220 | 120.015 | 0.0187 | |
| 1.19276 | 119.987 | |||
| 1.19243 | 119.999 |
Reporting total energies of optimisations
The final total energies of the BH3 molecule are relatively similar, although the total energy of the 6-31G(d,p) optimised structure is slightly lower in energy.

| Table 4. Total energies of the optimised structures | |||||
|---|---|---|---|---|---|
| Basis set | Total energy / au | ||||
| 3-21G | -26.46226429 | ||||
| 6-31G(d,p) | -26.61532358 | ||||
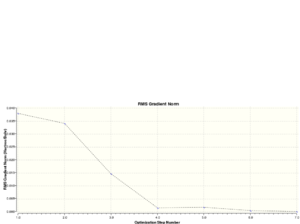
The total energies of each of the optimisations are calculated by the program which measures the total potential energy of the molecule as a function of the collective coordinates, R, of the 3 H nuclei relative to each other and the B atom. Different position of the nuclei give rise to different total energies as a result of the collection of interactions that exist including nuclear-nuclear repulsion, nuclear-electron attraction and electron-electron repulsion.
The total energy curve starts at the highest total energy at optimisation step 1 and decreases gradually until the total energy approximately converges to a constant value. This value is -26.61532358 au when the 6-31G (d,p) basis set is used. The gradual decrease of the total energy corresponds to the increase in the collective co-ordinates R. When the equilibrium R value is reached, the energy is the lowest, and very small displacements of the nuclei doesn't change the total energy, thus the gradient of the graph converges to 0. This point corrsponds to the minimum on the potential energy surface.
Using pseudo potentials and larger basis sets
Creating and optimising GaBr3 using basis set LanL2DZ
A molecule of GaBr3 was created and the molecule was constrained to a D3h point group. This setting was made strict by setting the tolerance of the a change from the symmetry to "very tight (0.0001)".
The optimisation was then done on the following settings:
method: B3LYP basis set: LanL2DZ calculation type: OPT
The basis set uses a medium basis set on first row atoms and pesudo potentials on heavier atoms. Pseudo potentials considers only the valence electrons of heavier elements when computing the energy optimisation and the inner shell electrons are treated as an effective potential, which is represented as a single function. The calculation was ran on the HPC and the results are shown below.
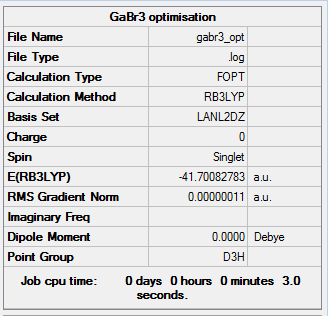 |
             Item               Value     Threshold  Converged?
 Maximum Force            0.000000     0.000450     YES
 RMS     Force            0.000000     0.000300     YES
 Maximum Displacement     0.000003     0.001800     YES
 RMS     Displacement     0.000002     0.001200     YES
 Predicted change in Energy=-1.282698D-12
 Optimization completed.
    -- Stationary point found.
|
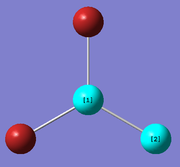
| Bond lengths / Å | ||
|---|---|---|
| 2.35018 | 2.35018 | 2.35018 |
 |
 |
|
| Bond angles / ° | ||
| 120.000 | 120.000 | 120.000 |
 |
 |
|
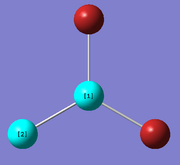
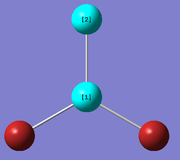
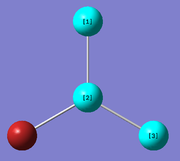
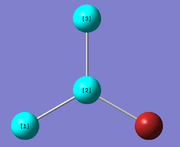
All the bond lengths and bond angles are rendered equal due to the D3h point group restriction set to the optimisation. The Ga-Br calculated bond distance of 2.35018 Å show good comparison with that reported in the literature of 2.3525 Å [1]. The 120° bond angle of the molecule is characteristic a molecule with D3h symmetry.
Creating and optimising BBr3 using mixed basis sets
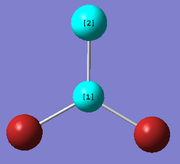
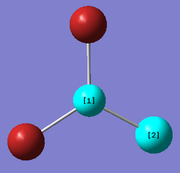
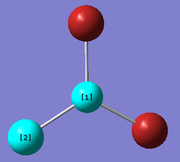
A molecule of BBr3 was created from the optimised structure of BH3 and was optimised using the following commands:
method: B3LYP basis set: 6-31G (d,p) calculation type: OPT keywords: "pseudo=read gfinput"
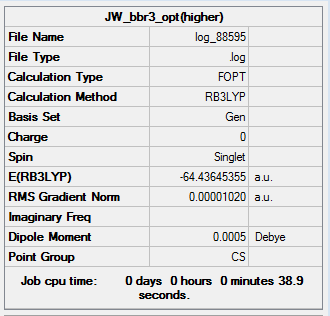
The basis sets and pseudo potential used in the optimisation was set so that a full basis set was used on the B atom whereas, pseudo potentials were used on the Br atoms. The optimisation can again be seen to have been successful because the resulting gradient value is low and the forces and displacements had converged.
 |
        Item               Value     Threshold  Converged?
 Maximum Force            0.000017     0.000450     YES
 RMS     Force            0.000010     0.000300     YES
 Maximum Displacement     0.000072     0.001800     YES
 RMS     Displacement     0.000043     0.001200     YES
 Predicted change in Energy=-1.759239D-09
 Optimization completed.
    -- Stationary point found.
|
| Bond lengths / Å | ||
|---|---|---|
| 1.93392 | 1.93398 | 1.93400 |
 |
 |
|
| Bond angles / ° | ||
| 120.002 | 119.997 | 120.001 |
 |
 |
|
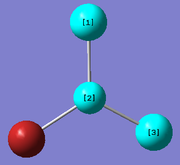
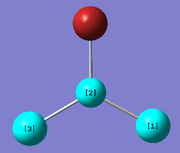
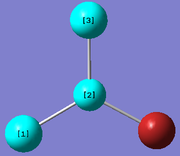
The optimised B-Br distance is 1.93 Å (to 2 dp) [lit. [1] 1.893Å]. The Br-B-Br bond angle is 120 ° (to 3sf) . This is expected for a molecule of D3h symmetry. From these computated results, it can be concluded that although the optimised molecule has a Cs point group, up to the 2dp for the bond length and 3 sf got the bond angle, the molecule strongly resembles D3h symmetry.
Comparing BH3, BBr3 and GaBr3
| Table 6. Bond length of optimised structures | |||||
|---|---|---|---|---|---|
| Bond | B-H | B-Br | Ga-Br | ||
| Bond length / Å | 1.19 | 1.93 | 2.35 | ||
All the molecules traditionally have a trigonal planar structure with a D3h point group. This corresponds to 3 2c-2e covalent bonds and an ideal bond angle of 120°. It can be seen from the table that the B-H bond length is much shorter than the B-Br bond length. In both cases, H and Br accepts 1 electron to form a covalent bond and complete its valence octet shell, since they have electronic configurations of 1s1 and [Ar]3d104s24p5 respectively. The large discrepency in the bond length can be attributed to the fact that for H, its valence orbital is the 1s orbital, whereas for Br it is the 4p orbital. Since the 4p orbital is much further from the nucleus it is must more diffused than the H 1s orbital, resulting in much poorer overlap between the B 2p orbital and hence a longer and weaker bond.
In addition, B-Br has a much larger eletronegativity difference than B-H. The consequence of this is that, the energy mismatch of their bonding AOs is large which results in a smaller stabilisation energy in the MO diagram. Thus bonding orbitals occupy higher energy MOs resulting in a higher energy molecule as the electrons are held less tightly to the nucleus. In both cases, the effective dipole moments is ~0 as the three individual dipole moments cancel out as a consequence of the symmetry of the D3h point group.
When comparing the Ga-Br bond length to the B-Br bond length, since both the central atoms are Group 13 elements, the difference is due to the difference in atomic size and electronegativity of the atom. The bond length on Ga-Br is larger than B-Br which is expected since Ga is much larger than B as it has a principle quantum number of 4 compared to 2 of Boron. Similar to the argument presented for the B-H and B-Br bond length, Ga-Br has a longer and weaker bond than B-Br because its valence bonding orbital is larger and more diffused than that of B. This is illustrated in the radial distribution function of the Ga 4p which would have electron density much further from the nucleus. Both Ga and B are similar in that they partake in bonding my using their np1 valence electron. Furthermore, since Ga is more electronegative than B, the Ga-Br bond has a larger dipole moment than B-Br. However, as before, they overall dipole moment is ~0 in both molecules.
Bonding in Gaussview
A problem encountered during the use of Gaussview to compute and evaluate molecules is that bonds only appear when the distance between 2 atoms are within a certain pre-defined value. Outside of this value, a bond represented by a straight line is not present. Although a straight line may be present within certain threshold values, this does not mean that a bond is present, but at the same time it doesn't necessarily mean that a bond is not present. Although a covalent bond may not be present, there is likely to be other forms of interactions (such as attractive when they atoms are close to the sum of their VdW radii). Therefore, this is a shortcoming of the program in the evaluation of molecules.
It is fair to conclude, that when Gaussview does insert a bond within a certain threshold distance between 2 atoms, in reality there will either be a covalent bond present (as is the case for the B-H bond at 1.19 Å) or there will be some form of interaction. This distance is likely to be close to the sum of the VdW radii of the 2 atoms. In some instances, a bond may be defined the the build up of electron density between 2 atoms, however, this argument seemingly falls apart when used to describe metallic or ionic bonding. In metallic bonding, bonding is by the interactions between the lattice of cations and the delocalised sea of electrons. Whereas, in ionic bonding, the bonding may be defined as coloumbic interaction between the cations and anions. In light of this, a bond may therefore, be more suitably described by a specific energy of interaction between 2 atoms. The energy interaction between 2 atoms represents the balance of the forces that brings and keeps two atoms together to maintain the bonding between them.
Frequency and population analysis
In this part of the assignment, Gaussian was used to study the different vibrational frequencies of the molecules created in previous parts. Using Gaussian frequency analysis was carried out on these molecules and a simulated IR spectrum was retrieved for each molecule.
BH3 frequency analysis
The frequency analysis of BH3 was run using the following commands:
method: B3LYP basis set: 6-31G(d,p) calculation type: FREQ
The results from this calculation low frequency values of which were greater then ±15 cm-1. This is shown below.
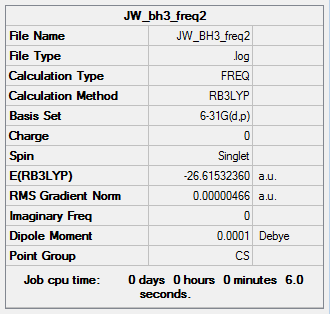 |
    Low frequencies ---  -18.0354  -14.7616   -4.6474   -0.0002   -0.0002    0.0004
    Low frequencies --- 1162.9341 1213.1011 1213.1833
|
This problem was rectified in the following step by restricting the molecule to a point group of D3h and setting this command to very strict. Furthermore, several keywords were used to tighten the convergence criteria for the optimisation of the molecule. The final command used is as follows:
method: B3LYP basis set: 6-31G(d,p) calculation type: FREQ keywords: opt=tight scf=conver=9 int=ultrafine
The results of this analysis is shown below. The low frequencies are as required, within ±15 cm-1 and the real frequencies are all positive and within 1 cm-1 of the expected values.
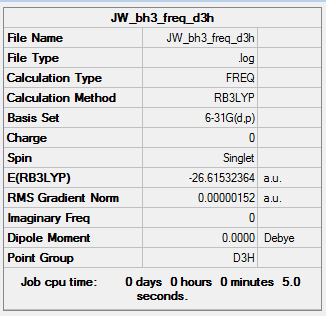 |
Low frequencies --- -7.2365 -7.2032 -0.0286 -0.0008 0.6930 6.4570 Low frequencies --- 1163.0016 1213.1572 1213.1574 |
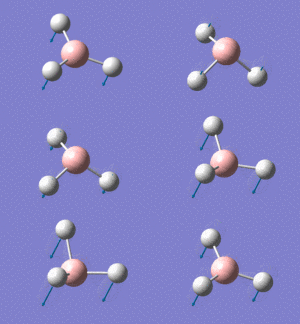
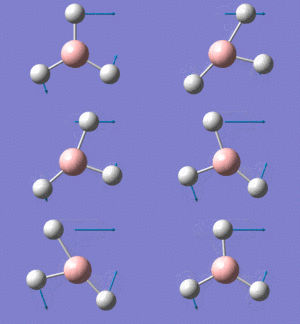
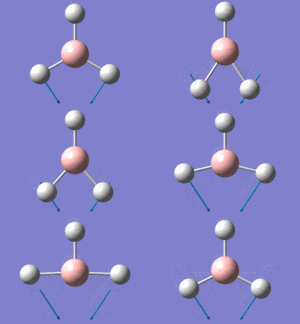
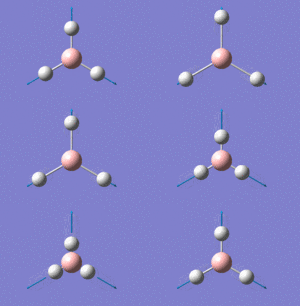
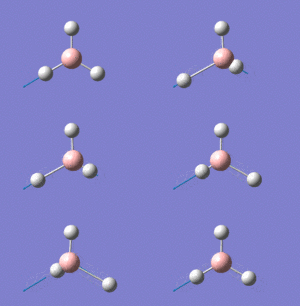
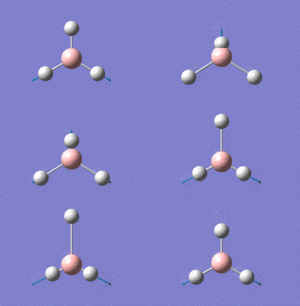
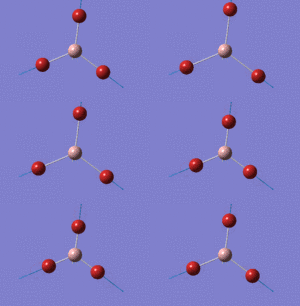
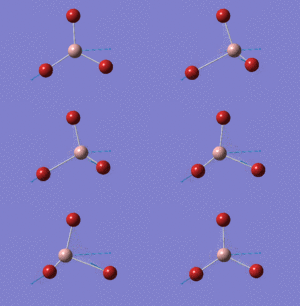
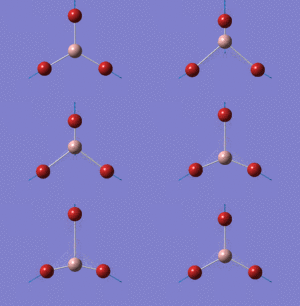
Following the frequency analysis, the different vibrational modes yielded from the analysis are shown in Table 7.
The results of the frequency analysis shows that the molecule has 6 vibrational modes. These are illustrated in the table above. This is in agreement with the expected results based on the theory that for non-linear molecules such as BH3, the molecule has 3N-6 vibrational modes, where N is the number of atoms of the molecule. The IR spectrum corresponding to this set of vibrations are shown below. It is clear that there are only 3 peaks present and 2 of these peaks appearing at 1163 and 2716 cm-1 are much more intense than the peak appearing at 1213 cm-1. Vibrations with larger changes in dipole moment give rise to more intense peaks.
There are only 3 peaks in the spectrum because there are 2 sets of doubly degenerate vibrational modes; these have frequencies of 1213 and 2716 cm-1. This reduces the spectrum to 4 peaks. This is further reduced to 3 peaks because the vibration with frequency 2583 cm-1 is IR inactive (i.e. its effective dipole moment is 0 since the individual dipole moments cancel out due to the concerted symmetrical stretch of the molecule) and as a result does not appear.
IR spectrum of the optimised BH3 with D3h symmetry.

GaBr3 frequency analysis
The frequency analysis of GaBr3 was carried out using the identical commands as for BH3.
method: B3LYP basis set: 6-31G(d,p) calculation type: FREQ keywords: opt=tight scf=conver=9 int=ultrafine
The results of this analysis is shown below. The low frequencies are as required, within ±15 cm-1 and the real frequencies are all positive and within 1 cm-1 of the expected values.
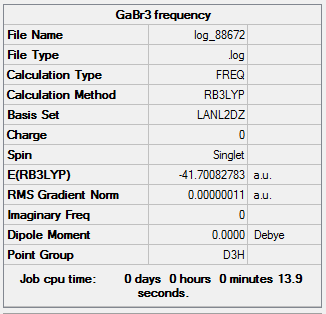 |
Low frequencies --- -0.5252 -0.5247 -0.0024 -0.0010 0.0235 1.2010 Low frequencies --- 76.3744 76.3753 99.6982 |
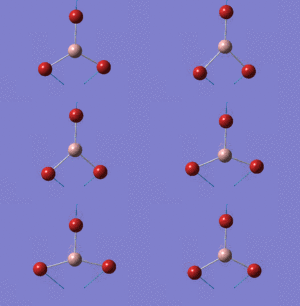
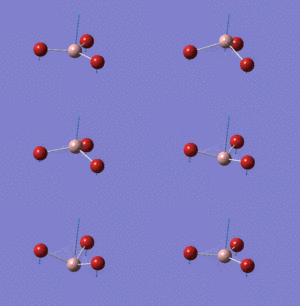
Following the frequency analysis, the different vibrational modes yielded from the analysis are shown in Table 7.
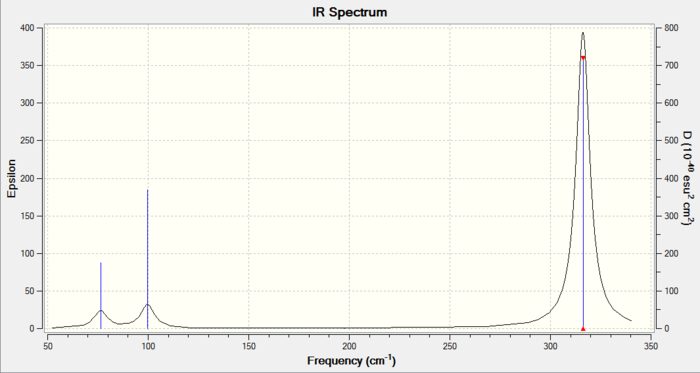
As with the BH3 example given above, GaBr3 contains 6 vibrational modes, 1 of which is IR inactive (Vibration 4) and there exists 2 sets of doubly degenerate modes (Vibration 1 & 2 and 5 & 6). This is again reflected in the IR spectrum.
IR spectrum of the optimised GaBr3 with D3h symmetry.
Comparing the frequencies of BH3 and GaBr3
Comparing the vibrational modes of the 2 different molecules, it can seen that both molecules reports 3 peaks in their spectra. This is a result of the D3h symmetry point group of both molecules. Another similarity to be seen is that for both molecules, 2 vibrational modes: A2" and E' both appear in the low frequency region and another E' and the IR inactive A1' mode appears in the high frequency region. The signals in the low energy region correspond to bending modes, whereas stretching modes appear in the high energy region. This indicates that stretching modes are of higher energy than bending.
The first difference to be seen between the two different molecules is that the frequency of vibration of the vibrational modes vary significantly. The vibrational frequency is given mathematically by the equation:

It can be deduced from the equation that as reduced mass decreases, the frequency increases. Therefore since BH3 is a much lighter molecule than GaBr3, its reduced mass value will be correspondingly lower resulting in a lower vibrational frequency value.
Furthermore, from analysis of the 2 spectra, it can be seen that there has been a reordering of the vibrational modes. In the BH3 spectrum, the peak at the lowest frequency (first peak from left to right) corresponds to the umbrella motion vibration. In contrast, the corresponding umbrella motion vibrational mode appears as the second peak along the spectrum of GaBr3. This signifies a vibrational mode reordering. Furthermore, in the GaBr3, the peak at the lowest frequency appears at 76 cm-1 is due the doubly degenerate mode which has scissoring/rocking motion and scissoring motion.
Population (MO) analysis of BH3
The population analysis of BH3 was computed and evaluated using Gaussview.

| File type | .log |
|---|---|
| Calculation type | SP |
| Calcualtion Method | RB3LYP |
| Basis Set | 6-31G(d,p) |
| Charge | 0 |
| Spin | singlet |
| Total energy | -26.61532361 |
| Dipole Moment | 0.0001 |
| Point Group | D3h |
| Calculation time | 2.0 secs |
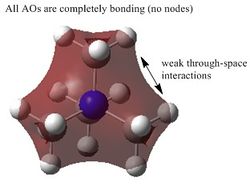
It can be seen from the MO diagram above that the MOs derived qualitatively from the MO diagram are very similar to that derived from computational method using the HPC. Furthermore, the MOs derived from the MO diagram are formed by the combination of the fragment atomic orbitals. On the other hand, the MOs dervied from computed methods are the spacial combinations of the constituent AOs.
NH3 optimisation and frequency analysis
The optimisation of NH3 was carried out on a NH3 molcule with C1 symmetry and using the following commands which includes the a tight convergence criteria:
method: B3LYP basis set: 6-31G(d,p) calculation type: OPT keywords: opt=tight scf=conver=9 int=ultrafine
The result of the optimisation can be seen to have been completed as the summary shows a low gradient value and the set of forces and displacements converged. This is illustrated below.
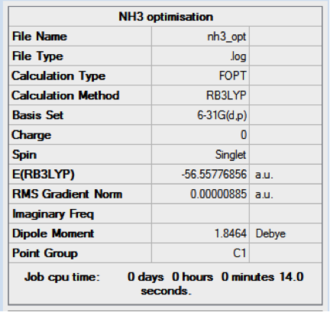 |
Item Value Threshold Converged? Maximum Force 0.000024 0.000450 YES RMS Force 0.000012 0.000300 YES Maximum Displacement 0.000079 0.001800 YES RMS Displacement 0.000053 0.001200 YES Predicted change in Energy=-1.629715D-09 Optimization completed. -- Stationary point found. |
Furthermore, the results of the NH3 frequency analysis is shown below. The analysis was done on a NH3 molecule with C3v symmetry point group. The low frequencies are within ±15 cm-1 and the real frequencies are all positive as required.
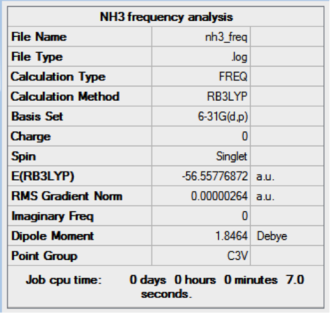 |
Low frequencies --- -10.7400 -8.7584 -7.6961 -0.0002 0.0003 0.0007 Low frequencies --- 1089.2623 1693.9134 1693.9171 |
NH3 population analysis
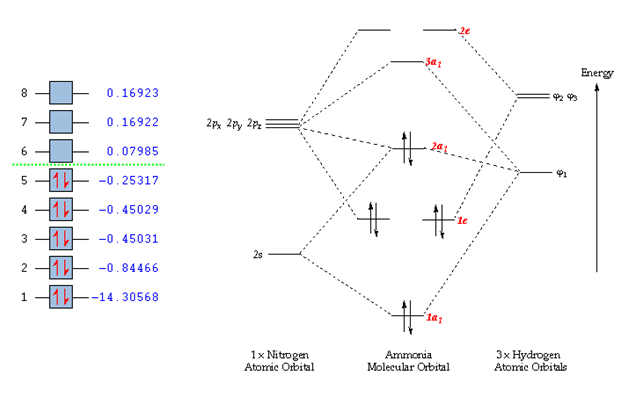
The result of the population analysis is shown below.
| File type | .log |
|---|---|
| Calculation type | SP |
| Calcualtion Method | RB3LYP |
| Basis Set | 6-31G(d,p) |
| Charge | 0 |
| Spin | singlet |
| Total energy | -56.55776856 |
| Dipole Moment | 1.8464 |
| Point Group | C3v |
| Calculation time | 3.0 secs |
The results of the population analysis shows good agreement with that in the theory. The computed results shows the MOs formed from the combination of atomic orbitals. The MO energy labelled 1 taken from literature[2] corresponds to the MO formed from the combination of the N 1s AO and a H 1s AO. The energy can be seen to be much lower than the other MO energies. As a result the MO is not shown in the MO diagram taken from literature. Furthermore, the MOs shown in the diagram are those calculated 2-8, where 5 is the HOMO and 6 is the LUMO.
Natural bond analysis
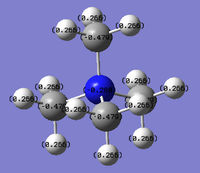
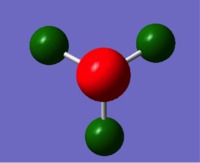
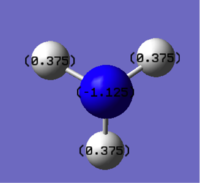
Natural bond analysis can be used with population analysis and it provides more detailed information about the constituent atomic orbitals rather than the molecular orbitals. The charge calculated to be on the N atom of the NH3 molecule is -1.125. This is shown in the figure 2. Furthermore, the fact that this charge is negative ( as expected since N is more electronegative than H) is represented by the red colour in figure 1. The charge of the H atoms are +0.375, which is represented by the colour Green. The difference in electronegativity of the N-H bond is gives rise to an overall dipole moment of 1.85 Debye. The individual dipole moments do not cancel out as in the D3h molecules previously studied, since the N atom also has a lone pair which contributes a dipole moment. The net dipole moment is in the direction of this lone pair
 |
 |
NH3BH3 optimisation and frequency analysis
NH3BH3 was optimised using the same commands as BH3 and NH3 so a meaningful comparison can be made between the reactants and the products.
The commands and results of the optimisation are as follows:
method: B3LYP basis set: 6-31G(d,p) calculation type: FREQ keywords: opt=tight scf=conver=9 int=ultrafine
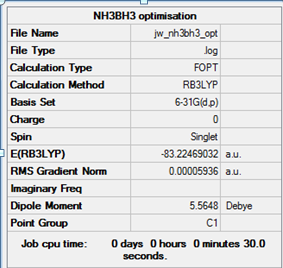 |
Item Value Threshold Converged? Maximum Force 0.000121 0.000450 YES RMS Force 0.000057 0.000300 YES Maximum Displacement 0.000508 0.001800 YES RMS Displacement 0.000294 0.001200 YES Predicted change in Energy=-1.612063D-07 Optimization completed. -- Stationary point found. |
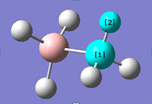
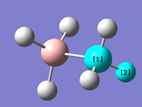
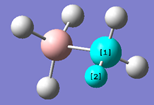
| Bond lengths / Å | |||||
|---|---|---|---|---|---|
| 1.01860 | 1.01859 | 1.01860 | 1.21004 | 1.21002 | 1.21005 |
 |
 |
 |
 |
 |
|
| Bond angles / ° | |||||
| 107.873 | 107.873 | 107.869 | 113.880 | 113.880 | 113.873 |
 |
 |
 |
 |
 |
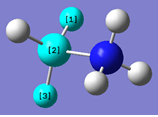
|
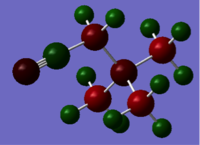
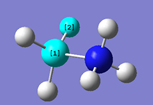
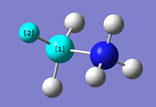
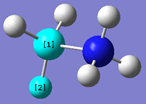
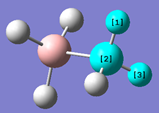
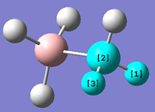
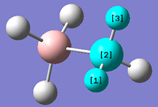
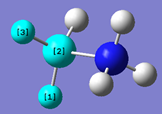
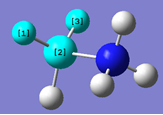
Table 8 shows that the bond angles and bond lengths of in the optimised structure of NH3BH3 . The B atom is represented by the red atom and N by the blue atom. The N-H bond lengths are on average 1.21 Å and the B-H bond lengths are 1.02Å. N-H bond is longer than B-H because N is much larger than B and therefore the valence orbital used in N-H is larger and more diffused, leading to less-good overlap of the orbitals.
The frequency analysis results are as follows:
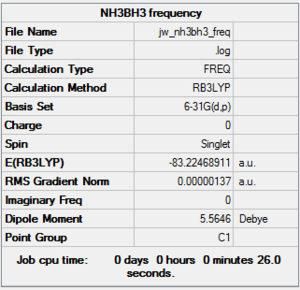 |
Low frequencies --- -3.6784 -3.0945 -0.0008 0.0009 0.0010 3.4461 Low frequencies --- 263.3379 632.9598 638.4306 |
The low frequencies are within ±15 cm-1 and the real frequencies are all positive as required.
Association energy of NH3BH3
| Table 9. Total energies of NH3 , BH3 and NH3BH3 | |||||
|---|---|---|---|---|---|
| Molecule | BH3 | NH3 | NH3BH3 | ||
| Energy / Hartrees | -26.61532358 | -56.55776856 | -83.22469032 | ||
The energies stated in table 9 above, are retrieved from the optimisation computations using Gaussview, and all of them were ran using the same commands (including basis set and tight convergence criteria), thus it is possible to compare the energies.
The association reaction to form NH3BH3 is:

The negative association energy indicates that the reaction is exothermic, thus it is an enthalpically favourable reaction. On the other hand, since the reaction involves two gaseous molecules combining to form 1 molecule of a solid molecule, the reacton is entropically unfavourable. According to Gibbs energy of reaction dG = H-TS, the reaction is spontaneous if dG is negative. Therefore, further evaluation can be made by measuring the entropy of the reaction to conclude whether is spontaneous.
Furthermore, the association energy of the reaction can be described as the bond energy released when the bond is cleaved. An energy of magnitude ~135 kJ/mol is typically a low energy and thus the bond is weak. This may be attributed to the fact that the bond is formally a dative bond, where the electron pair is donated from the N atom. Contradicting this argument is the fact the N is more electronegative than B so it prefers to hold on to its electrons rather than donating them. This weakens the possible N-B bond formation.
Ionic Liquids project - Week 2
Introduction
Ionic Liquids are an interesting area of study because they remain in liquid state at relatively low temperatures. Ionic liquids are largely made of ions and short-lived ion pairs, whereas orindary liquids such as water are formed from electrically neutral molecules. Ionic liquids offer important industrial applications such as in the chemical industry where it is used in BASIL (Biphasic Acid Scavenging utilizing Ionic Liquids) process by BASF. Furthermore, they are also finding increasing applications in the pharmaceuticals industry in the combination of two drugs.
In this assignment, we will investigate the possible candidates as the cation component in ionic liquids. Using computational techniques, three different onium cations: [N(CH3)4]+, [P(CH3)4]+ and [S(CH3)3]+. These will be investigated by optimisation, frequency analysis, MO and NBO analysis, where the results will be compared and contrasted. We will also look at the affects of additonal functional groups to the tetramethyl ammonium cation using the same method and techniques.
[N(CH3)4]+
Optimisation
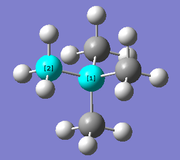
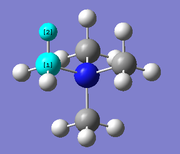
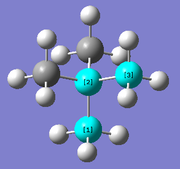
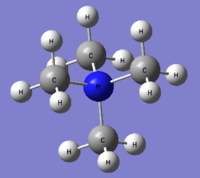
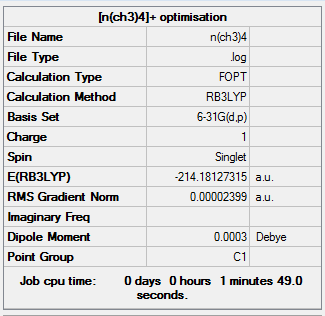
The optimisation of [N(CH3)4]+ was completed using the following commands:
method: B3LYP basis set: 6-31G(d,p) calculation type: FREQ keywords: opt=tight scf=conver=9 int=ultrafine
The optimisation was successful as the reported gradient of the optimisation is low and the set of forces and gradients converged.
| Bond lengths / Å | Bond angle / ° | |
|---|---|---|
| N-C bond | C-H bond | C-N-C angle |
| 1.51 | 1.09 | 109.5 |
 |
 |
|
 |
         Item               Value     Threshold  Converged?
 Maximum Force            0.000062     0.000450     YES
 RMS     Force            0.000018     0.000300     YES
 Maximum Displacement     0.001144     0.001800     YES
 RMS     Displacement     0.000302     0.001200     YES
 Predicted change in Energy=-8.100193D-08
 Optimization completed.
    -- Stationary point found.
|
The optimised N-C bond length of 1.51 Å [lit.[3] 1.49 Å]is longer than the C-H bond length due to the larger atoms in bonding in the N-C case. N is a much larger atom than H where its valence electrons occupy the 2p orbital whereas in H the valence electron is in the 1s orbital. The more diffused N 2p orbital leads the a weaker longer bond. Therefore, the increase in principle quantum number of N results in a longer bond. Furthermore, the larger electronegativity difference between C-H than C-N also leads to a shorter bond. The bond angle is 109.5° indicative of a tetrahedral geometry around the N atom. In this geometry, the steric clash between the CH3 groups are minimised. This is especially crucial in the molecule since N is a small atom, therefore, the CH3 has close proximity in the molecule.
Frequency Analysis
Low frequencies ---  -10.3150   -0.0006   -0.0006    0.0005    2.8838    7.7276
Low frequencies ---  182.2468  287.6952  287.7465
 |
        Item               Value     Threshold  Converged?
Maximum Force            0.000066     0.000450     YES
RMS     Force            0.000023     0.000300     YES
Maximum Displacement     0.002190     0.001800     NO
RMS     Displacement     0.000999     0.001200     YES
Predicted change in Energy=-1.552335D-07
Optimization completed.
    -- Stationary point found.
|
The low frequencies are as required, within ±15 cm-1 and the real frequencies are all positive representing an energy minimum.
[P(CH3)4]+
Optimisation
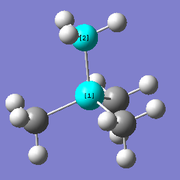
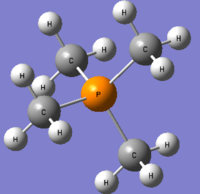
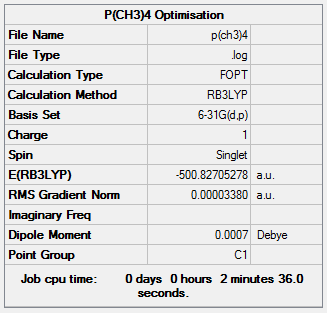
The optimisation of [P(CH3)4]+ was completed using the following commands:
method: B3LYP basis set: 6-31G(d,p) calculation type: FREQ keywords: opt=tight scf=conver=9 int=ultrafine
The optimisation was successful as the reported gradient of the optimisation is low and the set of forces and gradients converged.
| Bond lengths / Å | Bond angle / ° | |
|---|---|---|
| P-C bond | C-H bond | C-P-C angle |
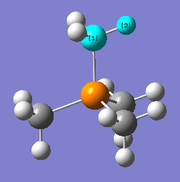
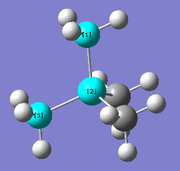
| 1.82 [lit.[4] 1.85 Å] | 1.09 | 109.3 |
 |
 |
|
 |
       Item               Value     Threshold  Converged?
Maximum Force            0.000100     0.000450     YES
RMS     Force            0.000035     0.000300     YES
Maximum Displacement     0.001544     0.001800     YES
RMS     Displacement     0.000317     0.001200     YES
Predicted change in Energy=-1.999137D-07
Optimization completed.
-- Stationary point found.
|
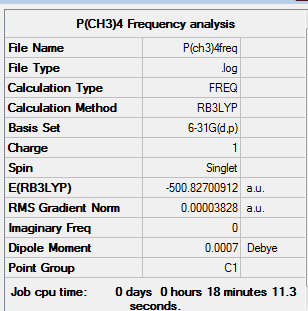
Frequency Analysis
Low frequencies ---  -13.2766   -0.0019   -0.0018    0.0016    5.7363    8.7381
Low frequencies ---  155.0535  190.7630  190.9705
 |
        Item               Value     Threshold  Converged?
Maximum Force            0.000099     0.000450     YES
RMS     Force            0.000038     0.000300     YES
Maximum Displacement     0.003220     0.001800     NO
RMS     Displacement     0.001097     0.001200     YES
Predicted change in Energy=-2.310909D-07
Optimization completed.
-- Stationary point found.
|
This low frequencies in this instance is relatively high at -13.2766. This occurs because the basis set used is not quite good enough and there are some very soft vibrational modes. However, it is still within the accepted range of ± 15 cm-1. The real frequencies are also all positive thus representing an energy minima was computed.
[S(CH3)3]+
Optimisation
The optimisation of [S(CH3)3]+ was completed using the following commands:
method: B3LYP basis set: 6-31G(d,p) calculation type: FREQ keywords: opt=tight scf=conver=9 int=ultrafine
The optimisation was successful as the reported gradient of the optimisation is low and the set of forces and gradients converged.
| Bond lengths / Å | Bond angle / ° | |
|---|---|---|
| S-C bond | C-H bond | C-S-C angle |
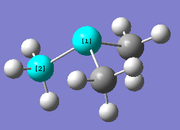
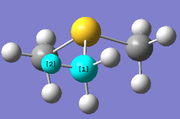
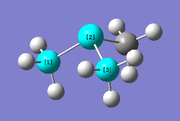
| 1.82 [lit.[5] 1.82 Å] | 1.09 | 102.7 |
 |
 |
|

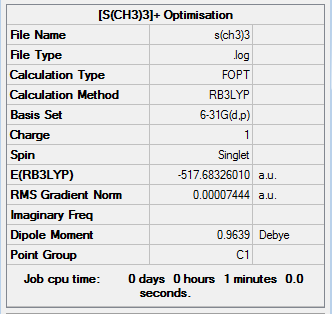 |
        Item               Value     Threshold  Converged?
Maximum Force            0.000218     0.000450     YES
RMS     Force            0.000055     0.000300     YES
Maximum Displacement     0.001728     0.001800     YES
RMS     Displacement     0.000673     0.001200     YES
Predicted change in Energy=-4.707310D-07
Optimization completed.
-- Stationary point found.
|
Frequency Analysis
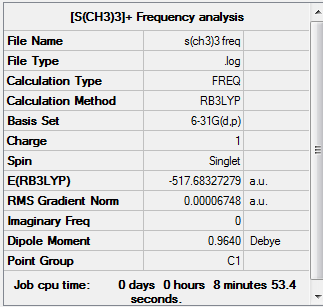
Low frequencies ---  -15.2891   -5.9599   -0.0013   -0.0006    0.0028    7.4578
Low frequencies ---  162.0717  199.8898  200.7311
 |
        Item               Value     Threshold  Converged?
 Maximum Force            0.000191     0.000450     YES
 RMS     Force            0.000067     0.000300     YES
 Maximum Displacement     0.003170     0.001800     NO
 RMS     Displacement     0.001144     0.001200     YES
 Predicted change in Energy=-4.067421D-07
|
One of the low frequencies in the [S(CH3)3]+ frequency analysis is relatively high at -15.2891. This occurs because the basis set used is not sufficient for this computation and some very soft vibrational modes are present. Although, it is still outside the accepted range of ± 15 cm-1, it is negligible. The real frequencies are also all positive thus representing an energy minima was computed.
Comparison of the [N(CH3)4]+ , [P(CH3)4]+ and [S(CH3)3]+
The first thing to note with the trio of cations is that [N(CH3)4]+ and [P(CH3)4]+ both have a tetrahedral geometry around the central atom. This is in accordance with the Valence Shell Electron Pair Repulsion (VSEPR) theory. According to this theory, a tetrahedral geometry corresponds to a bond angle of 109.5°, which is in line with the computed value using Gaussian. When the bonds around the central atom arrange themselves at the angle, the electronic repulsion between the bond electrons is minimised thus the energy of the molecule is lowest.
On the other hand, although [S(CH3)3]+ has the same basis geometry (tetrahedral) as the other 2 cations, it has a real trigonal pyramidal geometry and the C-S-C bonds are computed to be 102.7°. The difference in geometry from the other two cations is due to the lone pair of electrons on the S atom which repels more strongly than the bonding electron pairs. The non-bonding electron pair is held close to the electronegative S nucleus and as a result repels more strongly. This means that the lp-bp repulsion is stronger than the bp-bp repulsion and the consequence of this is the trigonal pyramidal geometry.
Furthermore, the C-S-C bond angle is lower than the expected angle of 107° for trigonal pyramidal geometry. It is expected that the C-S-C angle would be larger than this typical angle ( which is found for NH3) because S is a larger atom so should be able to accomodate the CH3 groups in more space. However, the opposite is observed. A possible explanation for this phenomenon is that since the S atom is larger, it has more diffused ortbials. As a result, it attracts valence electrons less strongly than N which results in enhanced electron density at the CH3 groups. Since lp-bp repulsion is stronger than bp-bp repulsion, the methyl groups are pushed closer together, resulting in a smaller C-S-C angle than expected.
Comparing the C-X bond lengths of the cation trio, it can be seen that the C-N bond is the shorter than C-P and C-S. This is rationalised by the fact that N has a principle quantum number of 2, whereas S and P has a number of 3. This means that the valence orbitals used in bonding by P and S are larger and more diffused, resulting in a weaker orbital overlap and ultimately a weaker and longer bond. The C-N bond is shorter since the N 2p orbital overlaps better with the C 2p orbital, thus forming a stronger and shorter bond.
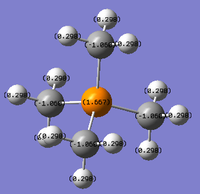
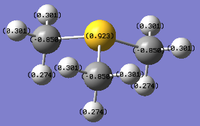
Population analysis
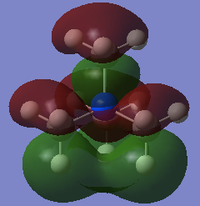
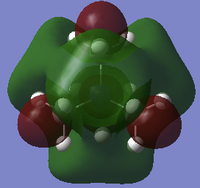
 |
 |
 |
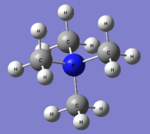
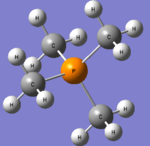
| [N(CH3)4]+ population analysis .log file | Results of [P(CH3)4]+ population analysis .log file | Results of [S(CH3)3]+ population analysis .log file |
| DOI:10042/27848 | DOI:10042/27851 | DOI:10042/27850 |
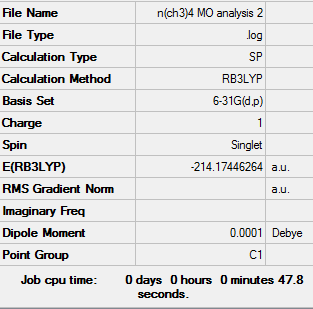
|
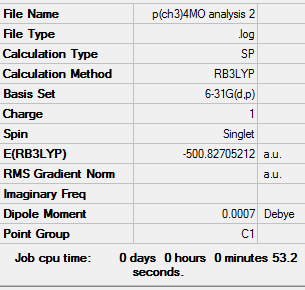
|
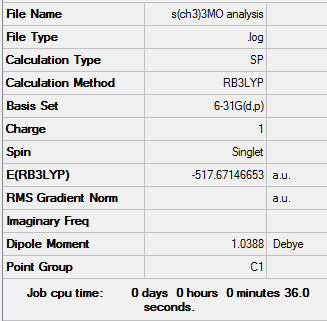
|
Molecular Ortbial analysis
NBO Analysis
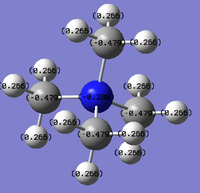
A colour range of -1.800 to +1.800 was used because the maximum charge of the cations is +1.667. Keeping the colour range consistent for all 3 depictions of the cations enables a meaningful comparison of the charges to be made.
Relative contribution
N(CH3)4]+
 1. (1.98193) BD ( 1) N   1 - C   2
( 66.21%)   0.8137* N   1 s( 25.00%)p 3.00( 74.97%)d 0.00(  0.03%)
                0.0000  0.5000 -0.0005  0.0000  0.4914
                0.0001 -0.0958  0.0000 -0.7064 -0.0001
                -0.0018 -0.0136  0.0027  0.0046  0.0085
( 33.79%)   0.5813* C   2 s( 21.61%)p 3.62( 78.23%)d  0.01(  0.16%)
                0.0003  0.4643 -0.0232  0.0035 -0.5015
                -0.0227  0.0978  0.0044  0.7209  0.0326
                -0.0044 -0.0320  0.0062  0.0107  0.0199
For each of the 4 N-C bonds of the molecule, the N orbital contributes 66% to the bond and the C orbital contributes ~34% to the bond. This difference can be explained by the higher eletronegativity of N which has a greater electron affinity, thus greater electron density is found close to its centre. The N orbitals are reported to have a hydridisation of 25% s character and 75% p character, whilst the C orbitals have 22% s character and 78% p character. Qualitatively, these numbers represents sp3 hybridisation of both the N and C atom. In the case of both atoms, there is a negligible amount of d hybridisation.
P(CH3)4]+
4. (1.98030) BD ( 1) C   1 - P  17
( 59.57%)   0.7718* C   1 s( 25.23%)p 2.96( 74.69%)d 0.00(  0.08%)
                0.0002 -0.5020 -0.0171  0.0020  0.4177
                -0.0077  0.7158 -0.0131  0.2444 -0.0045
                -0.0201 -0.0069 -0.0118  0.0114  0.0110
( 40.43%)   0.6359* P  17 s( 25.00%)p 2.97(      74.15%)d    0.03(  0.85%)
                 0.0000 -0.0001 -0.5000  0.0008  0.0000
                 0.0000 -0.4160  0.0006  0.0000 -0.7134
                 0.0010  0.0000 -0.2437  0.0004 -0.0640
                 -0.0219 -0.0375  0.0362  0.0351
The 4 P-C bonds present in the molecule, the P orbital contributes ~40% and the C contributes ~60%. Comparing to the N-C bond case above, the C atom contributes more to the bond because P is less electronegative than N, therefore the electron density is less skewed within the bond. Again, both P and C centres are sp3 hybridised.
S(CH3)3]+
2. (1.98584) BD ( 1) S   1 - C   6
( 51.21%)   0.7156* S   1 s( 21.07%)p 3.71( 78.29%)d 0.03(  0.64%)
                0.0000  0.0001  0.4589 -0.0117  0.0009
                0.0000 -0.3493 -0.0214  0.0000  0.8116
                -0.0418  0.0000 -0.0002  0.0000 -0.0556
                 0.0000  0.0000 -0.0375 -0.0431
( 48.79%)   0.6985* C   6 s( 20.75%)p 3.81( 79.10%)d  0.01(  0.14%)
                 0.0002  0.4555  0.0094 -0.0038  0.2770
                 0.0115 -0.8451  0.0018  0.0003  0.0000
                 -0.0175  0.0000  0.0000 -0.0275 -0.0185
In the case for the S-C bond, the S orbital contributes ~51% to the bond and the C orbital contributes ~49%. The bond therefore has approximately equal contribution from both atoms. This contribution is much more equal than the 2 previous cases, reflecting the lowest electronegativty difference of the S-C bond, compared to the other two scenarios. Furthermore, the S and C centre again are approximately sp3 hybridised, but it can be seen that the p orbital weighting of the hybridisation has increased relative to that of the s orbital. An explanation for this is that descending down a group, the s-p energy gap increases, making hydrbidisation less favourable.
Formal charge of N(CH3)4]+
Tetra-alkyl cations are usually represented with the positive charge located on the Nitrogen atom. However, based on the computations carried out on N(CH3)4]+ , this is proven not to be the case. The 'formal' positive charge on the N atom represents N losing an electron to bond with an extra methyl group to form the ammonium cation in this case and so the positive charge is on N. In reality, the positive charge is delocalised over all the H atoms which is demonstrated by the charge distribution analysis in which the hydrogens hold a positive charge.
Part 2 - Influence of functional groups
[N(CH3)3CH2OH]+
Optimisation
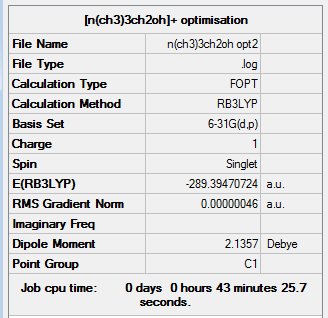
Firstly, a problem encountered during this step was that the low frequencies retrieved from the initial structure drawn was much higher than the generally acceptable value of ±15cm-1</sup?>. This was due to the fact that in Gaussview, the drawn structure had a H-O-C-N dihedral angle of 180°, which resulted in a negative frequency of -122 cm-1. The structure was redrawn to remove this occurance an the results are shown below.
The optimisation of [N(CH3)3CH2OH]+ was completed using the following commands:
method: B3LYP basis set: 6-31G(d,p) calculation type: OPT keywords: opt=tight scf=conver=9 int=ultrafine
The optimisation was successful as the reported gradient of the optimisation is low and the set of forces and gradients converged.
| Bond lengths / Å | Bond angle / ° | ||
|---|---|---|---|
| N-C bond (1) | N-C bond (2) | C-N-C angle (1) | C-N-C angle (2) |
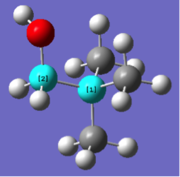
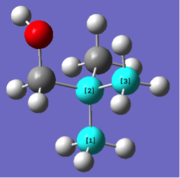
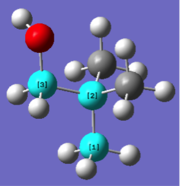
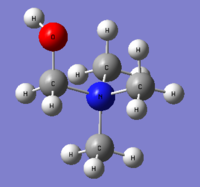
| 1.51 | 1.55 | 110.1 | 108.4 |
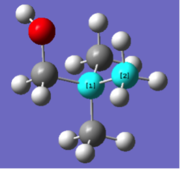 |
 |
 |
|
 |
         Item               Value     Threshold  Converged?
 Maximum Force            0.000001     0.000015     YES
 RMS     Force            0.000000     0.000010     YES
 Maximum Displacement     0.000043     0.000060     YES
 RMS     Displacement     0.000010     0.000040     YES
 Predicted change in Energy=-1.776948D-11
 Optimization completed.
    -- Stationary point found.
|
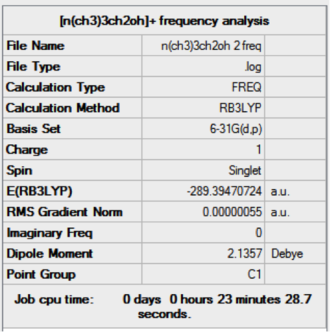
Frequency Analysis
Low frequencies ---   -8.4497   -5.0355   -1.1039    0.0009    0.0009    0.0010
Low frequencies ---  131.1060  213.4677  255.7156
 |
        Item               Value     Threshold  Converged?
Maximum Force            0.000001     0.000450     YES
RMS     Force            0.000001     0.000300     YES
Maximum Displacement     0.000079     0.001800     YES
RMS     Displacement     0.000025     0.001200     YES
Predicted change in Energy=-9.258570D-13
Optimization completed.
-- Stationary point found.
|
[N(CH3)3CH2CN]+
Optimisation
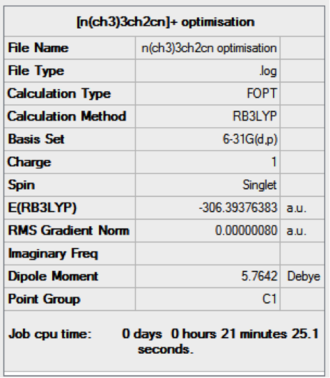
The optimisation of [N(CH3)3CH2CN]+ was completed using the following commands:
method: B3LYP basis set: 6-31G(d,p) calculation type: OPT keywords: opt=tight scf=conver=9 int=ultrafine
The optimisation was successful as the reported gradient of the optimisation is low and the set of forces and gradients converged.
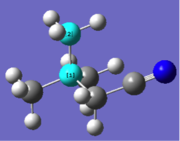
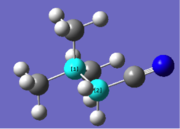
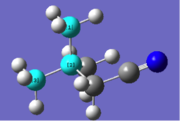
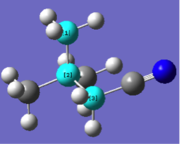
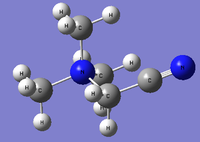
| Bond lengths / Å | Bond angle / ° | ||
|---|---|---|---|
| N-C bond (1) | N-C bond (2) | C-N-C angle (1) | C-N-C angle (2) |
| 1.51 | 1.53 | 109.5 | 110.1 |
 |
 |
 |
|
 |
        Item               Value     Threshold  Converged?
Maximum Force            0.000002     0.000015     YES
RMS     Force            0.000000     0.000010     YES
Maximum Displacement     0.000056     0.000060     YES
RMS     Displacement     0.000018     0.000040     YES
Predicted change in Energy=-1.226268D-10
Optimization completed.
-- Stationary point found.
|
Frequency Analysis
Low frequencies ---   -2.6500   -0.0008   -0.0004    0.0001    7.1487    9.6770
Low frequencies ---   91.7740  154.0302  210.9264
 |
       Item               Value     Threshold  Converged?
Maximum Force            0.000002     0.000450     YES
RMS     Force            0.000001     0.000300     YES
Maximum Displacement     0.000229     0.001800     YES
RMS     Displacement     0.000084     0.001200     YES
Predicted change in Energy=-2.497897D-10
Optimization completed.
-- Stationary point found.
Optimization completed.
-- Stationary point found.
|
Comparison of [N(CH3)3CH2OH]+ and [N(CH3)3CH2CN]+
The first comparison to be made is the for both molecules, addition of the functional group has caused an increase in the N-C length involving the C directly attached to the functional group. This is rationalised in the case of [N(CH3)3CH2CN]+, as the electron withrdawing CN group withdraws electron density from the bond, thus rendering it weaker and longer. In the case of the additional -OH group, the more electronegativity O atom withdraws electron density from the C atom, reducing the the electron density available for bonding with the central N atom, resulting in a longer weaker bond.
In addition to this, the C-N-C angle involving the C atom directly attached to the functional group, decreases in the case of [N(CH3)3CH2OH]+ and increase in [N(CH3)3CH2CN]+. This may be rationalised by the steric repulsion in the -OH case, where the electron rich O atom repels the neighbouring C-H bonds on the top of the molecule (see table 16). Thus, the molecule minimises this repulsive interaction by adopting a smaller angle. Again, in the case of [N(CH3)3CH2CN]+, the angle is larger due to steric repulsion again (see table 17).
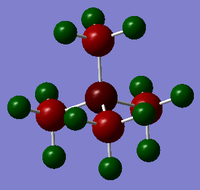
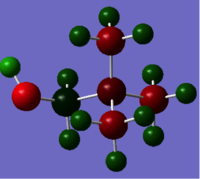
Population Analysis
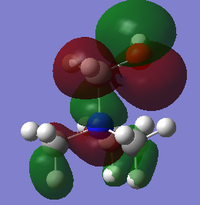
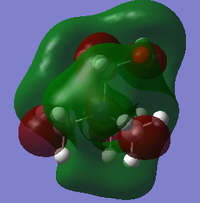
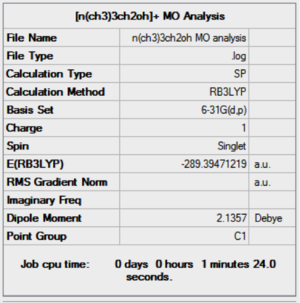
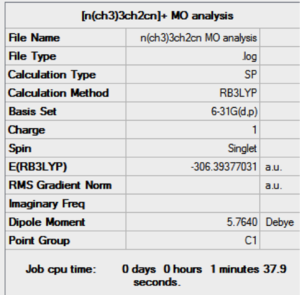
 |
 |
| Results of [N(CH3)3CH2OH]+ population analysis .log file | Results of [N(CH3)3CH2CN]+ population analysis .log file |
|---|---|
| DOI:10042/27957 | DOI:10042/27909 |
|
|
NBO Analysis
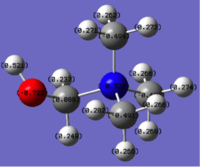
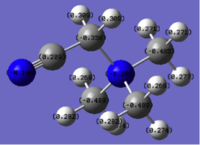
The effects of the addition of the CN electron withdrawing group and OH electron donating group can be seen in the the table above. The presence of the CN EWG results in a lower magnitude of negative charge (-0.358) on the C atom attached to the CN, relative to the unsubstituted equivalent, N(CH3)4]+, which has a charge of (-0.470). This effect is also felt on the N atom, although the amount that the charge decreases by is less due to the N atom being 2 bonds away from the group rather than 1. This is shown quantitatively by a decrease in charge on the N atom from -0.295 to -0.289. Furthermore, the N central atom is also less affected than the C atom because it is more electronegative and therefore can hold on to its electron density more strongly.
Furthermore, the presence of the electron donating group OH results in slightly positive charge of +0.088 on the C atom directly attached to it. This is the case because the electron rich O atom pushes electron density towards the otherwise electron deficient C atom, thus increasing the charge density at the atom. Conversely, the presence of the electron donating OH group results in a higher negative charge on the central N atom because since N is more electronegative than C, it withdraws electron density from the charge enhanced C(-OH) atom.
Comparing HOMO and LUMO of N(CH3)4]+, N(CH3)3CH2OH]+ and N(CH3)3CH2CN]+
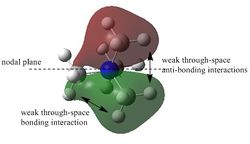
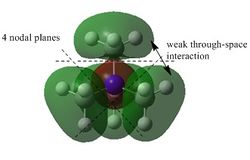
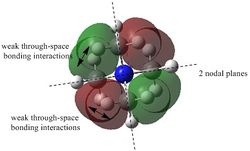
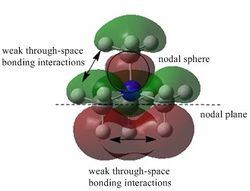
One key observation is that between the HOMO and LUMO of the cations is that the HOMO has many areas of localised electron density whereas the LUMOs are generally very diffused and have delocalised electron density. Furthermore, it can be observed that the introduction of the two substituents -OH and -CN has drastically changed the shapes of the HOMO and LUMO orbitals. For instance, the introduction of the OH substituent has resulted in reduced delocalisation of electron density of the methyl groups in the HOMO of N(CH3)3CH2OH]+, compared to the original N(CH3)4]+ molecule. The LUMO of the unsubstitued N(CH3)4]+ molecule is highly delocalised, and similarly that of N(CH3)3CH2OH]+ is also highly delocalised. However, one major difference is that the presence of the OH EDG has resulted in the loss of symmetry of the original LUMO by enhancing the electron density in the H-O-C-N region.
The most striking observation about the HOMO of the N(CH3)3CH2CN]+ molecule is that there is diminished MO extension towards the methyl groups. In contrast, there are highy delocalised lobes in the CN region of the molecule. This is expected since the CN nitrile group is a highly electron withdrawing group and therefore withdraws electron density away from the rest of the molecule. Again, the is emphasised in the LUMO of the orbital, where the electron density of the Me groups have decreased from the withdrawal towards the CN group.
Next, the energy of the orbitals increased in both cases of the substitued molecule relative to N(CH3)4]+. This is a due to the increased anti-bonding character of the MOs which destabilise the molecule. Moreover, the N(CH3)3CH2CN]+ molecule has a lower energy LUMO than the original unsubstituted molecule. The reason for this is that the initial large antibonding character between the diffused orbital engulfing the main body of the molecule has decreased due to the reduced orbital size caused by the electron withdrawing nitrile group. Since the LUMO is lower energy in N(CH3)3CH2CN]+ , than the other 2 cations, it acts as a better electron acceptor.
A reduced HOMO-LUMO gap is observed when functional groups are added to the original molecule. According to frontier orbital theory, the chemical impact of a compound is dependent on its HOMO-LUMO gap. A small HOMO-LUMO gap generally means that a molecule is kinetically and thermodynamically less stable as the HOMO is high energy therefore is a good donor and the LUMO is low energy and therefore a good acceptor. Since the addition of functional groups lower the HOMO-LUMO group, they are better ionic liquids as they are more likely to react to form ion pairs.
Conclusion
The three different onium cations, namely N(CH3)4]+, P(CH3)4]+ and S(CH3)3]+ were studied using computational techniques in the Gaussview program. These included firstly optimisation the molecule followed the the frequency analysis of the molecule to ensure a minima was found, illustrated by all positive real frequencies. Some of the key findings of this part of the assignment are that although all 3 cations have the same basis tetrahedral symmetry, S(CH3)3]+ has a real geometry of trigonal pyramidal. The reason for this was due to the stonger lp-bp repulsion relative to that of bp-bp. Furthermore, the C-X bond lengths were also considered, and it was discovered that the C-N bond is shorter than that of C-P and C-S. This was rationalised by the the more diffuse orbitals used in bonding by the P and S which are heavier larger atoms, with a high principle quantum number. Furthermore, from the charge distibution analysis, it was also found that what is thought of as a formal charge on the N atom of N(CH3)4]+, is in fact a positive charge which is delocalised over all 12 H atoms of the 4 methyl groups.
Thereafter, additional functional groups CN and OH replaced a H atom on 1 of the 4 methyl groups of the tetramethyl ammonium cation. The resulting change of this alteration is that the N-C bond involving the C attached directly to the functional group, increased in bond length for both cases. In terms of the bond angles, the C-N-C bond angle involving the C attached to the functional group, decreased in the case of -OH and increased for -CN. This was rationalised by steric repulsion. Moreover, the changing shapes and erngies of the MOs were also studied and compared to the original non-subsituted molecule. In summary, this assignment has highlighted the potential of computational studies in researching the potential of novel species to behave as ionic liquids, and the properties that make them able to do so.
References
- ↑ 1.0 1.1 1.2 D.R. Lide, CRC Handbook of Chemistry and Physics, CRC Press, Boca Raton, 87th Ed., 2006.
- ↑ Introduction to Molecular Orbital Theory, http://www.ch.ic.ac.uk/vchemlib/course/mo_theory/main.html, 05/03/2014
- ↑ E. A. Trush, O. V. Shishkin, V. A. Trush, I. S. Konovalovab, T. Y. Silva, Acta Crystallographica, 2012, 68 273
- ↑ V. S. Mastryukov, J. Struct. Chem., 1976, 17, 69-73.
- ↑ L. O. Brockway, H. Jenkins, J. Am. Soc., 1936, 58, 2036-2044.

