Rep:Mod:XZ9215 second
Introduction
Through calculating Molecular Dynamics trajectories, reactivity of an atom and a diatomic molecule collision system could be studied (Figure 1).
The progress of this reaction can be plotted as a function of both r1 and r2 to give the potential energy surface. A trajectory {r1(t) r2(t)} can then be drawn on this potential energy surface which is then used for determine the position of transition state and reactivity of a reaction.
 |
H+H2 system
H+H2 collision
 |
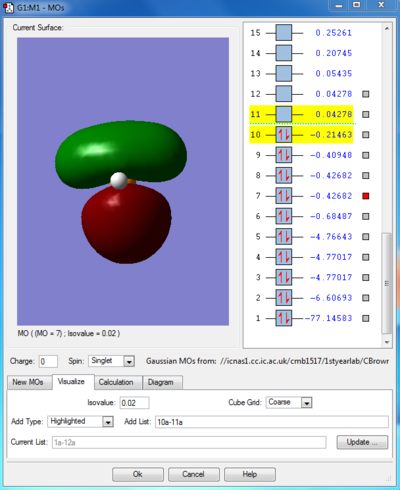 |
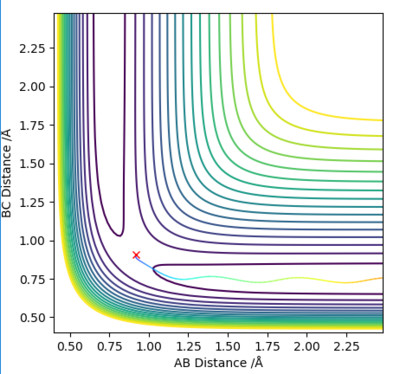
The reaction path is at minimum valley of the potential energy surface. Along this path line, a maximum point can be observed at transition state, while minimum points are observed at the ends which represents the reactant and product state. the gradient of both maximum and minimum point can be calculated through ∂V(ri)/∂ri which is equal to 0. Therefore, the total gradient of both minimum and at a transition structure is 0.(Figure 2.2)
To distinguish between minimum point and transition state, second derivative could be used. Second derivative is non-zero at minimum point(reactant and product)which means the reaction could only go at one direction, while at transition state, second derivative is 0, so the transition state species could go either direction to form product or reactant.
Nf710 (talk) 12:02, 26 May 2017 (BST) - Second deriviative needs to be done in the reaction coordinate by taking the normal modes (un coupled) of the system.
Transition State Region
 |
 |
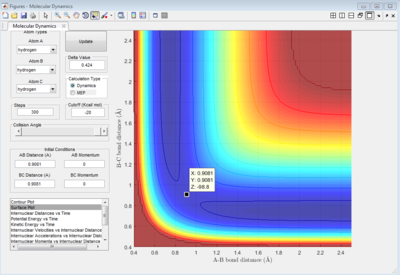
Best estimate of the transition state position (rts) = 0.9081 ang.
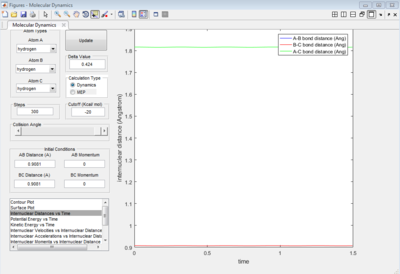
As shown on Figure 4, which is the Internuclear Distances vs Time graph, when the A-B ans B-C bond lengths are both adjusted to 0.9081 ang, two straight line with almost no fluctuation appear, this means at transition state, there is almost no vibration between the atoms which lead to no change in internucear distance. Therefore, when the 3 H atoms reach equilibrium (transition state) where r1=r2, p1=p2=0, there is nearly no kinetic energy among them (atoms stay almost stationary), and the potential energy is thus at maximum.
Trajectories of transition state
 |
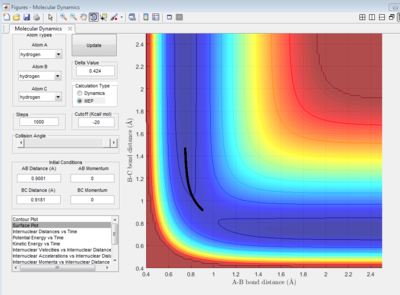 |
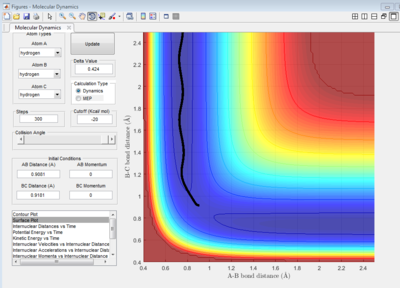
The initial conditions are set such that the system is slightly displaced from the transition state( r1 = rts+0.01, r2 = rts) and the momenta p1 = p2 = 0.
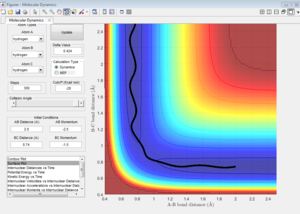
In MEP calculation, only the minimum energy points are takeing into account, the vibration of atoms are ignored, thus, a smooth curve is observed at the valley floor of potential energy surface plot(Figure 6). In Dynamic calculation, the vibration of molecules is considered which gives a wavy line(Figure 5).
Nf710 (talk) 12:05, 26 May 2017 (BST) This ius an inadequate explanation. An MEP starts every step with no momentum. A Dynamics calculation carries through inertia through each step.
Reactive and unreactive trajectories
 |
 |
 |
 |
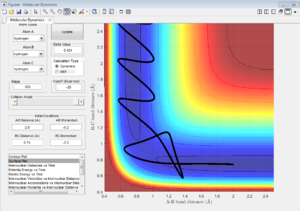 |
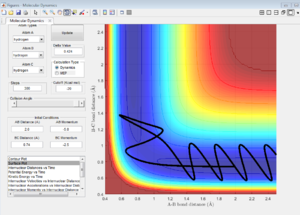
| Figure | p1 | p2 | trajectories | Description |
|---|---|---|---|---|
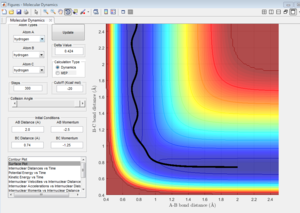
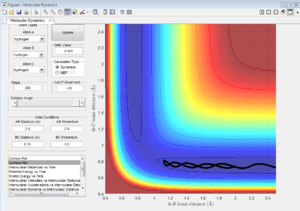
| 7a | -1.25 | -2.5 | Reactive | transition state has been crossed with enough kinetic energy of A-B collision. |
| 7b | -1.5 | -2.0 | unreactive | kinetic energy is lowered, thus not enough to cross the activation barrier. |
| 7c | -1.5 | -2.5 | Reactive | transition state has been crossed with enough kinetic energy of A-B collision. |
| 7d | -2.5 | -5.0 | unreactive | kinetic energy is too high when A approaches B, so A recross activation barrier and bounces back to regenerate the reactant. |
| 7e | -2.5 | -5.2 | Reactive | A approaches B with high kinetic energy, then it bounces back. After collision, A still have enough kinetic energy to approach B but not enough to reverse back again. So this reaction is reactive. |
Transition State Theory
Transition state theory is based on the assumption that transition state species that generated from reactants are in equilibrium with reactants. It assumes that unless atoms vibrate and collide with enough energy to form the transition state complex, otherwise the reaction does not happen. The second assumption is that any system passing through the transition state will not recross it again.
As the experimental data shown (Figure 6d), even though the reaction has enough energy to reach transition state, barrier recrossing happens and it could go back to its reactant.
reaction rate values predicted by transition state theory would be higher than the experimental value due to the fact that recrossing could happen to lower the reaction rate, which could not be fully predicted by transition state theory.
F-H-H system
H2+F system
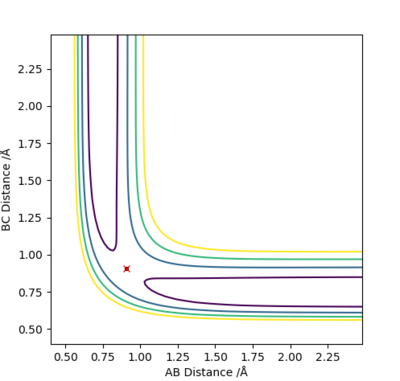
As shown on Figure 8, the potential energy decreases as the reaction goes which indicate the reaction is exothermic. Energy is released when H-F bond is forming and energy is need to break H-H bond, the total reaction is exothermic, thus H-F bond is stronger than H-H.
 |
 |
According to the Hammond postulate, in an exothermic reaction the transition state is closer in energy to the reactants than to the products. So with lowest Z value we could find a approximate value of A-B and B-C bond length at transition state.(A-B=1.82 Ang, B-C=0.74Ang)
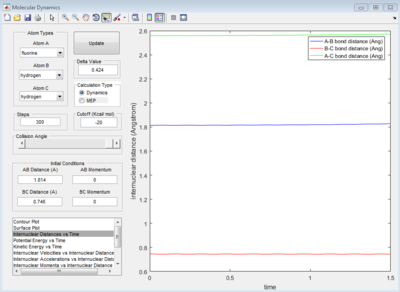
By generating an internuclear VS time diagram to get 3 straight line with almost no fluctuation. The accurate bond distance of A-B and B-C could be found, which is 1.814 Ang and 0.746 Ang respectively.(Figure 10)
 |
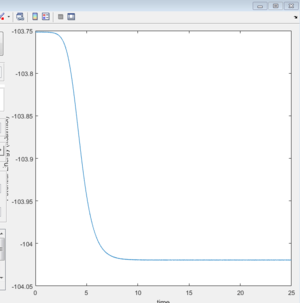 |
As shown on Figure 11, the activation energy could be calculated through potential energy VS time diagram, which is reported as 0.2 Kcal/mol.
H+HF system
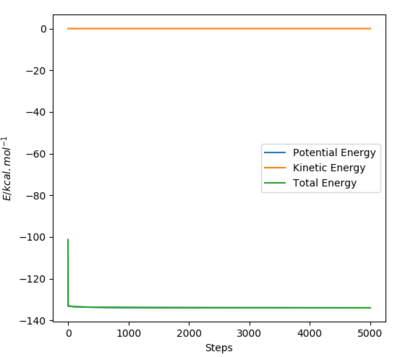
Energy is absorbed when H-F bond is breaking and energy is released to form H-H bond. As shown on Figure 12, this reaction is endothermic (reactant potential energy is lower than product potential energy)which means more energy is absorbed than released. Thus it can be deduced that H-F bond is still stronger than H-H.
 |
 |
According to Hammond's postulate, in an endothermic reaction the transition state is closer in energy to the products than to the reactants. This is thus a reverse reaction of H2+F reaction, so the transition state should have the same position as H2+F system. Using the same method of finding transition state above, a result of at transition state A-B=1.814 Ang, B-C=0.746 Ang could be obtained.
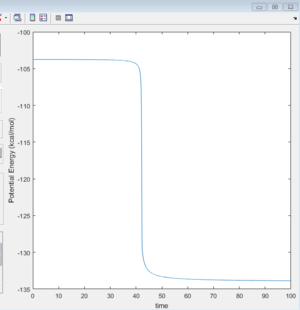
From the potential energy VS time diagram (figure 13)calculated through MEP mode, the activation energy is obtained as 30.2 Kcal/mol.
Reaction dynamics
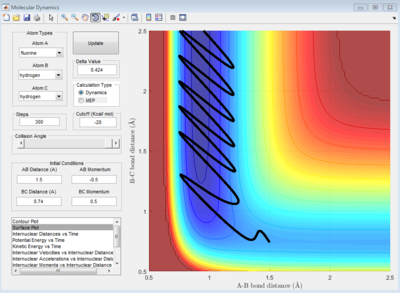
Initial conditions are set as A-B=1.50 ang, B-C=0.74 ang, p(AB)=-0.5 p(BC)=0.5.(A=F, B=H, C=H)
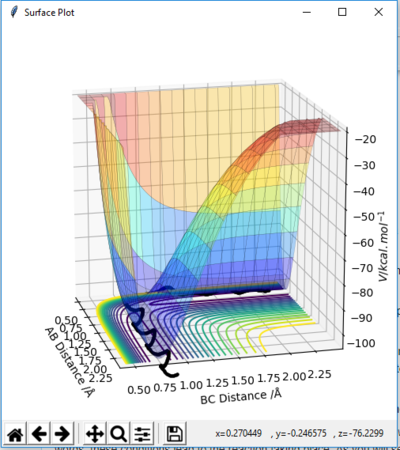
This set of initial conditions gives a reactive trajectory which is shown on Figure 13. According to the animation, A will leave B as C approaches. on the other hand, When p(A-B) is below -1 or above 1, C will bounce back as it approaches B.
 |
 |
 |
Before the reaction, C is vibrating weakly due to the bonding between H atoms (high PE, low KE), as A approaches, the bonding of H2 become weaker, thus C starts to vibrating strongly. Eventually, H-H bond will break, kinetic energy is gained from projecting A and potential energy is lowered. Thus, potential energy is converted into kinetic energy during the exothermic reaction. Figure 14 shows that potential energy decreases as reaction proceed.
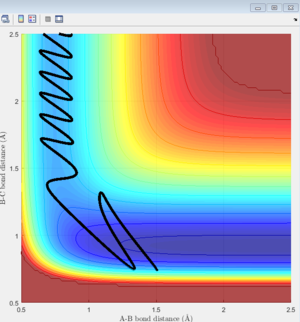
For the H+HF system, the initial conditions are set as A-B=1.50 ang, B-C=0.74 ang, p(AB)=-0.8 p(BC)=0.1.(A=H, B=H, C=F)
Through several calculations of changing the momentum of incoming H atom, it was found that the range pAB=-1~1 is at optimum. (Figure 15)
Decreasing the energy of the H-F vibration will lead to unreactive trajectories. Therefore, a higher momentum of BC is used as initial condition.
An object that has motion has kinetic energy. There are many forms of kinetic energy, including vibrational (the energy due to vibrational motion), and translational (the energy due to motion from one location to another). Less vibrational energy and higher translational energy will lead to higher efficiency of reaction. Early transition state will have translational energy over vibrational energy while late transition state has a distribution of vibrational energy over translational energy.
Nf710 (talk) 12:03, 26 May 2017 (BST) Not enough detail on the second part has not attempted to explain Polyanis rules Missed out some questions about observing experimentally .
