Rep:Mod:XYZABCDE1234
INORGANIC COMPUTATIONAL WEEK 1
Energy optimisation
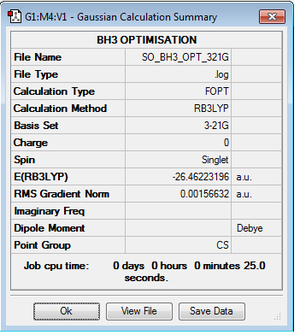
BH3 using B3LYP/3-21G level
Optimisation log file here
BH3 using B3LYP/6-31G level
Optimisation log file here
| summary data | convergence | Jmol | |||
|---|---|---|---|---|---|

|
Item Value Threshold Converged? Maximum Force 0.000012 0.000450 YES RMS Force 0.000008 0.000300 YES Maximum Displacement 0.000064 0.001800 YES RMS Displacement 0.000039 0.001200 YES |
|
GaBr3 optimsation
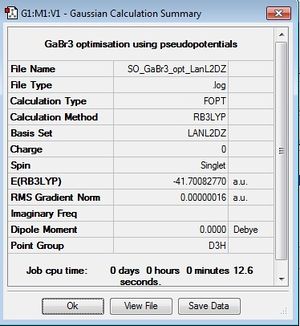
This optimisation used the LanL2DZ pseudo potentials and B3LYP method.
Optimisation log file here
| summary data | convergence | Jmol | |||
|---|---|---|---|---|---|
|
Item Value Threshold Converged? Maximum Force 0.000000 0.000450 YES RMS Force 0.000000 0.000300 YES Maximum Displacement 0.000003 0.001800 YES RMS Displacement 0.000002 0.001200 YES |
|
BBr3 optimisation
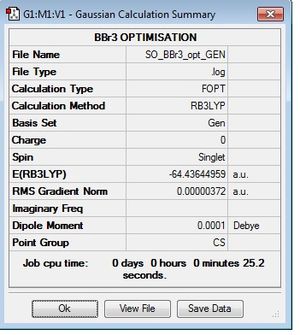
This optimisation used the B3LYP method and the GEN basis set. the additional key words were
B 0
6-31G(d,p)
(4 asterisks)
Br 0
LanL2DZ
(4 asterisks)
Br 0
LanL2DZ
Optimisation log file here
| summary data | convergence | Jmol | |||
|---|---|---|---|---|---|
|
Item Value Threshold Converged? Maximum Force 0.000008 0.000450 YES RMS Force 0.000005 0.000300 YES Maximum Displacement 0.000035 0.001800 YES RMS Displacement 0.000023 0.001200 YES |
|
Geometry Comparison
| BH3 | BBr3 | GaBr3 | |
|---|---|---|---|
| r(E-X) Å | 1.19 | 1.93 | 2.35 |
| θ(X-E-X) degrees(º) | 120.0 | 120.0 | 120.0 |
Changing the ligand from H to Br for the case of boron increased the bond length. This makes sense as Br is a much larger atom than H. H is in the first row of the periodic table whilst Boron is in the second and so the orbitals are not to dissimilar in size and the electronegativity difference isn't too large. Since the orbitals have similar sizes, this allows good orbital overlap and leads to a stronger and shorter bond than in the case of Br. Br is in the fourth row of the periodic table and so it has a larger electronegativity difference from H. The orbitals on Br are also much larger and therefore more diffuse which leads to weaker orbital overlap and hence a weaker and longer bond. The energy mismatch leads to a poorer energy stabilisation when the constituent atomic orbitals overlap to form molecular orbitals. Bromine and Gallium are both in the same row of the periodic table but both orbitals are now large and diffuse and so this leads to weaker orbital overlap and hence a longer and weaker bond. When you change the central element from B to Ga, you get an increase in bond length due to the Ga being a larger atom than B and therefore forming weaker and longer bonds. All 3 compounds are similar in the fact that they have bond angles of 120 degrees.
Size is one of the differences between H and Br. The 1 electron on H is localised on a 1s orbital which is very contracted and penetrates closely to the nucleus. The electron in this are held very close to the nucleus and so is very low in energy. The valence electron in Br are in a diffuse 4p valence orbital and are further from the nucleus and don't penetrate very well at all. This orbital is therefore more diffuse which is why it leads to poorer orbital overlap.
There are instances where gaussview doesn't draw bonds but this doesn't mean there isn't a bond between these two atoms. All it means is that the distance between these two atoms has exceeded the maximum value predefined by gaussview and so once this is exceeded, it doesn't draw in the bond.
A bond is an attractive force that holds atoms together. there is a range of different bonding ranging from strong to weak. Typical strong bonds are covalent and ionic bonds whilst weaker bonds consist of attractions like hydrogen bonding and Van Der Waals ineractions which are a lot easier to break.
An example of a strong bond might be a N2 triple bond which has a dissociation energy of 945 kj/mol making it one of the strongest bonds known. a medium strength bond would be something like C-C or C-Cl which come in at 347 and 331 respectively. An example of a weak bond would be something like hydrogen bonding or van der waals interaction which are very easy to break.
frequency calculations
BH3 frequency calculation
This frequency calculation was carried out using the B3LYP method and 6-31G basis set
Frequency file: here
| summary data | low modes |
|---|---|

|
Low frequencies --- -12.4451 -12.4386 -7.8187 0.0005 0.0235 0.4030 Low frequencies --- 1162.9687 1213.1351 1213.1353 |
Table of vibrational frequencies for BH3
| wavenumber | Intensity | IR active? | type |
| 1163 | 93 | yes | bend |
| 1213 | 14 | yes | bend |
| 1213 | 14 | yes | bend |
| 2583 | 0 | no | stretch |
| 2716 | 126 | yes | stretch |
| 2716 | 126 | yes | stretch |
IR spectrum for BH3
For a molecule to be IR active, there needs to be a change in the dipole moment during the vibration as a result of absorbing infrared radiation. It's quantity is dependent on the orientation of the molecule. In the case of a linear molecule such as CO2, a symmetric stretch would lead to no change on dipole moment as they would cancel each other out and so this stretch doesn't show up in the IR spectrum. If we consider it's asymmetric stretch then this leads to a change in the dipole moment and this stretch shows up in the IR spectrum. The second reason why some vibrations don't appear in an IR spectrum is because two vibrations may be degenerate and so they have the same energy and hence appear at the same wavenumber in the IR spectrum. In the case of this BH3 molecule, there are two pairs of degenerate stretches and so we only visualise two of these peaks instead of four ( we see the ones at 1213 and 2716). the third peak we see is the one at 1163. this is due to this 'wagging' stretch resulting in a change in dipole moment. The 2583 frequency doesn't appear in the IR spectrum because this mode corresponds to a symmetric stretch in which the dipole moments cancel out. to conclude, out of the possible 3N-6 (non-linear molecule) modes possible (6), only three are visible.
SO GaBr3 frequency calculations
| summary data | low modes |
|---|---|

|
Low frequencies --- -1.4878 -0.0015 -0.0002 0.0096 0.6540 0.6540 Low frequencies --- 76.3920 76.3924 99.6767 |
Table of vibrational frequencies for GaBr3
| wavenumber | Intensity | IR active? | type |
| 76 | 3 | yes | bend |
| 76 | 3 | yes | bend |
| 100 | 9 | yes | bend |
| 197 | 0 | no | stretch |
| 316 | 57 | yes | stretch |
| 317 | 57 | yes | stretch |
IR spectrum for GaBr3
The large difference in vibrational frequencies between GaBr3 and BH3 indicates the bonds between GaBr3 are weaker than the bonds between BH3. the force constant for Ga-Br is lower due to the weaker bond and because vibrational frequencies are proportional to the force constant, a lower force constant leads to a lower vibrational frequency. Also, the vibrational frequency is inversely proportional to the reduced mass and so since Ga and Br are heavier atoms compared to B and H, the reduced mass for Ga and Br will be higher and hence this also reduces the vibrational frequency.
the umbrella motion for GaBr3 has a frequency of 100 and an intensity of 9. the umbrella motion of BH3 has a frequency of 1162 and an intensity of 93. the umbrella motion of BH3 is more intense due to the higher force constant and lower reduced mass. For GaBr3 the umbrella motion leads to a large displacement of Ga as this is the heavier atom and so its motion leads to a larger displacement. with BH3, the displacement of B is smaller compared to Ga. the displacement vector of B is smaller whilst the displacement vector of H is much larger. Changing the method or basis set for the optimisation means a comparison can't be made between the energies obbtained for different molecules. This is because the energy obtained is dependent on the type of basis set used. if a basis set with many terms is used, this leads to a more accurate energy being obtained. there comes a point where increasing the number of functions in the basis set leads to no significant change in the energy and the calculation would also take too long at this point so a balance must be found.
carrying out an optimisation means that the optimum position of the nuclei is being determined. By mapping out the energy of the molecule at all the different nuclei positions, a potential energy surface can be mapped out. taking the second derivative of a potential energy curve allows the curvature of the function to be determined and hence shows if a particular position corresponds to a maximum or minimum in energy. In a frequency analysis, if all positive frequencies are obtained, it means a minimum has been found. 1 negative frequency corresponds to the location of a transition state and any more than one means a critical point hasn't been found (i.e. the second derivative isn't zero). the low frequencies represent the 3N-6 vibrational degrees of freedom of a non-linear molecule. with both BH3 and GaBr3, they both have 6 degrees of freedom and so have 6 low frequencies
Molecular orbitals of BH3
Molecular orbitals of BH3
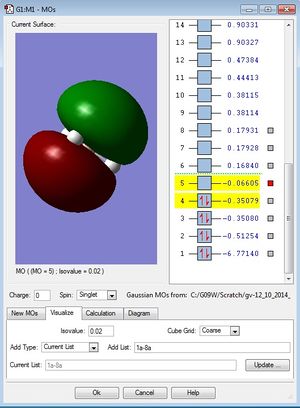
| MO diagram of BH3 | First occupied MO of BH3 (1a1') | Second occupied MO of BH3 (2a1') |
|---|---|---|
|
|
|
| Third occupied MO of BH3 (1e') | Fourth occupied MO of BH3 (1e') | First unoccpied (LUMO) MO of BH3 (1a2') |
|
|
|
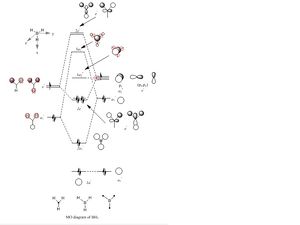
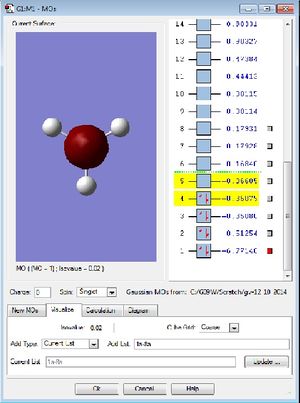
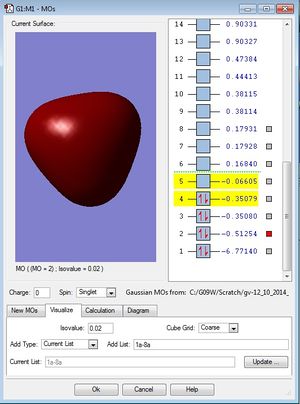
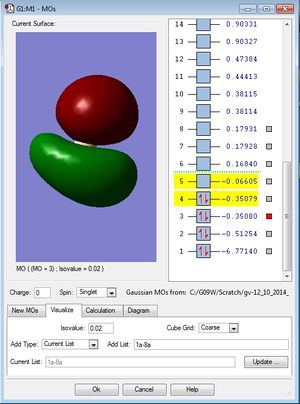
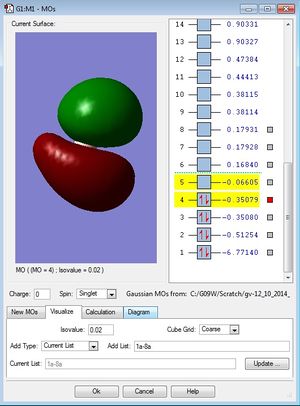
Are there any significant differences between the real and LCAO MOs? What does this say about the accuracy and usefulness of qualitative MO theory?
The LCAO oritals show the resultant Molecular orbital with the orbitals localised on the atom it came from so the orbitals still resemble the constituent atomic orbitals that make up the molecular orbital. with the real MOs, the orbitals are diffuse and delocalised and so all the in phase components delocalise and spread over spread over each other so you are left with a whole MOs that don't resemble the Atomic orbitals which they are made of. Also, the core orbitals tend not to be included in LCAO MO diagrams, the interest with LCAO lies with valence orbitals only. All the MOs that make up the molecule are included in the real MOs. with the MOs produced from computational analysis, we are able to gain exact information on the positions of the MOs relative to one another and the order in which they come and whether mixing definitely occurs or not whereas with LCAO there are instances in which it is diffucult to assess where to place the MOs relative to one another and which orbitals are more antibonding or bonding. mixing is also slightly difficult to predict at times as its hard to predict whether the MOs are close enough in energy to engage in mixing. MO theory is a very useful qualitative model which explains much of the bonding observed in molecules which theories like VSEPR and crystal field theory can't explain. It describes the electrons as being delocalised over the hole of the molecule rather than being localised in the conventional 2 electron-2 center bonding model that is widely used to explain bonds in molecules. it is also very useful in describing reactivity as it can be calculated which MOs correspond to the LUMO and those that correspond to the HOMO.it is also very useful in explaining observed vibrational frequencies in IR. a specific example is that of carbonyl stretches. upon coordination of a CO to a mateal complex, an increase in bond order is observed. this can be explained using MO theory as the electrons used to bond to the metal complex come from a weakly antibonding orbital and so removing electron from here lead to an increase in the bond order of the carbonyl.
NBO analysis of NH3
Energy optimisation of NH3
This optimisation was carried out using the B3LYP method and the 6-31G basis set
| summary data | low modes | Jmol | |||
|---|---|---|---|---|---|

|
Item Value Threshold Converged? Maximum Force 0.000006 0.000450 YES RMS Force 0.000004 0.000300 YES Maximum Displacement 0.000012 0.001800 YES RMS Displacement 0.000008 0.001200 YES |
|
frequency analysis
| summary data | low modes |
|---|---|

|
Low frequencies --- -0.0129 0.0009 0.0017 7.0722 8.1014 8.1017 Low frequencies --- 1089.3849 1693.9369 1693.9369 |
As shown above, there are no negative frequencies present which indiactes that a minima has been found. having 1 negative frequency would indicate the location of a transition state and more than one would show the optimisation was unsuccesful
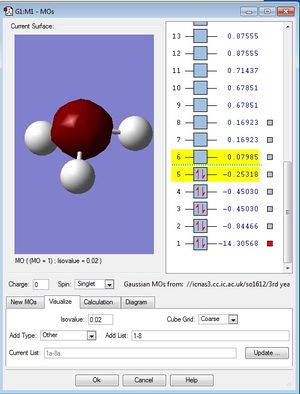
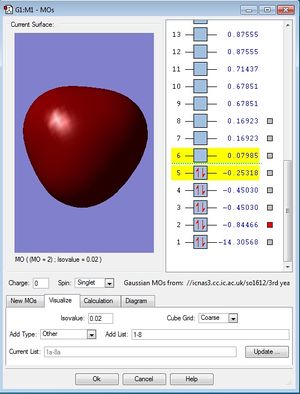
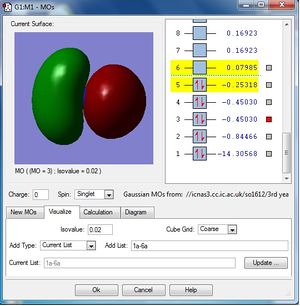
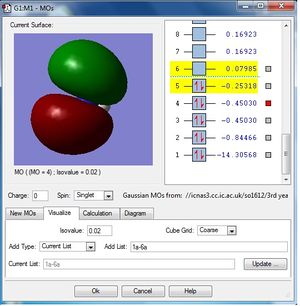
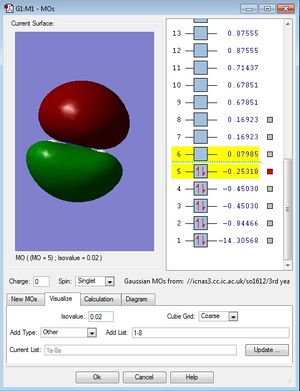
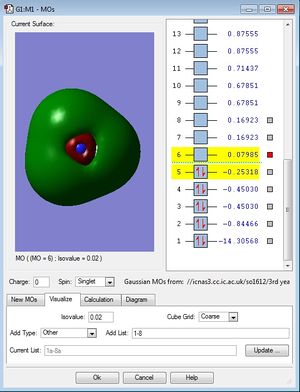
MO population analysis
| First occupied of NH3 | Second occupied MO of NH3 | Third occupied MO of BH3 |
|---|---|---|
|
|
|
| Fourth occupied MO of NH3 | Fifth occupied MO of NH3 | First unoccupied MO (LUMO) of NH3 |
|
|
|
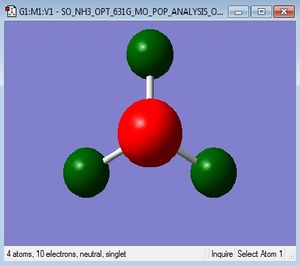
NBO analysis
| charge distribution of NH3 by colour |
|---|
|
| charge distribution of NH3 by number |
|---|
|
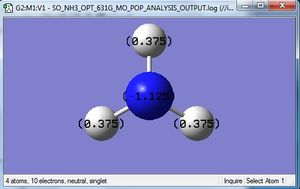
the specific NBO charge for N is -1.125 and the specific NBO charge for H is 0.375. NH3 is a polarised molecule due to the electronegativity difference between N and H. the H is less electronegative that N and so has a delta positive charge. This is indicated by the green colour on the H atoms in the diagram above. The N is more elctronegative and so is shown in red. The charge range here is -1.125 to 1.125
NH3BH3
optimisation calculation
| summary data | low modes | Jmol | |||
|---|---|---|---|---|---|

|
Item Value Threshold Converged? Maximum Force 0.000002 0.000015 YES RMS Force 0.000001 0.000010 YES Maximum Displacement 0.000023 0.000060 YES RMS Displacement 0.000010 0.000040 YES |
|
frequency calculations
| summary data | low modes |
|---|---|

|
Low frequencies --- -5.5864 -0.3045 -0.0443 -0.0012 1.2181 1.2915 Low frequencies --- 263.2842 632.9623 638.4603 |
IR spectrum of NH3BH3
IR stretches
| wavenumber | Intensity | IR active? | type |
| 263 | 0 | no | bend |
| 632 | 14 | yes | stretch |
| 638 | 4 | yes | bend |
| 638 | 4 | yes | bend |
| 1069 | 41 | yes | bend |
| 1069 | 41 | yes | bend |
| 1196 | 109 | yes | bend |
| 1204 | 3 | yes | bend |
| 1204 | 3 | yes | bend |
| 1329 | 114 | yes | bend |
| 1676 | 28 | yes | bend |
| 1676 | 28 | yes | bend |
| 2472 | 67 | yes | stretch |
| 2532 | 231 | yes | stretch |
| 2532 | 231 | yes | stretch |
| 3464 | 3 | yes | stretch |
| 3581 | 28 | yes | stretch |
| 3581 | 28 | yes | stretch |
Dissociation energy
| BH3 | NH3 | NH3BH3 | |
|---|---|---|---|
| energy of molecule (kj/mol) | -69878.54 | -148492.43 | -218506.44 |
ΔE = -0.0515967 au |
ΔE = -135.47 kj/mol
this is a medium to weak bond. A typical C-C bond is around 347 kj/mol and so this is over twice as large as the value obtained for the B-N. a typical O-O bond has a dissociation energy of around 146 kj/mol and this bond is known to be a relatively weak bond which suggests that the B-N bond is quite weak
INORGANIC COMPUTATIONAL WEEK 2
All calculations carried out in week 2 used the following mix basis set and pseudo-potentials
Al 0
6-31G(d,p)
(4 asterisk)
Cl 0
6-31G(d,p)
(4 asterisk)
Br 0
LanL2DZ
(4 asterisk)
Br 0
LanL2DZ
AlBrCl2 monomer
optimisation of AlBrCl2 monomer
Optimisation log file here
the point group of this molecule is C2v
| summary data | low modes | Jmol | |||
|---|---|---|---|---|---|

|
Item Value Threshold Converged? Maximum Force 0.000004 0.000015 YES RMS Force 0.000002 0.000010 YES Maximum Displacement 0.000033 0.000060 YES RMS Displacement 0.000018 0.000040 YES |
|
frequency analysis of AlBrCl2 monomer
frequency analysis log file here
| summary data | low modes |
|---|---|

|
Low frequencies --- -0.0014 0.0013 0.0035 1.7475 1.8226 3.4673 Low frequencies --- 120.7357 133.8449 185.7593 |
Al2Br2Cl4 isomer 1
optimisation of isomer 1
Optimisation log file here
the point group of this molecule is D2h
| summary data | low modes | Jmol | |||
|---|---|---|---|---|---|

|
Item Value Threshold Converged? Maximum Force 0.000002 0.000015 YES RMS Force 0.000001 0.000010 YES Maximum Displacement 0.000035 0.000060 YES RMS Displacement 0.000013 0.000040 YES |
|
frequency calculation of isomer 1
frequency calculation log file here
| summary data | low modes |
|---|---|

|
Low frequencies --- -0.8488 -0.0040 -0.0023 -0.0016 1.2886 1.3972 Low frequencies --- 16.0712 63.6256 86.1140 |
IR spectrum of isomer 1
IR stretches of isomer 1
| wavenumber | Intensity | IR active? | type |
| 16 | 0 | no | bend |
| 64 | 0 | no | bend |
| 86 | 0 | no | bend |
| 87 | 0 | no | bend |
| 108 | 5 | yes | bend |
| 111 | 0 | no | bend |
| 126 | 8 | yes | bend |
| 135 | 0 | no | bend |
| 138 | 7 | yes | bend |
| 163 | 0 | no | bend |
| 197 | 0 | no | bend |
| 241 | 100 | yes | bend |
| 247 | 0 | no | bend |
| 341 | 161 | yes | bend |
| 468 | 346 | yes | bend |
| 494 | 0 | no | bend |
| 609 | 0 | no | bend + stretch |
| 617 | 332 | yes | bend |
Al2Br2Cl4 isomer 2
optimisation of isomer 2
Optimisation log file here
the point group of this molecule is C2h
| summary data | low modes | Jmol | |||
|---|---|---|---|---|---|

|
Item Value Threshold Converged? Maximum Force 0.000000 0.000015 YES RMS Force 0.000000 0.000010 YES Maximum Displacement 0.000006 0.000060 YES RMS Displacement 0.000003 0.000040 YES |
|
frequency calculation
frequency calculation log file here
| summary data | low modes |
|---|---|

|
Low frequencies --- -0.7737 -0.6941 -0.0042 -0.0039 -0.0032 2.1609 Low frequencies --- 18.3066 49.2144 72.9031 |
IR spectrum of isomer 2
IR stretches of isomer 2
| wavenumber | Intensity | IR active? | type |
| 18 | 0 | no | bend |
| 49 | 0 | no | bend |
| 73 | 0 | no | bend |
| 105 | 0 | no | bend |
| 109 | 0 | no | bend |
| 117 | 9 | yes | bend |
| 120 | 13 | yes | bend |
| 157 | 0 | no | bend |
| 159 | 6 | yes | bend |
| 192 | 0 | no | bend |
| 263 | 0 | no | bend |
| 280 | 29 | yes | bend |
| 308 | 0 | no | bend |
| 413 | 149 | yes | bend |
| 421 | 438 | yes | bend |
| 459 | 0 | no | bend |
| 575 | 0 | no | bend and stretch |
| 580 | 316 | yes | bend and stretch |
MO analysis
| MO 37 of isomer 2 | MO 38 of isomer 2 | MO 44 of isomer 2 angle 1 |
|---|---|---|
|

|

|
| MO 44 of isomer 2 angle 2 | MO 46 of isomer 2 angle 1 | MO 46 of isomer 2 angle 2 |

|

|
|
| MO 48 of isomer 2 | ||
|
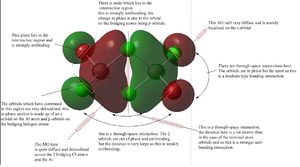
A range of MOs have been chosen for analysis of the bonding and antibonding interactions present. MO 37 us the most anti-bonding orbital. It has a nodal plane running through the molecule which is a very antibonding feature. it also has a close contact out of phase interaction between the 2 large delocalised orbitals which are close together. the only bonding interactions are through-space and far apart and so this isn't enough to balance out the antibonding interactions.
MO 38 is a weakly bonding orbital. it has 6 bonding through-space interactions. there is a change in phase between the s orbitals on the periphery of the MO and the delocalised orbitals in the centre of the molecule. this is a destructive interaction and so raises the energy of the MO slightly. this orbitals is therefore a weakly bonding orbital.
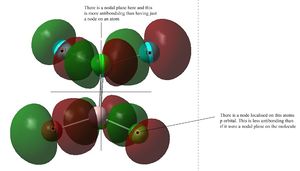
MO 44 has a nodal plane lying across the molecule as well as nodes localised on atoms. There are a few through-space bonding interactions but there are also a few through-space antibonding interactions too. both the through space interactions are weak and so overall this is a weak/medium strength antibonding orbital.
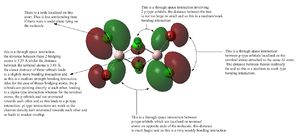
MO 46 has 2 nodal planes running across the molecule as well as nodal planes localised on atoms. there is a pi-type bonding through-space interaction between the p orbitals localised on the bridging halogen atoms. there is also a very weak bonding through-space interaction between the orbitals on the terminal position on opposite ends of the molecule. there is a weak antibonding interaction along with a medium strength bonding interaction between the p orbitals located on the terminal atom of the same Al atom. overall when all these interactions are considered, the MO is an overall non-bonding/very weakly antibonding orbital.
MO 48 has bonding through-space interactions between the terminal atom orbitals and the bridging atom orbitals. these are medium/weak in strength. there are also through-space interactions between the in phase portion of the bridging atoms with each other. this is a relatively short distance and is a bonding interaction. there are also bonding interactions between the p-orbitals on terminal positions on either end of the molecule. this is a very weak bonding interaction. there are nodes localised on atoms which is less antibonding than the presence of a nodal plane. This orbital is therefore an overall bonding orbital.
Al2Br2Cl4 isomer 3
optimisation of isomer 3
Optimisation log file here
the point group of this molecule is C1
| summary data | low modes | Jmol | |||
|---|---|---|---|---|---|

|
Item Value Threshold Converged? Maximum Force 0.000001 0.000015 YES RMS Force 0.000001 0.000010 YES Maximum Displacement 0.000042 0.000060 YES RMS Displacement 0.000015 0.000040 YES |
|
frequency calculation on isomer 3
frequency calculation log file here
| summary data | low modes |
|---|---|

|
Low frequencies --- -0.1682 0.0026 0.0031 0.0034 1.1159 1.8154 Low frequencies --- 16.9444 55.9190 80.0642 |
IR spectrum of isomer 3
IR stretches table of isomer 3
| wavenumber | Intensity | IR active? | type |
| 17 | 0 | no | bend |
| 56 | 0 | no | bend |
| 80 | 0 | no | bend |
| 92 | 1 | yes | bend |
| 107 | 0 | no | bend |
| 110 | 5 | yes | bend |
| 121 | 8 | yes | bend |
| 149 | 5 | yes | bend |
| 154 | 6 | yes | bend |
| 186 | 1 | yes | bend |
| 211 | 21 | yes | stretch |
| 257 | 10 | yes | stretch |
| 289 | 48 | yes | bend |
| 384 | 153 | yes | bend |
| 424 | 274 | yes | stretch+bend? |
| 493 | 107 | yes | stretch+bend? |
| 575 | 122 | yes | stretch |
| 615 | 197 | yes | stretch |
Al2Br2Cl4 isomer 4
optimisation of isomer 4
Optimisation log file here
The point group of this isomer is C2v
| summary data | low modes | Jmol | |||
|---|---|---|---|---|---|

|
Item Value Threshold Converged? Maximum Force 0.000001 0.000015 YES RMS Force 0.000000 0.000010 YES Maximum Displacement 0.000020 0.000060 YES RMS Displacement 0.000006 0.000040 YES |
|
frequency calculation isomer 4
frequency calculation log file here
| summary data | low modes |
|---|---|

|
Low frequencies --- -1.3404 -0.7761 -0.0023 0.0010 0.0015 2.2218 Low frequencies --- 17.4961 51.1462 78.5264 |
IR spectrum of Isomer 4
IR stretches table for isomer 4
| wavenumber | Intensity | IR active? | type |
| 18 | 0 | no | bend |
| 51 | 0 | no | bend |
| 79 | 0 | no | bend |
| 99 | 0 | no | bend |
| 103 | 3 | yes | bend |
| 121 | 13 | yes | bend |
| 123 | 6 | yes | bend |
| 157 | 0 | no | bend |
| 158 | 5 | yes | bend |
| 194 | 2 | yes | bend |
| 263 | 0 | no | bend + stretch? |
| 279 | 26 | yes | bend+stretch? |
| 308 | 2 | yes | bend |
| 413 | 149 | yes | bend |
| 420 | 410 | yes | bend |
| 461 | 35 | yes | bend |
| 571 | 33 | yes | stretch+bend? |
| 583 | 277 | yes | stretch+bend? |
The energies of the 4 isomers is as follows:
Isomer 1= -2352.4063255 a.u = -6176243.28 kj/mol isomer 2= -2352.4163010 a.u = -6176269.47 kj/mol isomer 3 = -2352.4111073 a.u = -6176255.83 Kj/mol isomer 4 = -2352.4162785 = - 6176269.41 Kj/mol
The values in atomic units have been reported up to 7 d.p and the values in KJ/mol have been reported up to 2 d.p.
The energies of these isomers relative to the lowest energy isomer (isomer 2) are as follows:
isomer 2 reference = 61766269.47 kj/mol isomer 1 relative to 2= 26.19 kj/mol isomer 3 relative to 2= 13.64 kj/mol isomer 4 relative to 2= 0.06 kj/mol
relative to isomer 2, isomer 4 has the lowest energy and so this is the second most stable isomer. isomer 1 has the highest energy and so this is the highest energy isomer.
From the lowest to the highest energy conformer, the order is as follows: Isomer 2<isomer 4<isomer 3<isomer 1
This is because in isomer 2, the 2 terminal Br atoms are in a trans conformation and so this conformation minimises the steric clashes of these large Br atoms the most. They are also at the terminal position of the Al rather than being bridged between the two Al atoms. The Br-Al-Cl terminal bond angle is 122⁰ putting them as far apart as they can be for theses dimer conformations. For isomer 4, the smaller of the halogen atoms (Cl) is still the bridging atoms but now the Br atoms are terminal and cis to each other on the 2 different Al atoms. They now clash more with one of the bridging Cl atoms than is they were trans to each other. This effect isn’t large since the terminal Br atoms are quite far from the bridging Cl atoms and this is reflected in there only being a slight increase in energy from isomer 2 to isomer 4. If 1 Br and 1 Cl atom was to be in the bridging position like in isomer 3 then this leads to a higher energy conformer than for isomer 4 because now instead of having 2 bridging Cl atoms we have replaced 1 Cl with a Br. This leads to a large steric clash due to the Br atom being larger and the bond angle between them is 91⁰ meaning they are also closer together. You also get steric clashing between the bridging Br and the terminal Br as they are now much closer together than in the case of isomer 2 and 4 (where they were attached at the terminal position). The highest energy conformer is isomer 1. Both Br atoms are now in the bridging position and the angle between these is 92⁰. This leads to huge steric clashing between the Br atoms and so its energy is significantly higher and this is reflected in the energy obtained.
The energy of the monomer was computed and found to be -1176.1901404 a.u which is equal to -3088087.45 kj/mol dissociation energy of the lowest energy conformer (isomer 2:- trans terminal Br) =
ΔE=E(Al2Br2Cl4))-[E 2(AlCl2Br)]
=E(-2352.41630099)-E(2x-1176.19014036) = -0.0360203 a.u
ΔE = -94.57 Kj/mol
The dimer product is more stable than its constituent monomers. This is reflected in the negative dissociation energy. This negative value shows that energy is released upon bond formation and this stabilises the product. One of the most useful applications of point group theory is in predicting the number of IR active bands you are likely to expect from any given molecule.
The IR spectra appearance and the number of bands visible reveals a lot about the symmetry and point group of the molecule. Isomer 1 (bridging Br) is the most symmetrical compound as indicated by it’s D2h point group. It is therefore expected to have the least IR bands present in the spectrum. This is what is observed in the IR spectrum obtained from the computed frequency analysis. This is because for a IR band to be visible, the molecule needs to have a change in dipole moment associated with the stretch or bend. Symmetrical molecules tend to have many of the stretches and bends cancelling the dipole moments and therefore less of these bends and stretches are observed. Isomer 3 has C1 symmetry and is therefore the least symmetrical molecule present. It therefore has the most IR bands visible in the IR spectrum. It is easy to predict how many bands should be present in the IR spectrum by considering the Point group of the molecule. once the irreducible representation has been found, it can be seen whether or not a vibration leads to an IR active band or not. if a vibration corresponds to an irreducible represnetation with the same symmetry as the x,y or z coordinate then it is said to be IR active
A requirement for the Bands to be IR active is that the molecule , upon vibration, must exhibit a change in dipole moment. So whilst you will only visualise these IR active bands in the IR spectrum, using computational chemistry we can also calculate the vibrations that occur in the molecule which don’t lead to a change in dipole moment and so we are able to visualise all the bends and stretches a molecule can present.
The effect of having 2 Br atoms in the bridging position over 2 Br atoms in terminal positions can have an effect on the frequency of the IR band observed. The equation that tells us the vibrational frequency of a stretch or bend is υ=1/2π √(k/μ) . From this equation, it can be seen that the vibrational frequency is directly proportional to the force constant, k. so a stronger bond leads to a higher vibrational frequency.
The symmetric stretch at 247 for the birding Br atoms is lower than the symmetric stretch for the terminal Br atoms at 308. Again this can be linked to the bond length being longer for the terminal Br atoms and therefore leading to a weaker bond. The bonding in the Al-Br-Al bridge can be viewed as being formed of 1 normal 2 centre-2 electron bond whilst the other is a dative 2 centre 2 electron bond. Overall both molecules present no change in dipole moment due to the symmetric stretches and therefore the intensity of the band is 0.
If a comparison is made between the symmetric stretch of the bridging atoms of isomer 1 (where both bridging atoms are Br atoms) and the symmetric stretch of the bridging atoms of isomer 4 (where now both bridging atoms are Cl) then it can be seen that the frequency for this mode is higher for isomer 4 than isomer 1. The frequency for isomer 4 is 263 whereas that for isomer 1 is 197. This higher frequency for isomer 4 is due to the bridging atoms being Cl. Cl is a smaller atom compared to Br and so its orbitals are more contracted and this allows for better orbital overlap with the Al atoms and leads to a shorter and stronger bond. It therefore has a higher force constant and leads to a higher frequency stretch. The intensity of this stretch is 0 for both due to the stretches leading to no change in dipole moment, which is a prerequisite for a mode to be IR active.
If one of the Cl bridging atoms is swapped for a Br atom (like in the case of isomer 3) then a comparison of this same symmetric stretching mode reveals a decrease in the stretching frequency of the symmetric stretch in comparison to isomer 4. It has a frequency of 211. This is due to the replacement of one of the Cl atoms for a larger Br atom. This Br atoms has a more diffuse valence orbital and so leads to poorer orbital overlap with the valence orbitals of Al and hence a longer and weaker bond. this leads to a lower force constant and also Br is a heavier atom so has a larger reduced mass and this further decreases the vibrational frequency. Al and Cl are also in the same row of the periodic table and so the orbitals will be of a similar size which again leads to better overlap. The intensity of this stretch is now 21 for isomer 3. This is due to the dipole moments not cancelling out in this isomer as there are 2 bridging atoms involved in the stretch and the vibration displaces them to different extents and hence leads to a non-zero dipole. Isomer 2 has both Cl atoms bridging just like isomer 4 and so a very similar frequency would be expected for the symmetric stretch mode. The frequency of the stretch is 263, which is exactly the same as that obtained for isomer 4.
A similar comparison can be made for the asymmetric stretches. A comparison of isomer 1 and isomer 4 reveals that the asymmetric stretch for isomer 1 is at 241 whereas that of isomer 4 is at 279. As expected, the stretch for isomer 4 is higher due to the two bridging atoms being Cl which forms stronger bonds with Al. the stretch for isomer 2 is expected to again be similar to isomer for as the 2 bridging atoms are also Cl and this is indeed the case. The majority of the motion due to this vibration occurs with the bridging atoms rather than the terminal ones just like the symmetric example above. It is therefore expected that the value for the frequency of vibration is dominated by the strength of these bridging halogen atoms to the Al atoms.
Moving on to the terminal stretches, a comparison was made between the symmetric stretches of the different isomers. Isomer 1 has all the terminal atoms as Cl. This is therefore expected to have the highest vibrational frequency as the Al-Cl bond is stronger than the Al-Br bond for reasons discussed above. Swapping one of the terminal Cl atoms in isomer 1 for Br leads to isomer 3. This has a lower vibrational frequency for this symmetric mode due to the Al-Br bond being weaker, leading to a reduced force constant. The reduced mass is also large now due to the Br atom being larger than the Cl atom and so this further reduces the vibrational frequency. Swapping 2 of the Cl atoms for Br atoms, as in the case of isomer 4 leads to a further decrease in the vibrational frequency observed. The intensity of the symmetric stretch for isomer is 0, which is to be expected. All 4 terminal atoms are Cl and so the symmetric stretch of these atoms leads to no change in dipole moment and so isn’t IR active. The intensity of this symmetric stretch for isomer 3 and 4 is non-zero ( 122 and 33 respectively). This is due to the presence of both Cl and Br now (as opposed to the case of isomer 1 when on Cl atoms were on the terminal positions). The vibration leads to different displacements of these bonds due to the force constant and reduced mass and so the dipoles don’t cancel out. Isomer 2 has the 2 Br atoms trans and so displacement of the terminal atoms by vibration leads to a cancellation of the dipole moments and this is confirmed by the intensity of this stretch being 0. It has the same vibrational frequency as isomer 3 because both of these isomers have 2 Cl and 2 Br terminal atoms.
Looking at the asymmetric stretches, isomer 1 again has the highest vibrational frequency. Both isomer 2 and 4 are again similar in the value of their vibrational frequency due to both having 2 Cl and 2 Br terminal atoms.
| Bond | Type of stretch | Isomer 1 | Isomer 2 | Isomer 3 | Isomer 4 |
|---|---|---|---|---|---|
| Bridging | Symmetric | 197 | 263 | 211 | 263 |
| Bridging | Asymmetric | 241 | 280 | - | 279 |
| Terminal | Symmetric | 609 | 575 | 575 | 571 |
| Terminal | Asymmetric | 617 | 580 | - | 583 |

