Rep:Mod:XYZ8410
Module 2
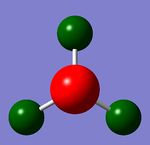
BH3 Optimisation
A borane molecule was made in Gaussview 5.0, and all B-H bonds were set to 1.5 Å. This molecule was the optimised. This computational process involves solving the Scrhrodinger equation for the electrons, assuming no nuclear motion(Born-Oppenheimer Principle). This is the SCF part. The second part of the process, referred to as OPT, then solves for nuclear position. The system is based on downhill energies. These were performed for borane and the results are shown.
3-21G Basis Set
File:BH3OPT.LOG B-H Bond Distance: 1.193 Angstrom H-B-H Angle: 120 Degrees
| Paramater | |
|---|---|
| File Type | .log |
| Calculation Type | FOPT |
| Calculation Method | RB3LYP |
| Basis Set | 3-21G |
| Final Energy(au) | -26.46226338 |
| Gradient | 0.00020672 |
| Dipole Moment | 0.0000 |
| Point Group | D3H |
| Calculation Length | 5min 48s |
         Item               Value     Threshold  Converged?
 Maximum Force             .000090      .000450     YES
 RMS     Force             .000059      .000300     YES
 Maximum Displacement      .000352      .001800     YES
 RMS     Displacement      .000230      .001200     YES
 Predicted change in Energy=-4.580915E-08
 Optimization completed.
    -- Stationary point found.
6-31G(d,p) Basis Set
This calculation allowed an appreciation of difference in basis sets.A better basis set uses more functions to find a better fit to electronic structure. As such, it may be expected that optimising BH3 using the 6-31G (d,p) basis set will find a stationary point closer to the low energy structure of borane than the previous, inferior data set. This was shown to be the case, as the energy in a.u, while not necessarily directly comparable, was lower, as was the gradient, suggesting a larger number of iterations, finishing less difference between values than the previous basis set. The results are shown below:
B-H Bond Length: 1.19232 Angstrom H-B-H Angle: 120.000 Degrees
It is also worth noting that the bond angle has decreased by a small fraction of an angstrom (<0.01). Although marginal, it provides some amount of confirmation that the molecule is in a more stable environment, as shorter bonds are generally stronger.
| Paramater | |
|---|---|
| File Type | .log |
| Calculation Type | FOPT |
| Calculation Method | RB3LYP |
| Basis Set | 6-31G(d,p) |
| Final Energy(au) | -26.61532363 |
| Gradient | 0.00000235 |
| Dipole Moment | 0.0000 |
| Point Group | D3H |
| Calculation Length | 1min 58s |
         Item               Value     Threshold  Converged?
 Maximum Force            0.000005     0.000450     YES
 RMS     Force            0.000003     0.000300     YES
 Maximum Displacement     0.000019     0.001800     YES
 RMS     Displacement     0.000012     0.001200     YES
 Predicted change in Energy=-1.304899D-10
 Optimization completed.
    -- Stationary point found.
TlBr3 Optimisation
When there is a heavy atom present, more complicated calculations are necessary. TlBr3 has a large number of electrons and as such suffer from relativistic effects not present in the standard form of the Schrodinger equation. This means that it is more accurate to use pseudo-potentials. As most reactivity concerns valence electrons, pseudopotentials are a method of modelling core electrons to give greater accuracy.
DOI:https://spectradspace.lib.imperial.ac.uk:8443/dspace/handle/10042/22674
Tl-Br Bond distance = 2.65095 Angstroms Br-Tl-Br angle = 120.000 Degrees Interestingly, a 2000 paper by Suzuki and Nakai(DOI: 10.1143/JPSJ.69.532) gives assigns TlBr(diatomic) an experimental bond length of 2.618Å. This suggests, but does not entirely confirm, that calculations at this level are able to get values close to those actually observed.
| Paramater | |
|---|---|
| File Type | .log |
| Calculation Type | FOPT |
| Calculation Method | RB3LYP |
| Basis Set | LANL2DZ |
| Final Energy(au) | -91.21812851 |
| Gradient | 0.00000090 |
| Dipole Moment | 0.0000 |
| Point Group | D3H |
| Calculation Length | 0min 18s |
          Item               Value     Threshold  Converged?
 Maximum Force            0.000002     0.000450     YES
 RMS     Force            0.000001     0.000300     YES
 Maximum Displacement     0.000022     0.001800     YES
 RMS     Displacement     0.000014     0.001200     YES
 Predicted change in Energy=-6.084036D-11
 Optimization completed.
    -- Stationary point found.
BBr3 Optimisation
This calculation is an example of mixing psuedo-potentials and full basis sets. This is important because despite a heavy atom(Br) there is also a lighter atom which is best represented by a full basis set. This involves altering the gjf file to allow different treatment of the different atoms.
File:Log 69165.log DOI:https://spectradspace.lib.imperial.ac.uk:8443/dspace/handle/10042/22872
B-Br bond length: 1.93396 Angstrom
Br-B-Br angle: 120.000 Degrees
| Paramater | |
|---|---|
| File Type | .log |
| Calculation Type | FOPT |
| Calculation Method | RB3LYP |
| Basis Set | Gen |
| Final Energy(au) | -64.43645296 |
| Gradient | 0.00000382 |
| Dipole Moment | 0.0000 |
| Point Group | D3H |
| Calculation Length | 0min 20s |
    Item               Value     Threshold  Converged?
 Maximum Force            0.000008     0.000450     YES
 RMS     Force            0.000005     0.000300     YES
 Maximum Displacement     0.000036     0.001800     YES
 RMS     Displacement     0.000023     0.001200     YES
 Predicted change in Energy=-4.026911D-10
 Optimization completed.
    -- Stationary point found.
Bond Length Comparison
| Compound | Bond Distance/Angstroms |
|---|---|
| BH3 | 1.19232 |
| BBr3 | 1.93396 |
| TlBr3 | 2.65095 |
There is a large variation in the bond lengths, with the Tl-Br bond length more than double that of B-H in BH3. H and Br are vastly different in size and this leads to longer and weaker bonds. H and Br both have a valency of 1 and in all cases a trigonal planar angle of 120 degrees was observed. Br and H also have different electron affinities, with Hydrogen more likely to lose an electron, where Br is more likely to form an anion. The bond length becomes much larger in changing to a larger ligand because of increased van der Waals radii and decreased effective nuclear charge. Pi backdonation into the empty p orbital on Boron is possible,but due to the much larger Br orbitals, it is likely to be weak due to poor overlap. A similar effect to the increase in ligand size is observed in the use of a lower group 13 element. Once again, Boron is much smaller, and also more electropositive, suggesting that BBr3 is more Lewis acidic. The Tl-Br bond is so long because of the size of both atoms and the poor overlap between them. As such, is may lead to bonds sufficiently weak that is is unfavourable to form 3 more bonds as the formation is not compensated by stable enough bonds, preferring a lower valency. This is known as the inert pair effect BH3and TlBr3 may not exist as shown, BH3 is known to dimerise to diborane, stabilising electron deficiency with 3 centre-2 electron bonds. TlBr3 may not exist as a consequence of the inert pair effect, where large coordination numbers become progressively less favourable.
Frequency analysis of BH3
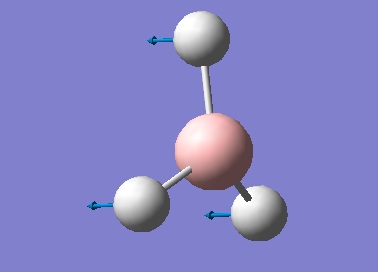
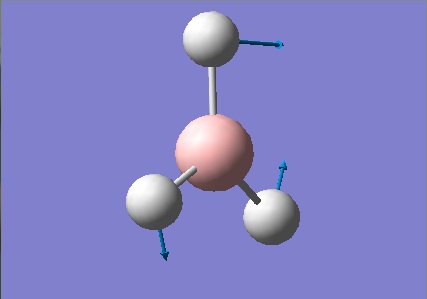
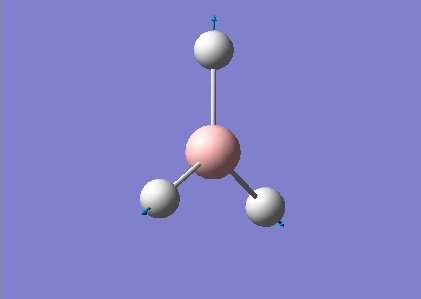
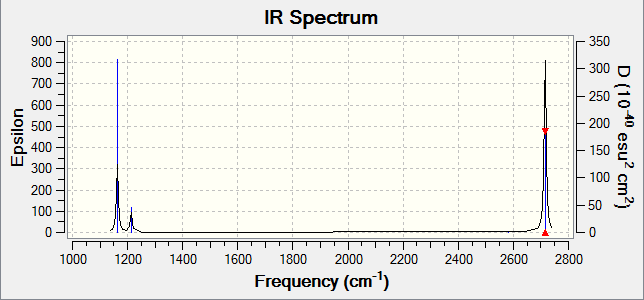
Frequency analysis is an important tool for 2 reasons; to ensure the molecule is fully optimised and to give IR and Raman modes. The first reason is relevant because the frequency is the second derivative of the potential energy surface. Therefore, because the gradient at a maximum and minimum are both 0, this method differentiates between a transition state and an energy minimum. It also shows whether the optimisation is complete. Additionally, a valuable usage of these calculations is to give vibrational modes. This can allow the generation of spectra, which are shown below, an excellent method for comparing experiment and computational prediction.
The basis set for these calculations, except when a pseudo-potential was used, was kept constant, with 6-31G (d,p) being used for all molecules, which allows direct comparison of the results.
 Low frequencies ---   -0.9033   -0.7343   -0.0054    6.7375   12.2491   12.2824
 Low frequencies --- 1163.0003 1213.1853 1213.1880
 Harmonic frequencies (cm**-1), IR intensities (KM/Mole), Raman scattering
 activities (A**4/AMU), depolarization ratios for plane and unpolarized
 incident light, reduced masses (AMU), force constants (mDyne/A),
 and normal coordinates:
                     1                      2                      3
                    A2"                    E'                     E'
 Frequencies --  1163.0003              1213.1853              1213.1880
 Red. masses --     1.2531                 1.1072                 1.1072
 Frc consts  --     0.9986                 0.9601                 0.9601
 IR Inten    --    92.5478                14.0553                14.0589
  Atom  AN      X      Y      Z        X      Y      Z        X      Y      Z
     1   5     0.00   0.00   0.16     0.00   0.10   0.00    -0.10   0.00   0.00
     2   1     0.00   0.00  -0.57     0.00   0.08   0.00     0.81   0.00   0.00
     3   1     0.00   0.00  -0.57    -0.39  -0.59   0.00     0.14   0.39   0.00
     4   1     0.00   0.00  -0.57     0.39  -0.59   0.00     0.14  -0.39   0.00
                     4                      5                      6
The results in the table above show the vibrational modes of the molecule. The small values are ideally as close to 0 as possible and a range of ±15cm-1. This is clearly the case here, and the largest of these numbers is 2 orders of magnitude smaller than the first mode.
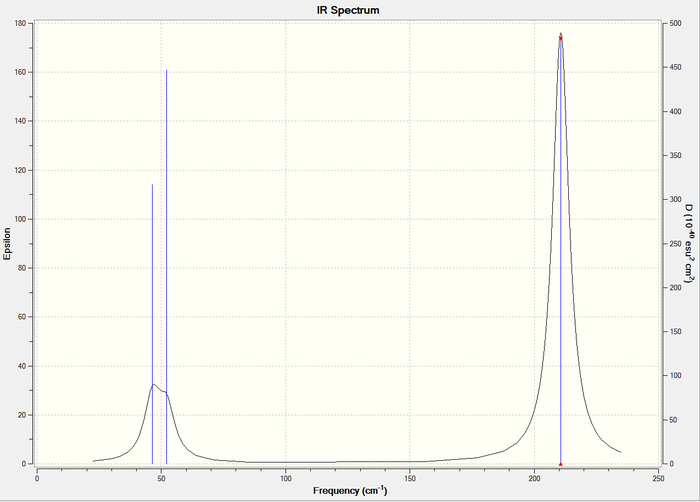
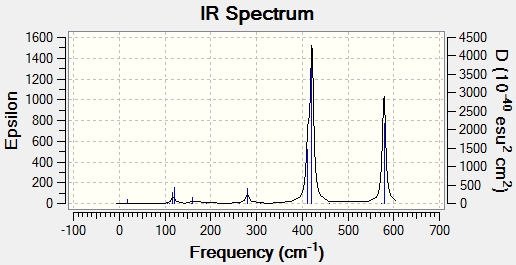
It is certainly clear that the IR spectrum predicted does not necessarily represent all vibrational modes in a resolvable manner. Degenerate modes such as 2 and 3 will, of course, occur at the same frequency, leading to one visible peak for 2 vibrational modes. Another example is shown in this spectrum is the 4th mode, which occurs with an intensity of 0 and therefore is not visible in the spectrum.
Frequency Analysis of TlBr3
File:Log 69286.log DOI:https://spectradspace.lib.imperial.ac.uk:8443/dspace/handle/10042/22592
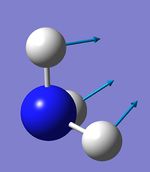
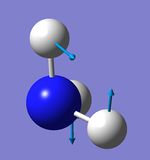
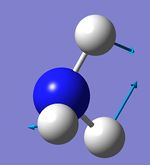
This analysis was performed in the same way, except maintaining the psuedo-potential used to optimise TlBr3. The lowest frequency mode appears at 46.4289 wavenumbers.
 Low frequencies ---   -3.4213   -0.0026   -0.0004    0.0015    3.9367    3.9367
 Low frequencies ---   46.4289   46.4292   52.1449
 Harmonic frequencies (cm**-1), IR intensities (KM/Mole), Raman scattering
 activities (A**4/AMU), depolarization ratios for plane and unpolarized
 incident light, reduced masses (AMU), force constants (mDyne/A),
 and normal coordinates:
                     1                      2                      3
                    E'                     E'                     A2"
 Frequencies --    46.4289                46.4292                52.1449
 Red. masses --    88.4613                88.4613               117.7209
 Frc consts  --     0.1124                 0.1124                 0.1886
 IR Inten    --     3.6867                 3.6867                 5.8466
  Atom  AN      X      Y      Z        X      Y      Z        X      Y      Z
     1  81     0.00   0.28   0.00    -0.28   0.00   0.00     0.00   0.00   0.55
     2  35     0.00   0.26   0.00     0.74   0.00   0.00     0.00   0.00  -0.48
     3  35     0.43  -0.49   0.00    -0.01  -0.43   0.00     0.00   0.00  -0.48
     4  35    -0.43  -0.49   0.00    -0.01   0.43   0.00     0.00   0.00  -0.48
                     4                      5                      6
Comparison of BH3 and TlBr3 Frequencies
Clearly, there is a huge variation in the vibrational modes and IR spectra of the two molecules. This is shown in the table below. This is unsurprising, however, as there is also a big difference in the molecules. Most notable is the huge difference in frequency. The frequency can be seen as an approximate measure of bond strength, for example the frequency of an alkyne will be higher than an alkene. This effect is shown here, the huge difference in bond strengths reflected here. As discussed above, radii are much larger for Tl and Br, leading to longer and weaker bonds resulting from less efficient overlap. Despite the difference in size, however, the same vibrational modes are observed.
| No | BH3 | TlBr3 |
|---|---|---|
| 1 | 1163.00 | 46.43 |
| 2 | 1213.19 | 46.43 |
| 3 | 1213.19 | 52.14 |
| 4 | 2582.26 | 165.27 |
| 5 | 2715.43 | 210.69 |
| 6 | 2715.43 | 210.69 |
MOs
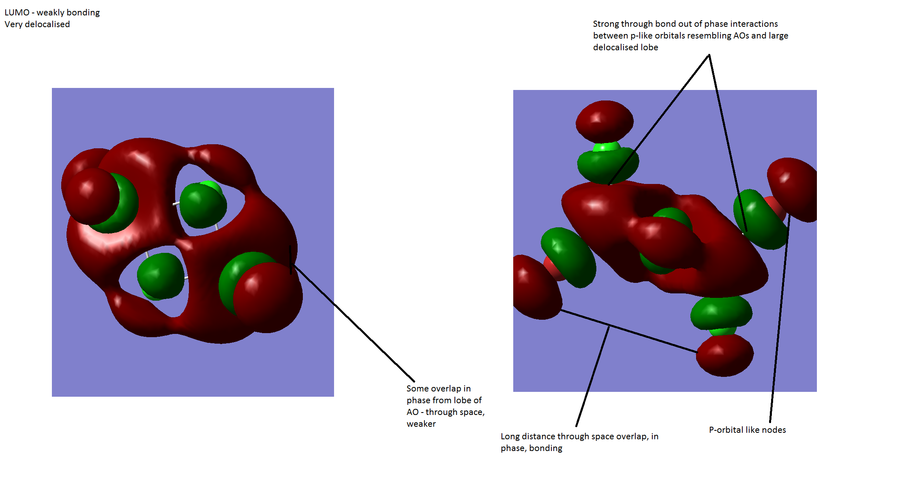
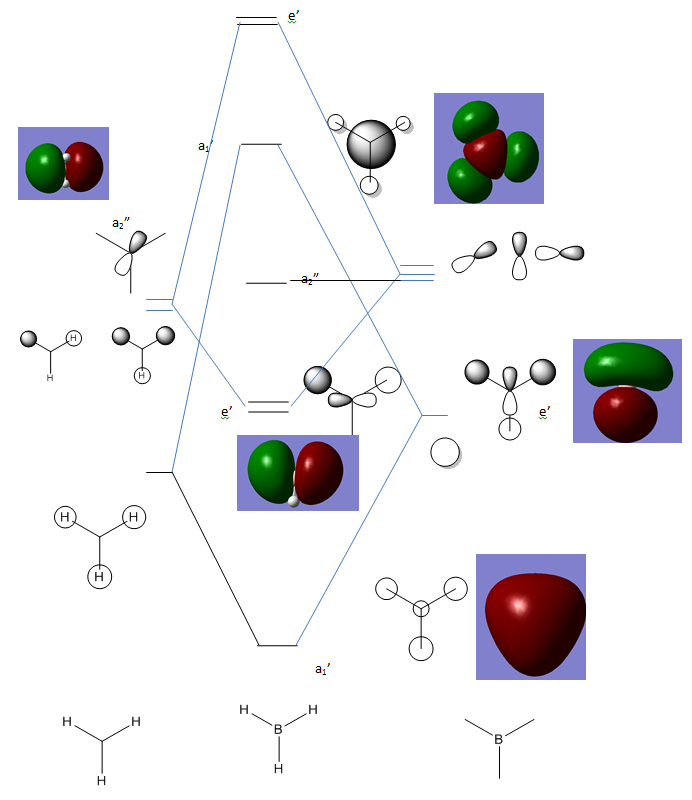
Computationally modelled MO allows comparison with qualitatively generated MOs. It can be seen that all of the MOs generated by qualitatively using LCAO on the B and H3 fragments are also present in the visualisation from Gaussview. This sugggests that the form of the MOs can be quite accurately predicted. The relative energies,however, seem to show less agreement. In the computed version, the A1' anti-bonding orbital is higher in energy than the doubly degenerate E1' antibonding orbitals, while in the qualitative diagram from LCAO the opposite is true.
This suggests that while qualitative modelling may provide a good estimate it has some failings. First of all, it obviously provides no quantitative data about the relative energies and therefore, for example, the band gap, a useful quantity in many areas of chemistry. Its only other downfall is the mismatch in the relative energies of the A1' and E' antibonding levels, in other words, the energy of MOs. It should be noted, however, that in this case and possibly in others, the frontier orbitals are correct, and given the importance of knowledge of frontier orbitals, this suggests that the qualitative method is useful as a rough outline of the form and energy but certainly has its limitations.
NBOs
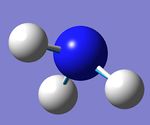
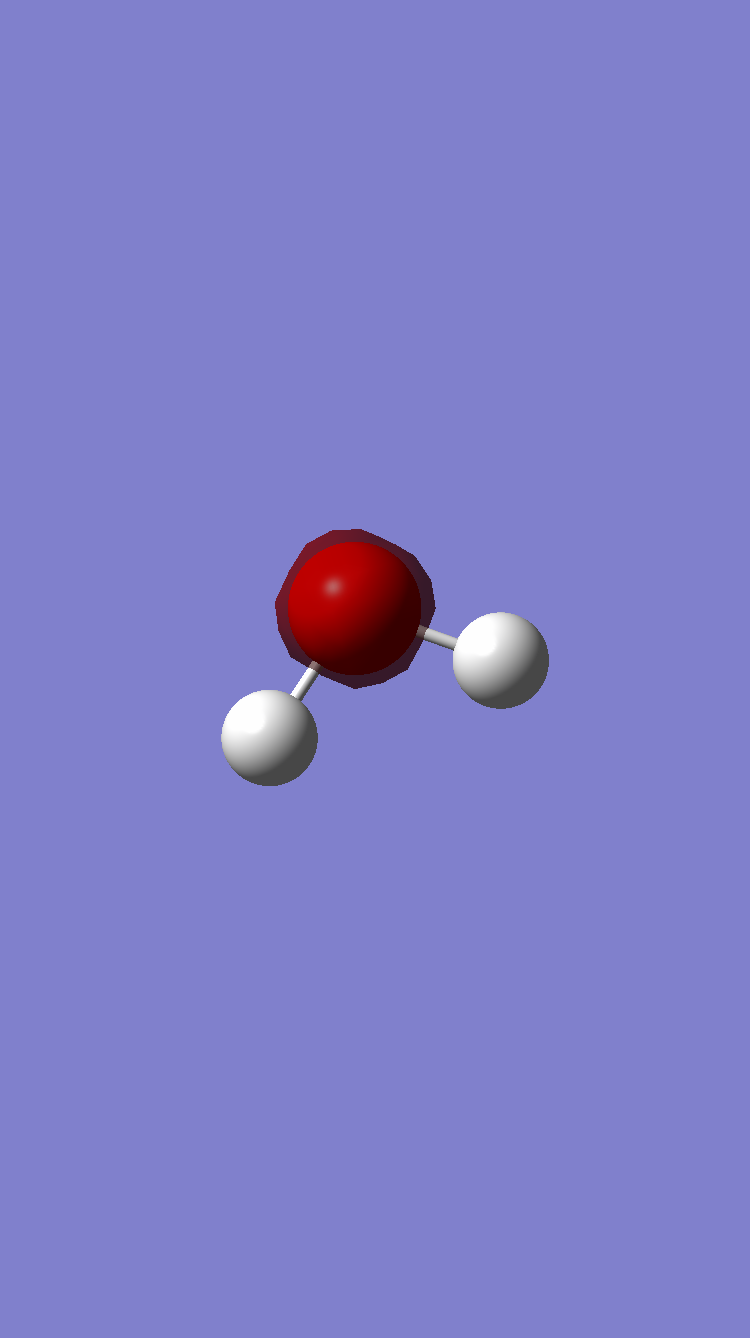
NBO analysis is also a useful tool, and gives a more localised view of the nature of bonding in a molecule. In this case it is performed for ammonia, which belongs to the C3V point group, owing to the lone pair on nitrogen, which results in a distortion of bond angles to give sp3-like hybridisation.
NH3 Optimisation
| Paramater | |
|---|---|
| File Type | .log |
| Calculation Type | FOPT |
| Calculation Method | RB3LYP |
| Basis Set | 6-31G(d,p) |
| Final Energy(au) | -56.55776863 |
| Gradient | 0.00000289 |
| Dipole Moment | 0.0000 |
| Point Group | C3V |
| Calculation Length | 0min 15s |
 Item               Value     Threshold  Converged?
 Maximum Force            0.000005     0.000450     YES
 RMS     Force            0.000003     0.000300     YES
 Maximum Displacement     0.000010     0.001800     YES
 RMS     Displacement     0.000007     0.001200     YES
 Predicted change in Energy=-7.826737D-11
 Optimization completed.
    -- Stationary point found.
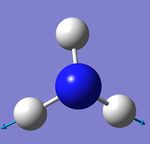
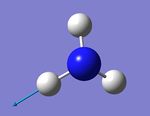
NH3 Frequency Analysis
 Low frequencies ---  -11.6313  -11.5960   -0.0028    0.0243    0.1402   25.5608
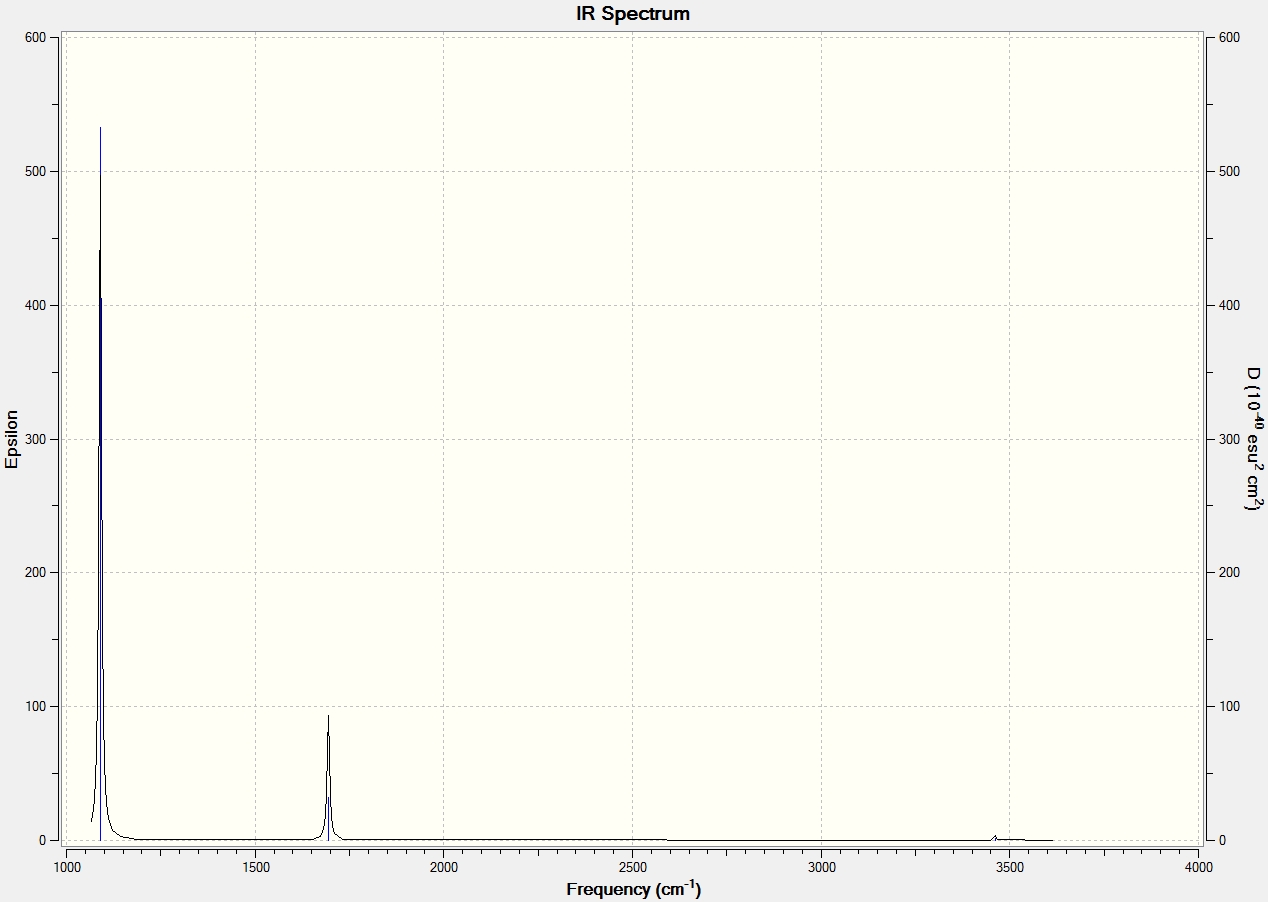
 Low frequencies --- 1089.6620 1694.1733 1694.1736
 Harmonic frequencies (cm**-1), IR intensities (KM/Mole), Raman scattering
 activities (A**4/AMU), depolarization ratios for plane and unpolarized
 incident light, reduced masses (AMU), force constants (mDyne/A),
 and normal coordinates:
                     1                      2                      3
                     A                      E                      E
 Frequencies --  1089.6620              1694.1733              1694.1736
 Red. masses --     1.1800                 1.0644                 1.0644
 Frc consts  --     0.8255                 1.8001                 1.8001
 IR Inten    --   145.4478                13.5570                13.5572
IR Spectrum As with spectra shown above, some modes are masked as a result of degeneracy. It is perhaps notable that only the lowest frequency vibration seems to have a significant intensity, and in fact the higher frequency vibrations are barely observed at all.
NH3 Population Analysis
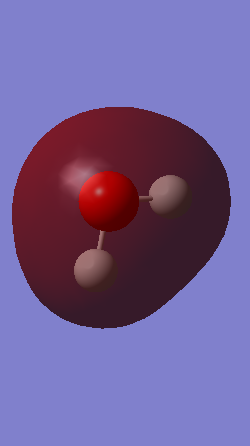
| Atom | Charge |
|---|---|
| N | -1.125 |
| H | +0.375 |
Ammonia-Borane
NH3BH3 is a dative Lewis Acid-Base adduct. It has the potential to be used for Hydrogen storage due to its stability and high Hydrogen content. In order to calculate the bond energy, giving an impression of the strength of the dative bond, the overall energy of the product is compared with that of the reactants, already calculated. The procedure therefore involves optimisation using the same basis set ie. B3LYP, 6-31G (d,p).
Optimisation
Link to log file provided. File:NH3BH3OPT.LOG
B-H Bond Distance: 1.21005 Angstrom N-H Bond Distance: 1.01860 Angstrom B-N Bond Distance: 1.66807 Angstrom
| Paramater | |
|---|---|
| File Type | .log |
| Calculation Type | FOPT |
| Calculation Method | RB3LYP |
| Basis Set | 6-31G (d,p) |
| Final Energy(au) | -83.22468957 |
| Gradient | 0.00005842 |
| Dipole Moment | 5.5651 |
| Point Group | C1 |
| Calculation Length | 1m 37s |
Note the first appearance of a dipole moment. Unlike symmetrical compounds such as Borane, this compound has uneven charge in the B and N atoms. Unsurprisingly, this leads to an overall dipole moment, 5.5651 Debye.
         Item               Value     Threshold  Converged?
 Maximum Force            0.000124     0.000450     YES
 RMS     Force            0.000057     0.000300     YES
 Maximum Displacement     0.000660     0.001800     YES
 RMS     Displacement     0.000304     0.001200     YES
 Predicted change in Energy=-1.649801D-07
 Optimization completed.
    -- Stationary point found.
Frequency Analysis
Low frequencies ---    0.0005    0.0012    0.0013   14.2226   19.8537   46.5810
 Low frequencies ---  267.7174  632.2225  639.1673
 Harmonic frequencies (cm**-1), IR intensities (KM/Mole), Raman scattering
 activities (A**4/AMU), depolarization ratios for plane and unpolarized
 incident light, reduced masses (AMU), force constants (mDyne/A),
 and normal coordinates:
                     1                      2                      3
                     A                      A                      A
 Frequencies --   267.7138               632.2224               639.1673
 Red. masses --     1.0078                 5.0004                 1.0452
 Frc consts  --     0.0426                 1.1776                 0.2516
 IR Inten    --     0.0000                14.0364                 3.5365
  Atom  AN      X      Y      Z        X      Y      Z        X      Y      Z
     1   1    -0.09  -0.35  -0.02     0.03  -0.03   0.29     0.10   0.11  -0.29
     2   1     0.35   0.10   0.00    -0.01   0.01   0.30     0.13   0.08  -0.14
     3   1    -0.26   0.25   0.02    -0.02  -0.04   0.28     0.10   0.03   0.45
     4   1    -0.11  -0.43  -0.03     0.00   0.02  -0.36     0.15   0.15  -0.38
     5   1    -0.32   0.31   0.02     0.00   0.02  -0.37     0.15   0.06   0.58
     6   1     0.43   0.12   0.00     0.00   0.02  -0.35     0.18   0.12  -0.19
     7   5     0.00   0.00   0.00     0.00  -0.03   0.48    -0.02  -0.02   0.00
     8   7     0.00   0.00   0.00     0.00   0.02  -0.36    -0.04  -0.03   0.00
Comparison Of Bond Energies
| Compound | Bond Energy |
|---|---|
| BH3 | -26.61532363 |
| NH3 | -56.55776863 |
| BH3NH3 | -83.22468957 |
Difference(a.u) = 0.05159731 Difference (kJ/mol) = 135.46874772
This provides a reasonable estimate for the relative energy as it gives an overall stable, but relatively weak bond. In a.u., the energy difference between total products and reactants is small, but this still leads to a large energy difference. This is to be expected due to the difference in scale of the units. Error is unfortunately a problem, with 10kJ/mol expected, giving 0.00381 a.u. The weakness of the bond may be due to a more sterically congested structure, it is perhaps notable that the B-H bonds are significantly longer than in Borane.
Lewis Acids and Bases - Main Group Halides - Al2Cl4Br2
It is commonly known for electron deficient molecules, ie Lewis acids such as Borane, to exist preferentially as dimers, with bridging through 3c-2e bonds. A similar phenomenon can be observed with Aluminium halides, but instead occurs via the donation of a lone pair. In this project, I will be analysing the dimer of AlCl2Br. It has four isomers which can be shown directly from the monomers, as well as a possible 5th which could occur after a rearrangement, leaving both bromine atoms bound to one aluminium. It will not be analysed but is pictured below. Each of the remaining isomers has been assigned a number(1-4) for convenience purposes (Table 1). It also also important to carry out similar analysis for the monomer. As such, optimisation calculations will be shown, allowing the determination of the energy of the monomer and, as such, the dissociation energy of the isomers in to 2AlCl2Br.
| Number | Structure | Point Group |
|---|---|---|
| 1 |  |
D2h |
| 2 |  |
C2v |
| 3 |  |
C1 |
| 4 |  |
C2h |
Optimisation and Frequency Analysis
Each molecule is optimised using a mixed basis set. This consists of a full 6-31G (d,p) basis set for Al and Cl and a LanL2DZ pseudopotential for Br. After optimisation, it is necessary to carry out frequency analysis. First of all, this ensures that the stationary point observed is a true minimum and not a transition state or an incomplete optimisation. Secondly, the process allows the generation of IR spectra, which is key to the comparison of these isomers. The results obtained are somewhat unremarkable, but show that the optimisation was successful, as confirmed by frequency analysis. They also lay the foundation for the more analytical sections that fellow.
Monomer
Optimisation
File:Log 69936.log DOI:https://spectradspace.lib.imperial.ac.uk:8443/dspace/handle/10042/22880
Br-Al Bond length - 2.26947 Angstroms
Cl-Al Bond length - 2.08903 Angstroms
| Paramater | |
|---|---|
| File Type | .log |
| Calculation Type | FOPT |
| Calculation Method | RB3LYP |
| Basis Set | Gen |
| Final Energy(au) | -1176.19013679 |
| Gradient | 0.00004196 |
| Dipole Moment | 0.1075 |
| Point Group | C2V |
| Calculation Length | 1min 15s |
         Item               Value     Threshold  Converged?
 Maximum Force            0.000136     0.000450     YES
 RMS     Force            0.000073     0.000300     YES
 Maximum Displacement     0.000681     0.001800     YES
 RMS     Displacement     0.000497     0.001200     YES
 Predicted change in Energy=-7.984431D-08
 Optimization completed.
    -- Stationary point found.
Frequency
File:Monomerfreq.log DOI:https://spectradspace.lib.imperial.ac.uk:8443/dspace/handle/10042/22883
Low frequencies ---   -0.0060   -0.0055   -0.0054    1.3564    3.6363    4.2604
 Low frequencies ---  120.5042  133.9178  185.8950
 Harmonic frequencies (cm**-1), IR intensities (KM/Mole), Raman scattering
 activities (A**4/AMU), depolarization ratios for plane and unpolarized
 incident light, reduced masses (AMU), force constants (mDyne/A),
 and normal coordinates:
                     1                      2                      3
                    B2                     A1                     B1
 Frequencies --   120.5040               133.9178               185.8949
 Red. masses --    37.6456                39.5756                28.4745
 Frc consts  --     0.3221                 0.4182                 0.5798
 IR Inten    --     5.3432                 6.3512                33.1798
Isomer 1
Optimisation
File:Log 69826.log DOI:https://spectradspace.lib.imperial.ac.uk:8443/dspace/handle/10042/22652
Br-Al Bond length - 2.48861 Angstroms Cl-Al Bond length - 2.09345 Angstroms
| Paramater | |
|---|---|
| File Type | .log |
| Calculation Type | FOPT |
| Calculation Method | RB3LYP |
| Basis Set | Gen |
| Final Energy(au) | -2352.40630777 |
| Gradient | 0.00002687 |
| Dipole Moment | 0.0006 |
| Point Group | C1 |
| Calculation Length | 7min 50s |
         Item               Value     Threshold  Converged?
 Maximum Force            0.000049     0.000450     YES
 RMS     Force            0.000022     0.000300     YES
 Maximum Displacement     0.001191     0.001800     YES
 RMS     Displacement     0.000369     0.001200     YES
 Predicted change in Energy=-8.554159D-08
 Optimization completed.
    -- Stationary point found.
Frequency
File:Isomer1freq.log DOI:https://spectradspace.lib.imperial.ac.uk:8443/dspace/handle/10042/22876
 Low frequencies ---   -5.2032   -5.0901   -3.4066   -0.0034   -0.0031   -0.0027
 Low frequencies ---   14.8299   63.2867   86.0786
 Harmonic frequencies (cm**-1), IR intensities (KM/Mole), Raman scattering
 activities (A**4/AMU), depolarization ratios for plane and unpolarized
 incident light, reduced masses (AMU), force constants (mDyne/A),
 and normal coordinates:
                     1                      2                      3
                     A                      A                      A
 Frequencies --    14.8299                63.2867                86.0782
 Red. masses --    41.0125                34.9689                47.7852
 Frc consts  --     0.0053                 0.0825                 0.2086
 IR Inten    --     0.3431                 0.0000                 0.0000
Isomer 2
Optimisation
File:Log 69839.log DOI:https://spectradspace.lib.imperial.ac.uk:8443/dspace/handle/10042/22873
Br-Al Bond length - 2.27461 Angstroms
Cl-Al Terminal Bond length - 2.09387 Angstroms
Al-Cl Bridging Bond Length - 2.29762 Angstroms
| Paramater | |
|---|---|
| File Type | .log |
| Calculation Type | FOPT |
| Calculation Method | RB3LYP |
| Basis Set | Gen |
| Final Energy(au) | -2352.41626672 |
| Gradient | 0.00002065 |
| Dipole Moment | 0.1681 |
| Point Group | C1 |
| Calculation Length | 8min 15s |
        Item               Value     Threshold  Converged?
 Maximum Force            0.000034     0.000450     YES
 RMS     Force            0.000015     0.000300     YES
 Maximum Displacement     0.001154     0.001800     YES
 RMS     Displacement     0.000564     0.001200     YES
 Predicted change in Energy=-2.987395D-08
 Optimization completed.
    -- Stationary point found.
Frequency
File:Isomer2freq.log DOI:https://spectradspace.lib.imperial.ac.uk:8443/dspace/handle/10042/22877
 Low frequencies ---   -4.1515   -2.4250   -0.0040   -0.0028   -0.0017    1.1993
 Low frequencies ---   17.1602   50.9167   78.5535
 Harmonic frequencies (cm**-1), IR intensities (KM/Mole), Raman scattering
 activities (A**4/AMU), depolarization ratios for plane and unpolarized
 incident light, reduced masses (AMU), force constants (mDyne/A),
 and normal coordinates:
                     1                      2                      3
                     A                      A                      A
 Frequencies --    17.1602                50.9167                78.5535
 Red. masses --    51.7096                43.3063                42.3532
 Frc consts  --     0.0090                 0.0661                 0.1540
 IR Inten    --     0.4372                 0.0000                 0.0228
Isomer 3
Optimisation
File:Log 69864.log DOI:https://spectradspace.lib.imperial.ac.uk:8443/dspace/handle/10042/22875
Br-Al Terminal Bond length - 2.27562 Angstroms Al-Br Bridging Bond Length - 2.48682 Angstroms Cl-Al Terminal Bond length - 2.09424 Angstroms Al-Cl Bridging Bond Length - 2.30252 Angstroms
| Paramater | |
|---|---|
| File Type | .log |
| Calculation Type | FOPT |
| Calculation Method | RB3LYP |
| Basis Set | Gen |
| Final Energy(au) | -2352.41109931 |
| Gradient | 0.00003276 |
| Dipole Moment | 0.1390 |
| Point Group | C1 |
| Calculation Length | 21min 23s |
         Item               Value     Threshold  Converged?
 Maximum Force            0.000101     0.000450     YES
 RMS     Force            0.000026     0.000300     YES
 Maximum Displacement     0.001353     0.001800     YES
 RMS     Displacement     0.000596     0.001200     YES
 Predicted change in Energy=-1.133069D-07
 Optimization completed.
    -- Stationary point found.
Frequency
File:Isomer3freq.log DOI:https://spectradspace.lib.imperial.ac.uk:8443/dspace/handle/10042/22878
 Low frequencies ---   -2.9946   -1.4699   -0.0020    0.0022    0.0034    3.0781
 Low frequencies ---   17.0168   55.9574   80.0483
 Harmonic frequencies (cm**-1), IR intensities (KM/Mole), Raman scattering
 activities (A**4/AMU), depolarization ratios for plane and unpolarized
 incident light, reduced masses (AMU), force constants (mDyne/A),
 and normal coordinates:
                     1                      2                      3
                     A                      A                      A
 Frequencies --    17.0132                55.9572                80.0483
 Red. masses --    42.7268                41.0703                42.8125
 Frc consts  --     0.0073                 0.0758                 0.1616
 IR Inten    --     0.3958                 0.0395                 0.1263
Isomer 4
Optimisation
File:Log 69849.log DOI:https://spectradspace.lib.imperial.ac.uk:8443/dspace/handle/10042/22874
Br-Al Bond length - 2.27448 Angstroms Cl-Al Terminal Bond length - 2.09407 Angstroms Al-Cl Bridging Bond Length - 2.29743 Angstroms
| Paramater | |
|---|---|
| File Type | .log |
| Calculation Type | FOPT |
| Calculation Method | RB3LYP |
| Basis Set | Gen |
| Final Energy(au) | -2352.41629799 |
| Gradient | 0.00006766 |
| Dipole Moment | 0.1681 |
| Point Group | C1 |
| Calculation Length | 7min 17s |
        Item               Value     Threshold  Converged?
 Maximum Force            0.000129     0.000450     YES
 RMS     Force            0.000042     0.000300     YES
 Maximum Displacement     0.001681     0.001800     YES
 RMS     Displacement     0.000497     0.001200     YES
 Predicted change in Energy=-2.854912D-07
 Optimization completed.
    -- Stationary point found.
Frequency
File:Isomer4freq.log DOI:https://spectradspace.lib.imperial.ac.uk:8443/dspace/handle/10042/22879
 Low frequencies ---   -4.1413    0.0027    0.0032    0.0034    2.1277    2.4965
 Low frequencies ---   18.2763   49.1263   73.0064
 Harmonic frequencies (cm**-1), IR intensities (KM/Mole), Raman scattering
 activities (A**4/AMU), depolarization ratios for plane and unpolarized
 incident light, reduced masses (AMU), force constants (mDyne/A),
 and normal coordinates:
                     1                      2                      3
                     A                      A                      A
 Frequencies --    18.2760                49.1263                73.0063
 Red. masses --    43.7866                46.9444                52.2086
 Frc consts  --     0.0086                 0.0668                 0.1640
 IR Inten    --     0.4652                 0.0697                 0.0000
Comparison of Energy
Below is a table showing each isomer and its energy in a.u.(Hartree), as well as the relative energy of the isomer compared with the most stable form, which has been converted into kJ/mol to allow comparison and interpretation of values. Also included is the energy of 2 molecules of monomer, which allows the calculation of a dissociation energy for each isomer.
| Number | Energy (a.u) | Relative Energy (kJ/mol) | Dissociation Energy (kJ/Mol) |
|---|---|---|---|
| Monomer x 2 | -2352.3802738 | +94.675510957 | - |
| 1 | -2352.40630777 | +26.229324608 | 68.446186349 |
| 2 | -2352.41626672 | +0.082099391254 | 94.593411565746 |
| 3 | -2352.41109931 | +13.64913538 | 81.026375577 |
| 4 | -2352.41629799 | 0 | 94.675510957 |
These data prove very useful in understanding the system, and what may contribute to its stability. The AlCl2Br monomer is, of course, a Lewis acid. This accounts for much of its reactivity, as Al has 6 valence electrons and hence the compound is electron deficient. Dimerisation is a method of decreasing its electron deficiency. This occurs via sigma donation of a halide lone pair into a vacant sp3 orbital. As clearly shown by the data, this is a favourable process, in other words, the dimer is more thermodynamically stable than the isolated monomers. It should be noted, however, that its dissociation energy is relatively low, suggesting that the dimer may still be reactive. Another, equally important, aspect is the comparison of the relative stability of each isomer. This seems to be determined by the position of the bromine atoms in the structure. The least stable isomer has both bromine atoms in bridging positions, and the most stable isomer has 2 terminal bromine atoms.
Moreover, it is clear that is less favourable to have bromine in a bridging position. Two possible explanations come from electronic and steric factors. Bromine atoms are much larger than aluminium or chlorine atoms. This means that the bonds it forms will be longer and therefore weaker, as a consequence of inferior orbital overlap caused by the disparity in size. Furthermore, bromine's orbitals have more smeared out electron density as a result of their size. This means that the stabilising interaction, ie., donation into the sp3 orbital on aluminium is less favourable than it would be with chlorine in a bridging position. The other reason is the steric demand related to putting 2 large atoms so close together without conformational freedom. One part of the evidence which suggests this is the difference in energy between isomers 2 and 4. There is a small barier(< 1kJ/mol), which means interconversion is possible and practically inevitable in any system with significant thermal energy. As such, this may be related to error. Inspection of the structures, however, shows that isomer 2 contains both bromines in a cis-like conformation, while isomer 4 is in a trans-like conformation. This implies that a steric effect is possible, as the most stable isomer has the bromine atoms in the most seperated positions possible.
IR Spectra
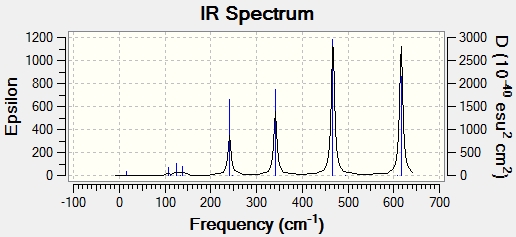
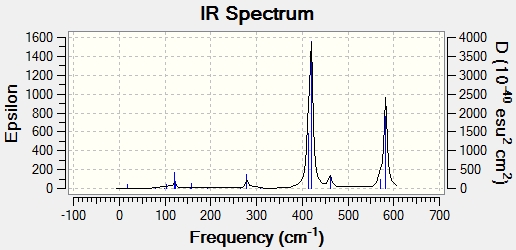
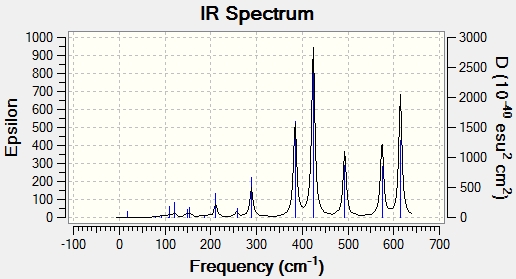
IR spectra were computed using the frequency calculations shown above. In some ways, these spectra are more comprehensive and laden with useful data than experimental spectra. Firstly, unambiguous assignment of peaks to molecular vibrations is possible, as the Gaussview interface shows them. Furthermore, it is likely that there will be more peaks present because some of the molecule's vibrations may not be IR active. An IR active vibration is one which changes the dipole moment of the molecule. It should perhaps be noted that there are more active vibrations in these isomers than the molecules analysed before, and this may be because the isomers are more polarised. The idea of IR active vibrations as those which change the dipole moment of the molecule also explains the relative abundance or lack of bands in some spectra. It should be noted, however, that all molecules have the same number of atoms and therefore vibrational degrees of freedom. As such, every isomer has 18 vibrational modes, but not all of them have any significant intensity.
Isomer 1
| Vibration | Frequency (cm-1) | Intensity |
|---|---|---|
| Wagging | 108 | 5 |
| Scissoring | 126 | 8 |
| Rocking | 138 | 7 |
| Br-Al Symmetric Stretch | 241 | 97 |
| Br-Al Asymmetric Stretch | 341 | 161 |
| Cl-Al Symmetric Stretch | 467 | 347 |
| Cl-Al Asymmetric Stretch | 616 | 332 |
Isomer 2
| Vibration | Frequency (cm-1) | Intensity |
|---|---|---|
| Rocking | 121 | 13 |
| Al-Cl Bridging Symmetric Stretch | 279 | 25 |
| Al-Cl Bridging Asymmetric Stretch | 413 | 150 |
| Al-Cl/Br Symmetric Stretch | 420 | 410 |
| Al-Cl/Br Asymmetric Stretch | 582 | 278 |
Isomer 3
| Vibration | Frequency (cm-1) | Intensity |
|---|---|---|
| Scissoring | 121 | 8 |
| Bridging Al-Br Symmetric Stretch | 211 | 21 |
| Bridging Al-Cl Asymmetric Stretch | 289 | 48 |
| Bridging Al-Br Asymmetric Stretch | 384 | 154 |
| Al-Br Terminal Symmetric Stretch | 424 | 274 |
| Al-Cl Terminal Symmetric Stretch | 493 | 107 |
| Al-Br Terminal Asymmetric Stretch | 574 | 122 |
| Al-Cl Terminal Asymmetric Stretch | 615 | 197 |
Isomer 4
| Vibration | Frequency (cm-1) | Intensity |
|---|---|---|
| Scissoring | 120 | 13 |
| Al-Cl Bridging Symmetric Stretch | 280 | 29 |
| Al-Cl Bridging Asymmetric Stretch | 412 | 152 |
| Al-Cl/Br Symmetric Stretch | 421 | 436 |
| Al-Cl/Br Asymmetric Stretch | 579 | 316 |
Al-Br Bond Stretching
| Number | Frequency (cm-1) | Intensity |
|---|---|---|
| 1 (Symmetric) | 241 | 976 |
| 1 (Asymmetric) | 341 | 161 |
| 2 (Symmetric) | 420 | 410 |
| 2 (Asymmetric) | 582 | 278 |
| 3 (Symmetric) | 211 (bridging), 424(terminal) | 21(bridging), 274 (terminal) |
| 3 (Asymmetric) | 384(bridging), 574(terminal) | 154(bridging), 122(terminal) |
| 4 (Symmetric) | 421 | 436 |
| 4 (Asymmetric) | 579 | 316 |
Based on these data, there seems to be a very established frequency range for each vibrational mode. Unsurprisingly, terminal and bridging bromine atoms are in very different environments and as such have very distinct peaks. Bridging bromine atoms are present in isomers 1 and 3. The Br bonds are both longer and weaker in this environment and this is manifested in lower frequencies. Isomer 1 has the fewest active vibrational modes because of the high symmetry of the molecule. Its higher intensity than the corresponding virbation in 3 may be due to 2 bromine atoms or perhaps a greater effect on the dipole of the molecule. Conversely, in isomer 3, only 1 bridging Br is present along with 1 terminal. This leads to a molecule with C1 symmetry. This lack of symmetry means that is more likely that a vibrational mode will change the dipole moment and therefore gives more active peaks on the spectrum. The frequency in 3 is also higher. This may be due to the different environment, with only one bridging Bromine atom, although it only changes the bond length by around 0.02 Angstroms. Terminal bromine atoms are observed in 2,3 and 4. These vibrational modes have a symmetric frequency between 400 and 500 cm-1 and an asymmetric of just under 600-1. The higher frequency may be due to the different bond length and stability, with around 0.2 Angstroms between terminal and bridging bond lengths. Thus, a higher frequency vibration fits with expectation and the Badger's rule. The difference in intensity between isomers is interesting to note. this may be due to fewer Br atoms in the environment leading to a weaker absorption. A more likely explanation comes from symmetry. As more symmetrical molecules, the dipole moment is more offset by active vibrations which temporarily alter the symmetry of the molecule. Isomers 2 and 4 have a similar amount of symmetry elements, but crucially belong to different point groups. While there is significant similarities between the spectra and indeed the structure, this variation intensity may be due to the differing position of the bromine atoms and therefore different alteration of dipole moment. Isomer 3, on the other hand, has completely different symmetry and has no symmetry elements which leave the molecule unchanged. This means that it has a high number of active peaks. It would appear, however, that many of these vibrations do not give large intensity.
MOs of Isomer 4
File:Isomer4MOs.fchk DOI:https://spectradspace.lib.imperial.ac.uk:8443/dspace/handle/10042/22888
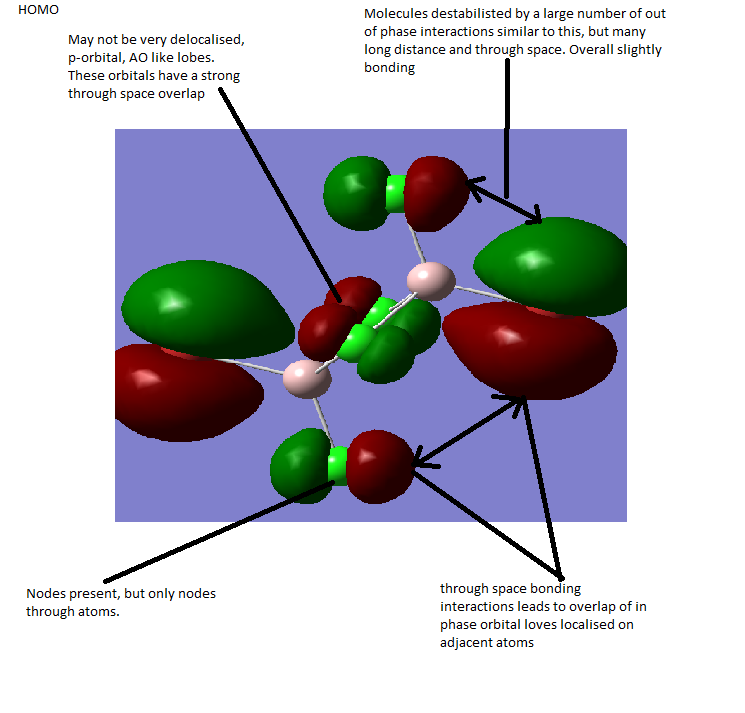
MOs become progressively more antibonding going down the page.

