Rep:Mod:XYZ2025
Week 1: Understanding Computational Chemistry
BH3
Optimisation - low level basis set
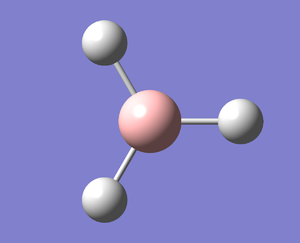
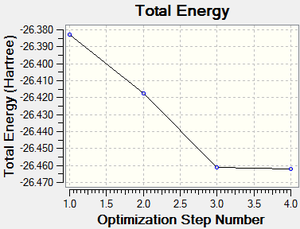
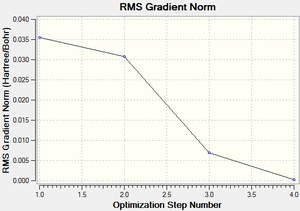
A molecule of BH3 was created and optimised in Gaussview, a program which uses different approximations to solve the Schrodinger equation. A low level basis set (3-21G) was first employed to ensure the structure was roughly correct. The output log file of this optimisation is linked here and a Gaussview image of the optimised molecule is shown in Figure 1.
The optimised molecule was reproduced as a Java file and can be opened by clicking on the Molecule 1 button:
The summary table below shows the important information about the calculation:
| BH3_AVC | ||
|---|---|---|
| File Type | .log | |
| Calculation Type | FOPT | |
| Calculation Method | RB3LYP | |
| Basis Set | 3-21G | |
| Charge | 0 | |
| Spin | Singlet | |
| Total energy | -26.46226347 a.u. | |
| RMS Gradient Norm | 0.00020667 a.u. | |
| Imaginary Freq | ||
| Dipole Moment | 0.0000 Debye | |
| Point Group | C1 | |
| Calculation Time | 10.0 seconds | |
| Optimised B-H Bond Distance | 1.19349 Angstrom | |
| Optimised H-B-H Bond Angle | 119.999 degrees | |
The total energy curve (Figure 2) shows the program moving along the potential energy surface (PES) of the BH3 molecule and finding the minimum energy structure.
The RMS (root mean square) gradient curve (Figure 3) shows that the gradient goes to zero as the minimum is approached.
The information below, extracted from the output log file, shows that the job has converged and the optimisation was successful.
 Item                     Value        Threshold  Converged?
 Maximum Force            0.000415     0.000450     YES
 RMS     Force            0.000271     0.000300     YES
 Maximum Displacement     0.001614     0.001800     YES
 RMS     Displacement     0.001054     0.001200     YES
 Predicted change in Energy=-1.071259D-06
 Optimization completed.
    -- Stationary point found.
                           ----------------------------
                           !   Optimized Parameters   !
                           ! (Angstroms and Degrees)  !
 --------------------------                            --------------------------
 ! Name  Definition              Value          Derivative Info.                !
 --------------------------------------------------------------------------------
 ! R1    R(1,2)                  1.1935         -DE/DX =    0.0004              !
 ! R2    R(1,3)                  1.1935         -DE/DX =    0.0004              !
 ! R3    R(1,4)                  1.1935         -DE/DX =    0.0004              !
 ! A1    A(2,1,3)              120.0007         -DE/DX =    0.0                 !
 ! A2    A(2,1,4)              120.0006         -DE/DX =    0.0                 !
 ! A3    A(3,1,4)              119.9987         -DE/DX =    0.0                 !
 ! D1    D(2,1,4,3)           -180.0            -DE/DX =    0.0                 !
 --------------------------------------------------------------------------------
 GradGradGradGradGradGradGradGradGradGradGradGradGradGradGradGradGradGrad
Optimisation - high level basis set
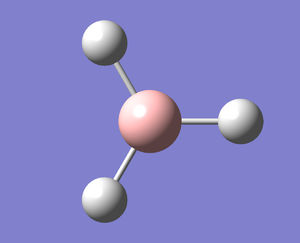
Following the successful optimisation of the BH3 molecule with a low level basis set, a new optimisation was carried out using a higher level basis set. The output log file is linked here and a Gaussview image of the optimised molecule is shown in Figure 4.
The optimised molecule was reproduced as a Java file and can be opened by clicking on the Molecule 2 button:
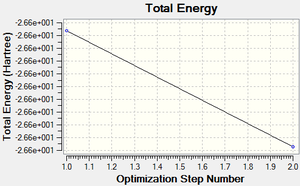
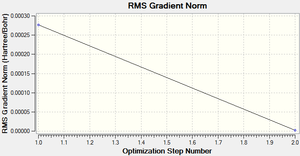
The total energy and gradient curves for the optimised BH3 molecule are both linear and are shown in Figures 5 and 6, respectively.
The summary table below shows all the important information about the calculation.
| BH3_631G_AVC | ||
|---|---|---|
| File Type | .log | |
| Calculation Type | FOPT | |
| Calculation Method | RB3LYP | |
| Basis Set | 6-31G(d,p) | |
| Charge | 0 | |
| Spin | Singlet | |
| Total energy | -26.61532374 a.u. | |
| RMS Gradient Norm | 0.00000237 a.u. | |
| Imaginary Freq | ||
| Dipole Moment | 0.0000 Debye | |
| Point Group | CS | |
| Calculation Time | 6.0 seconds | |
| Optimised B-H Bond Distance | 1.19232 Angstrom | |
| Optimised H-B-H Bond Angle | 119.999 degrees | |
The information below, extracted from the output log file, shows that the job has converged and the optimisation was successful.
 Item                     Value        Threshold  Converged?
 Maximum Force            0.000005     0.000450     YES
 RMS     Force            0.000003     0.000300     YES
 Maximum Displacement     0.000018     0.001800     YES
 RMS     Displacement     0.000012     0.001200     YES
 Predicted change in Energy=-1.321559D-10
 Optimization completed.
    -- Stationary point found.
                           ----------------------------
                           !   Optimized Parameters   !
                           ! (Angstroms and Degrees)  !
 --------------------------                            --------------------------
 ! Name  Definition              Value          Derivative Info.                !
 --------------------------------------------------------------------------------
 ! R1    R(1,2)                  1.1923         -DE/DX =    0.0                 !
 ! R2    R(1,3)                  1.1923         -DE/DX =    0.0                 !
 ! R3    R(1,4)                  1.1923         -DE/DX =    0.0                 !
 ! A1    A(2,1,3)              120.0005         -DE/DX =    0.0                 !
 ! A2    A(2,1,4)              120.0005         -DE/DX =    0.0                 !
 ! A3    A(3,1,4)              119.999          -DE/DX =    0.0                 !
 ! D1    D(2,1,4,3)            180.0            -DE/DX =    0.0                 !
 --------------------------------------------------------------------------------
 GradGradGradGradGradGradGradGradGradGradGradGradGradGradGradGradGradGrad
Frequency analysis
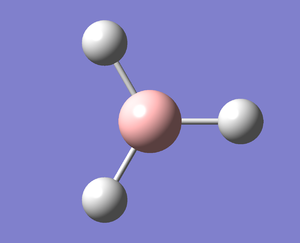
Frequency analysis was carried out on the fully optimised (6-31G(d,p)) structure to confirm the minimum energy structures. The output log file is linked here and the Gaussview image of the molecule is shown in Figure 7.
The optimised molecule was reproduced as a Java file and can be opened by clicking on the Molecule 3 button:
The summary table below shows all the important information about the calculation. As you can see, the total energy is the same as that recorded for the optimisation.
| BH3_FREQ_AVC | ||
|---|---|---|
| File Type | .log | |
| Calculation Type | FREQ | |
| Calculation Method | RB3LYP | |
| Basis Set | 6-31G(d,p) | |
| Charge | 0 | |
| Spin | Singlet | |
| Total energy | -26.61532374 a.u. | |
| RMS Gradient Norm | 0.00000242 a.u. | |
| Imaginary Freq | 0 | |
| Dipole Moment | 0.0000 Debye | |
| Point Group | C2V | |
| Calculation Time | 8.0 seconds | |
| Optimised B-H Bond Distance | 1.19232 Angstrom | |
| Optimised H-B-H Bond Angle | 120.001 degrees | |
The information below, extracted from the output log file, shows that the job has converged and the optimisation was successful.
 Item                     Value        Threshold  Converged?
 Maximum Force            0.000005     0.000450     YES
 RMS     Force            0.000002     0.000300     YES
 Maximum Displacement     0.000020     0.001800     YES
 RMS     Displacement     0.000010     0.001200     YES
 Predicted change in Energy=-1.384885D-10
 Optimization completed.
    -- Stationary point found.
 GradGradGradGradGradGradGradGradGradGradGradGradGradGradGradGradGradGrad
The output log file also shows the important frequencies of the calculation (see below).
 Low frequencies ---  -18.7412    0.0007    0.0007    0.0008   12.4957   12.6461
 Low frequencies --- 1162.9784 1213.1790 1213.2325
The better the method employed, the closer to zero these frequencies will be. Ideally, these should be within plus/minus 15 cm-1.
Animating vibrations
Using the completed frequency analysis for BH3, the vibrations of the molecule were explored in Gaussview. The six distinct vibrations of BH3 are summarised in the table below:
| No. | Vibration | Description | Frequency (cm-1) | Intensity | Symmetry of Point Group |
|---|---|---|---|---|---|
| 1 | View animation 1 | The three H atoms move up and down, and the B atom moves up and down in the opposite direction. | 1162.98 | 92.5514 | A2 |
| 2 | View animation 2 | Two H atoms move in the plane towards and away from each other, and this pushes the B and remaining H atom away and back to the original position. | 1213.18 | 14.0573 | E' |
| 3 | View animation 3 | Two H atoms move in the plane towards and away from each other, whilst the other H atom vibrates left and right independently. | 1213.23 | 14.0607 | E' |
| 4 | View animation 4 | The three H atoms move simultaneously along the bond towards the B atom, which remains stationary. | 2582.26 | 0.0000 | A1' |
| 5 | View animation 5 | Two H atoms move in and out along the bond towards the B atom, in a non-concerted manner. The other H remains stationary. | 2715.41 | 126.3292 | E' |
| 6 | View animation 6 | Two H atoms move unanimously in and out along the bond towards the B, whilst the other H moves with the same motion but not simultaneously with the 2 other H atoms. The B atom remains stationary. | 2715.45 | 126.3228 | E' |
The infrared spectrum of BH3, obtained from frequency analysis, is shown below in Figure 8.
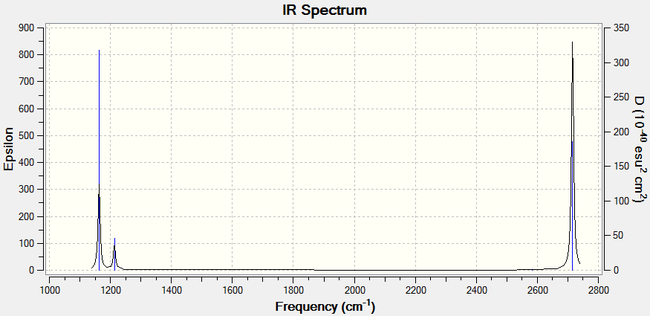
The infrared spectrum only shows four peaks, whereas six distinct peaks are expected since there are six different vibrations. The reason for this is that some peaks have similar frequencies, which are superimposed and therefore appear overlapped as a single peak.
Population analysis
The molecular orbitals of BH3 were obtained using the fully optimised molecule (6-31G). The output log file is linked here and the link to the D-space file is http://dx.doi.org/10042/23263. An MO diagram of the trigonal planar molecule was created in ChemDraw. The LCAOs for each energy level were included, as well as a snap-shot of the "real" MOs obtained in Gaussview. The completed MO diagram is shown below:
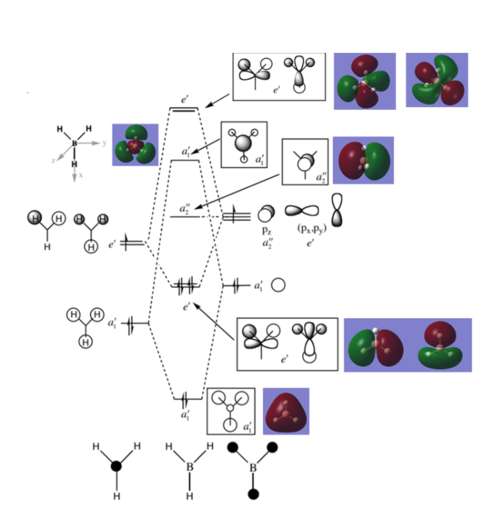
The "real" computed MOs are very similar to the LCAOs. However, the unoccupied orbitals are more diffuse than the occupied orbitals and this can result in unexpected shapes. It can therefore be proposed that qualitative MO theory is accurate for occupied and low-energy unoccupied orbitals, but becomes less useful for higher energy unoccupied orbitals because they are more diffuse.
TlBr3
Optimisation
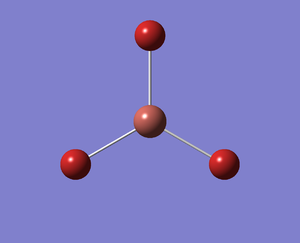
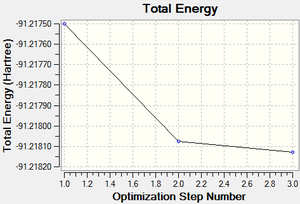
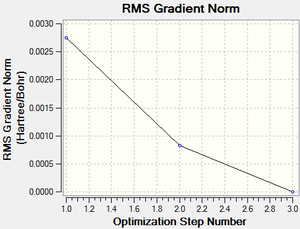
The optimisation of TlBr3 was carried out on the HPC using pseudo-potentials.
The output log file is linked to here and the link to the D-space file is http://dx.doi.org/10042/23012. A Gaussview image of the optimised molecule is shown in Figure 9. The total energy and gradient curves of the TlBr3 molecule are shown in Figures 10 and 11, respectively.
The optimised molecule was reproduced as a Java file and can be opened by clicking on the Molecule 4 button:
The summary table below shows all the important information about the calculation.
| TLBR3_AVC | ||
|---|---|---|
| File Type | .log | |
| Calculation Type | FOPT | |
| Calculation Method | RB3LYP | |
| Basis Set | LANL2DZ | |
| Charge | 0 | |
| Spin | Singlet | |
| Total energy | -91.21812851 a.u. | |
| RMS Gradient Norm | 0.00000090 a.u. | |
| Imaginary Freq | ||
| Dipole Moment | 0.0000 Debye | |
| Point Group | D3H | |
| Calculation Time | 48.8 seconds | |
| Optimised Tl-Br Bond Distance | 2.65095 Angstrom | |
| Optimised Br-Tl-Br Bond Angle | 120.000 degrees | |
The observed Tl-Br bond length is slightly longer than the literature value of 2.5122 Angstrom.[1]
- ↑ J. Glaser and G. Johansson. Acta. Chem. Scand. A. 1982, 36: 125-135.
The information below, extracted from the output log file, shows that the job has converged and the optimisation was successful.
 Item                     Value        Threshold  Converged?
 Maximum Force            0.000002     0.000450     YES
 RMS     Force            0.000001     0.000300     YES
 Maximum Displacement     0.000022     0.001800     YES
 RMS     Displacement     0.000014     0.001200     YES
 Predicted change in Energy=-6.084065D-11
 Optimization completed.
    -- Stationary point found.
                           ----------------------------
                           !   Optimized Parameters   !
                           ! (Angstroms and Degrees)  !
 --------------------------                            --------------------------
 ! Name  Definition              Value          Derivative Info.                !
 --------------------------------------------------------------------------------
 ! R1    R(1,2)                  2.651          -DE/DX =    0.0                 !
 ! R2    R(1,3)                  2.651          -DE/DX =    0.0                 !
 ! R3    R(1,4)                  2.651          -DE/DX =    0.0                 !
 ! A1    A(2,1,3)              120.0            -DE/DX =    0.0                 !
 ! A2    A(2,1,4)              120.0            -DE/DX =    0.0                 !
 ! A3    A(3,1,4)              120.0            -DE/DX =    0.0                 !
 ! D1    D(2,1,4,3)            180.0            -DE/DX =    0.0                 !
 --------------------------------------------------------------------------------
 GradGradGradGradGradGradGradGradGradGradGradGradGradGradGradGradGradGrad
Frequency analysis
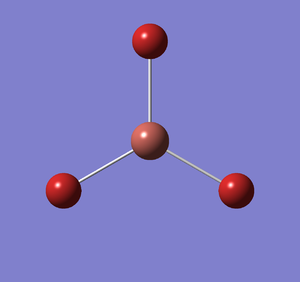
Frequency analysis was carried out on the fully optimised TlBr3 structure to confirm the minimum energy structures. The output log file is linked here and the link to the D-space file is http://dx.doi.org/10042/23204. A Gaussview image of the molecule is shown in Figure 12.
The optimised molecule was reproduced as a Java file and can be opened by clicking on the Molecule 5 button:
The summary table below shows all the important information about the calculation. As you can see, the total energy is the same as that recorded for the optimisation.
| TLBR3_FREQ_AVC | ||
|---|---|---|
| File Type | .log | |
| Calculation Type | FREQ | |
| Calculation Method | RB3LYP | |
| Basis Set | LANL2DZ | |
| Charge | 0 | |
| Spin | Singlet | |
| Total energy | -91.21812851 a.u. | |
| RMS Gradient Norm | 0.00000088 a.u. | |
| Imaginary Freq | 0 | |
| Dipole Moment | 0.0000 Debye | |
| Point Group | D3H | |
| Calculation Time | 28.2 seconds | |
| Optimised Tl-Br Bond Distance | 2.65095 Angstrom | |
| Optimised Br-Tl-Br Bond Angle | 120.000 degrees | |
The information below, extracted from the output log file, shows that the job has converged and the optimisation was successful.
 Item                     Value        Threshold  Converged?
 Maximum Force            0.000002     0.000450     YES
 RMS     Force            0.000001     0.000300     YES
 Maximum Displacement     0.000022     0.001800     YES
 RMS     Displacement     0.000011     0.001200     YES
 Predicted change in Energy=-5.660901D-11
 Optimization completed.
    -- Stationary point found.
 GradGradGradGradGradGradGradGradGradGradGradGradGradGradGradGradGradGrad
The output log file also shows the important frequencies of the calculation (see below).
 Low frequencies ---   -3.4213   -0.0026   -0.0004    0.0015    3.9367    3.9367
 Low frequencies ---   46.4289   46.4292   52.1449
The lowest "real" normal mode is -3.4213cm-1 and the highest is 3.9367cm-1.
The infrared spectrum of TlBr3, obtained from frequency analysis, is shown below in Figure 13.
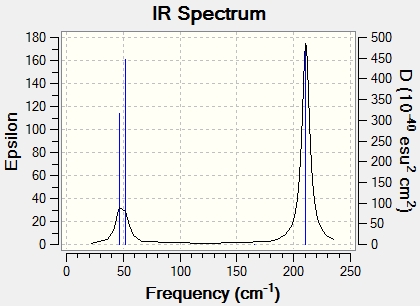
As with the BH3 molecule, the infrared spectrum only shows four peaks, whereas six distinct peaks are expected for the six different vibrations. The reason for this is that some peaks have similar frequencies, which are superimposed and therefore appear overlapped as one single peak.
BBr3
Optimisation
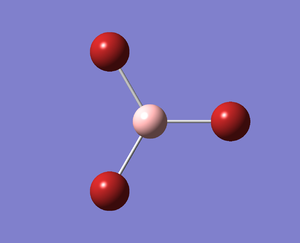
A molecule of BBr3 was created from the fully optimised BH3 (6-31G(d,p)) molecule. It was then optimised, with the calculation being carried out on the HPC using psuedo-potentials. The output log file is linked to here and the link to the D-space file is http://dx.doi.org/10042/23205. A Gaussview image of the optimised molecule is shown in Figure 14.
The optimised molecule was reproduced as a Java file and can be opened by clicking on the Molecule 6 button:
The summary table below shows all the important information about the calculation.
| BBR3_631G_AVC | ||
|---|---|---|
| File Type | .log | |
| Calculation Type | FOPT | |
| Calculation Method | RB3LYP | |
| Basis Set | Gen | |
| Charge | 0 | |
| Spin | Singlet | |
| Total energy | -64.43645277 a.u. | |
| RMS Gradient Norm | 0.00000383 a.u. | |
| Imaginary Freq | ||
| Dipole Moment | 0.0002 Debye | |
| Point Group | CS | |
| Calculation Time | 40.5 seconds | |
| Optimised B-Br Bond Distance | 1.93397 Angstrom | |
| Optimised Br-B-Br Bond Angle | 119.996 degrees | |
The information below, extracted from the output log file, shows that the job has converged and the optimisation was successful.
 Item                     Value        Threshold  Converged?
 Maximum Force            0.000008     0.000450     YES
 RMS     Force            0.000005     0.000300     YES
 Maximum Displacement     0.000036     0.001800     YES
 RMS     Displacement     0.000024     0.001200     YES
 Predicted change in Energy=-4.079985D-10
 Optimization completed.
    -- Stationary point found.
                           ----------------------------
                           !   Optimized Parameters   !
                           ! (Angstroms and Degrees)  !
 --------------------------                            --------------------------
 ! Name  Definition              Value          Derivative Info.                !
 --------------------------------------------------------------------------------
 ! R1    R(1,2)                  1.934          -DE/DX =    0.0                 !
 ! R2    R(1,3)                  1.9339         -DE/DX =    0.0                 !
 ! R3    R(1,4)                  1.934          -DE/DX =    0.0                 !
 ! A1    A(2,1,3)              120.0022         -DE/DX =    0.0                 !
 ! A2    A(2,1,4)              119.9955         -DE/DX =    0.0                 !
 ! A3    A(3,1,4)              120.0022         -DE/DX =    0.0                 !
 ! D1    D(2,1,4,3)            180.0            -DE/DX =    0.0                 !
 --------------------------------------------------------------------------------
 GradGradGradGradGradGradGradGradGradGradGradGradGradGradGradGradGradGrad
Analysis of bond distance - BH3, BBr3 and TlBr3
The table below shows the bond distances for the three molecules that have been optimised so far:
| Molecule | Bond distance (Angstrom) |
|---|---|
| BH3 | 1.19232 |
| BBr3 | 1.93397 |
| TlBr3 | 2.65095 |
As observed in BH3 and BBr3, changing the ligand has a large effect on bond length, and the larger the ligand, the longer the bond length. H and Br are similar because both atoms require one more electron to complete their valence electron shells. The difference between H and Br is that Br is a highly electronegative atom whereas H is not. Br is a much more electron-rich atom, which means it will undergo stronger electronic repulsion and result in a longer bond length.
As observed in BBr3 and TlBr3, changing the central element has a profound effect on the bond length. Both B and Tl are in Group 13 of the Periodic table, which means they have 3 electrons in their outer shell. The difference between them is that Tl is a very large, heavy atom whereas B is very light. The larger the central atom, the greater the repulsion and the longer the bond length.
A bond can be described as a mutual attraction between two atoms, resulting in the formation of a molecule. The type of attraction can be distinguished by the organisation of valence electrons (i.e. covalent, ionic or metallic bonds).
In some structures, Gaussview does not draw bonds as expected. This is because the distance between the atoms exceeds a predefined value and, since bonds are used as a structural convenience for visualisation, they are not drawn in Gaussview.
Analysis of vibrations - BH3 and TlBr3
The table in section 1.1.4 describes the six different vibrations of BH3. Using the frequency analysis in section 1.2.2, the different vibrations of TlBr3 were explored and compared to BH3, as shown in the table below:
| No. | BH3 | TlBr3 | ||||||||
|---|---|---|---|---|---|---|---|---|---|---|
| Vibration | Description | Frequency (cm-1) | Intensity | Symmetry of Point Group | Vibration | Description | Frequency (cm-1) | Intensity | Symmetry of Point Group | |
| 1 | View animation 1 | The three H atoms move up and down together, and the B atom moves up and down in the opposite direction. | 1162.98 | 92.5514 | A2 | View animation 1 | Two Br atoms move in the plane towards and away from each other, and this pushes the Tl and remaining Br atom further away and then back to the original position. | 46.43 | 3.6867 | E' |
| 2 | View animation 2 | Two H atoms move in the plane towards and away from each other, and this pushes the B and remaining H atom further away and then back to the original position. | 1213.18 | 14.0573 | E' | View animation 2 | Two Br atoms move in the plane towards and away from each other, whilst the other Br atom vibrates left and right independently. | 46.43 | 3.6867 | E' |
| 3 | View animation 3 | Two H atoms move in the plane towards and away from each other, whilst the other H atom vibrates left and right independently. | 1213.23 | 14.0607 | E' | View animation 3 | The three Br atoms move up and down together, and the Tl atom moves up and down in the opposite direction. | 52.14 | 5.8466 | A2 |
| 4 | View animation 4 | The three H atoms move simultaneously along the bond towards the B atom, which remains stationary. | 2582.26 | 0.0000 | A1' | View animation 4 | The three Br atoms move simultaneously along the bond towards the Tl atom, which remains stationary. | 165.27 | 0.0000 | A1' |
| 5 | View animation 5 | Two H atoms move in and out along the bond towards the B atom, in a non-concerted manner. The other H remains stationary. | 2715.41 | 126.3292 | E' | View animation 5 | Two Br atoms move in and out along the bond towards the Tl atom, in a non-concerted manner. The other Br remains stationary. | 210.69 | 25.4830 | E' |
| 6 | View animation 6 | Two H atoms move unanimously in and out along the bond towards the B, whilst the other H moves with the same motion but not simultaneously with the 2 other H atoms. The B atom remains stationary. | 2715.45 | 126.3228 | E' | View animation 6 | Two Br atoms move unanimously in and out along the bond towards the Tl, whilst the other Br moves with the same motion but not simultaneously with the 2 other Br atoms. The Tl atom remains stationary. | 210.69 | 25.4797 | E' |
There is a large difference between the frequencies of BH3 and TlBr3. The Br atom has a higher moment of inertia because the molecule is larger and heavier. This results in fewer vibrations and a lower frequency for TlBr3. This also means that TlBr3 is less susceptible to changing vibrations than BH3 and therefore the range of frequencies is much smaller.
There has been a reordering of modes in the first three vibrations, because they are different for both BH3 and TlBr3. However, vibrations 3-6 are the same for both molecules.
The infrared spectra for BH3 and TlBr3 are similar because some of the vibrations overlap, resulting in only some distinct peaks. Also, there is a large difference in frequency between the lowest two peaks, representing the A2 and E' modes, and the highest peaks, representing the A1' and E' modes. The reason for this is strong repulsion between atoms in the molecules, which increases the energy and therefore the frequency of vibrations.
When carrying out optimisation and frequency analysis for a molecule, the same method and basis set must be employed. This is because frequency analysis is carried out on fully optimised molecules to confirm the successful structure, and provide spectral data for the molecule. Use of a different method or basis set will result in incorrect findings.
The purpose of carrying out frequency analysis is to further confirm successful optimisation of a molecule, because frequency analysis is essentially the second derivative of the potential energy surface. Also, it produces infrared spectra and Raman modes, which can be compared to experimental results and analysed for better understanding.
The "low frequencies" represent the motions of the center of mass of the molecule. Since every molecule has 3N-6 vibrational frequencies, the frequencies listed show the "-6" values.
NH3
Optimisation
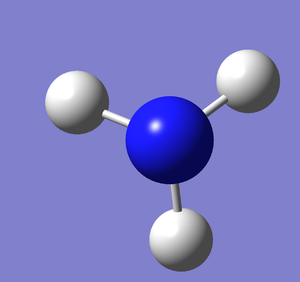
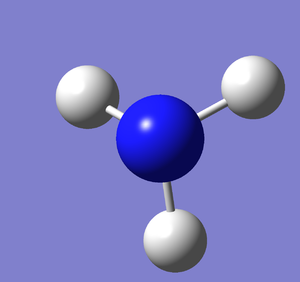
A molecule of NH3 was created and optimised in Gaussview. Since the molecule is so small, it was only necessary to use the high level basis set, 6-31G(d,p). The output log file of this optimisation is linked here and a Gaussview image of the optimised molecule is shown in Figure 15.
The optimised molecule was reproduced as a Java file and can be opened by clicking on the Molecule 7 button:
The summary table below shows the important information about the calculation:
| NH3_AVC | ||
|---|---|---|
| File Type | .log | |
| Calculation Type | FOPT | |
| Calculation Method | RB3LYP | |
| Basis Set | 6-31G(d,p) | |
| Charge | 0 | |
| Spin | Singlet | |
| Total energy | -56.55776852 a.u. | |
| RMS Gradient Norm | 0.00003472 a.u. | |
| Imaginary Freq | ||
| Dipole Moment | 1.8480 Debye | |
| Point Group | C1 | |
| Calculation Time | 1 minutes 0.0 seconds | |
| Optimised N-H Bond Distance | 1.01798 Angstrom | |
| Optimised H-N-H Bond Angle | 105.714 degrees | |
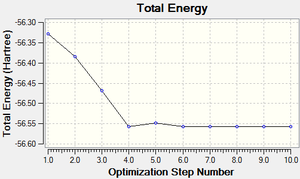
The total energy curve (Figure 16) shows the program moving along the potential energy surface (PES) of the NH3 molecule and finding the minimum energy structure.
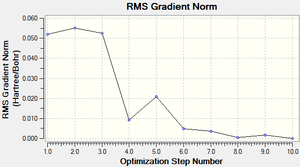
The RMS (root mean square) gradient curve (Figure 17) shows that the gradient goes to zero as the minimum is approached.
The information below, extracted from the output log file, shows that the job has converged and the optimisation was successful.
 Item                     Value        Threshold  Converged?
 Maximum Force            0.000052     0.000450     YES
 RMS     Force            0.000039     0.000300     YES
 Maximum Displacement     0.000630     0.001800     YES
 RMS     Displacement     0.000369     0.001200     YES
 Predicted change in Energy=-5.618230D-08
 Optimization completed.
    -- Stationary point found.
                           ----------------------------
                           !   Optimized Parameters   !
                           ! (Angstroms and Degrees)  !
 --------------------------                            --------------------------
 ! Name  Definition              Value          Derivative Info.                !
 --------------------------------------------------------------------------------
 ! R1    R(1,2)                  1.018          -DE/DX =    0.0                 !
 ! R2    R(1,3)                  1.018          -DE/DX =    0.0                 !
 ! R3    R(1,4)                  1.0179         -DE/DX =    0.0001              !
 ! A1    A(2,1,3)              105.7109         -DE/DX =    0.0                 !
 ! A2    A(2,1,4)              105.7143         -DE/DX =    0.0                 !
 ! A3    A(3,1,4)              105.7134         -DE/DX =    0.0                 !
 ! D1    D(2,1,4,3)           -111.8004         -DE/DX =   -0.0001              !
 --------------------------------------------------------------------------------
 GradGradGradGradGradGradGradGradGradGradGradGradGradGradGradGradGradGrad
Frequency analysis
Frequency analysis was carried out on the fully optimised (6-31G(d,p)) structure to confirm the minimum energy structures. The output log file is linked here and the Gaussview image of the molecule is shown in Figure 18.
The optimised molecule was reproduced as a Java file and can be opened by clicking on the Molecule 8 button:
The summary table below shows all the important information about the calculation. As you can see, the total energy is the same as that recorded for the optimisation.
| NH3_FREQUENCY_AVC | ||
|---|---|---|
| File Type | .log | |
| Calculation Type | FREQ | |
| Calculation Method | RB3LYP | |
| Basis Set | 6-31G(d,p) | |
| Charge | 0 | |
| Spin | Singlet | |
| Total energy | -56.55776852 a.u. | |
| RMS Gradient Norm | 0.00003463 a.u. | |
| Imaginary Freq | 0 | |
| Dipole Moment | 1.8480 Debye | |
| Point Group | C1 | |
| Calculation Time | 9.0 seconds | |
| Optimised N-H Bond Distance | 1.01798 Angstrom | |
| Optimised H-N-H Bond Angle | 105.713 degrees | |
The information below, extracted from the output log file, shows that the job has converged and the optimisation was successful.
 Item                     Value        Threshold  Converged?
 Maximum Force            0.000071     0.000450     YES
 RMS     Force            0.000035     0.000300     YES
 Maximum Displacement     0.000664     0.001800     YES
 RMS     Displacement     0.000288     0.001200     YES
 Predicted change in Energy=-5.731720D-08
 Optimization completed.
    -- Stationary point found.
 GradGradGradGradGradGradGradGradGradGradGradGradGradGradGradGradGradGrad
The output log file also shows the important frequencies of the calculation (see below).
 Low frequencies ---  -35.2863  -15.3544   -0.0012    0.0008    0.0012    8.2630
 Low frequencies --- 1090.9042 1694.1849 1694.2501
The better the method employed, the closer to zero these frequencies will be. Ideally, these should be within plus/minus 15 cm-1.
Animating vibrations
Using the completed frequency analysis for NH3, the vibrations of the molecule were explored in Gaussview. The six distinct vibrations of NH3 are summarised in the table below:
| No. | Vibration | Description | Frequency (cm-1) | Intensity | Symmetry of Point Group |
|---|---|---|---|---|---|
| 1 | View animation 1 | The three H atoms move up and down, and the N atom moves up and down in the opposite direction. | 1090.90 | 145.0149 | A2 |
| 2 | View animation 2 | Two H atoms move in the plane towards and away from each other, and this pushes the B and remaining H atom away and back to the original position. | 1694.18 | 13.5212 | E' |
| 3 | View animation 3 | Two H atoms move in the plane towards and away from each other, whilst the other H atom vibrates left and right independently. | 1694.25 | 13.5214 | E' |
| 4 | View animation 4 | The three H atoms move simultaneously along the bond towards the N atom, which remains stationary. | 3461.25 | 1.0716 | A1' |
| 5 | View animation 5 | Two H atoms move in and out along the bond towards the B atom, in a non-concerted manner. The other H remains stationary. | 3589.33 | 0.2820 | E' |
| 6 | View animation 6 | Two H atoms move unanimously in and out along the bond towards the N, whilst the other H moves with the same motion but not simultaneously with the 2 other H atoms. The N atom remains stationary. | 3589.60 | 0.2810 | E' |
The infrared spectrum of NH3, obtained from frequency analysis, is shown below in Figure 19.
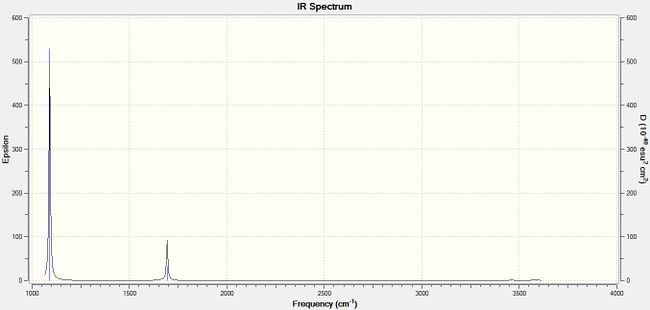
The infrared spectrum only shows four peaks, whereas six distinct peaks are expected since there are six different vibrations. The reason for this is that some peaks have similar frequencies, which are superimposed and therefore appear overlapped as one peak.
Population analysis
The molecular orbitals of NH3 were obtained using the fully optimised molecule (6-31G(d,p)). The output log file is linked to here. An MO diagram of the trigonal planar molecule was created in ChemDraw. The LCAOs for each energy level were included, as well as a snap-shot of the "real" MOs obtained in Gaussview. The completed MO diagram is shown below:
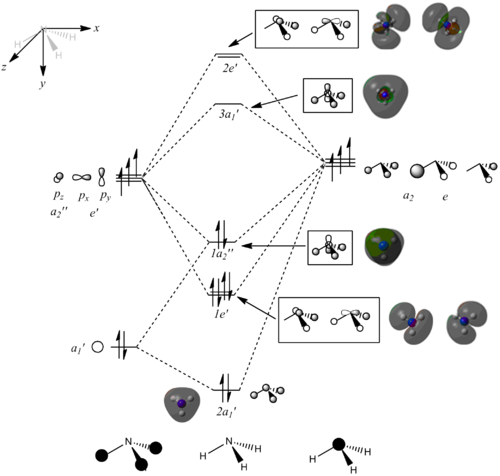
The "real" computed MOs are very similar to the LCAOs. However, the unoccupied orbitals are more diffuse than the occupied orbitals and this can result in unexpected shapes. It can therefore be proposed that qualitative MO theory is accurate for occupied and low-energy unoccupied orbitals , but becomes less useful for higher energy unoccupied orbitals because they are more diffuse.
NBO analysis
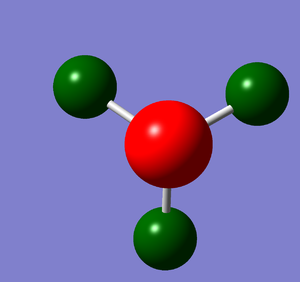
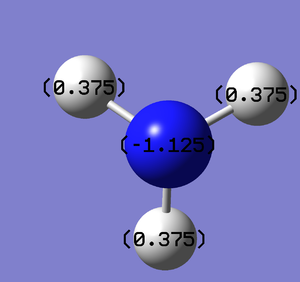
Natural Bond Orbital Analysis was carried out on a molecule of NH3. Figure 20 shows a Gaussview image of the charged molecule. Bright red represents a highly negative charge and bright green indicates a highly positive charge. The charge range for the NBO of NH3 is -1.125 to +1.125. As shown in Figure 21, the N has a charge of -1.125 and each H has a charge of +0.375.
NH3BH3
Optimisation
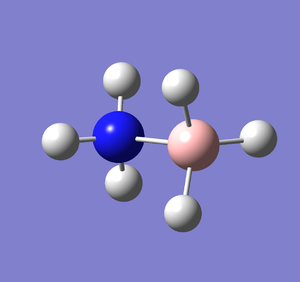
A molecule of NH3BH3 was created and optimised in Gaussview, ensuring the same basis set and method was used. The output log file of this optimisation is linked here and a Gaussview image of the optimised molecule is shown in Figure 22.
The optimised molecule was reproduced as a Java file and can be opened by clicking on the Molecule 9 button:
The summary table below shows the important information about the calculation:
| NH3BH3_AVC | ||
|---|---|---|
| File Type | .log | |
| Calculation Type | FOPT | |
| Calculation Method | RB3LYP | |
| Basis Set | 6-31G(d,p) | |
| Charge | 0 | |
| Spin | Singlet | |
| Total energy | -83.22469032 a.u. | |
| RMS Gradient Norm | 0.00005935 a.u. | |
| Imaginary Freq | ||
| Dipole Moment | 5.5648 Debye | |
| Point Group | C1 | |
| Calculation Time | 58.0 seconds | |
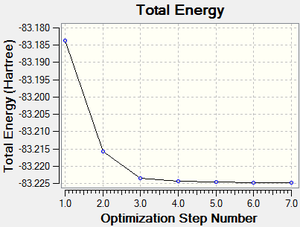
The total energy curve (Figure 23) shows the program moving along the potential energy surface (PES) of the NH3BH3 molecule and finding the minimum energy structure.
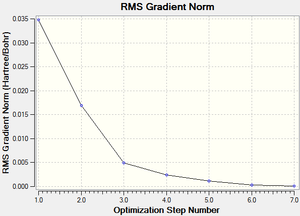
The RMS (root mean square) gradient curve (Figure 24) shows that the gradient goes to zero as the minimum is approached.
The information below, extracted from the output log file, shows that the job has converged and the optimisation was successful.
 Item                     Value        Threshold  Converged?
 Maximum Force            0.000121     0.000450     YES
 RMS     Force            0.000057     0.000300     YES
 Maximum Displacement     0.000508     0.001800     YES
 RMS     Displacement     0.000294     0.001200     YES
 Predicted change in Energy=-1.611643D-07
 Optimization completed.
    -- Stationary point found.
                           ----------------------------
                           !   Optimized Parameters   !
                           ! (Angstroms and Degrees)  !
 --------------------------                            --------------------------
 ! Name  Definition              Value          Derivative Info.                !
 --------------------------------------------------------------------------------
 ! R1    R(1,7)                  1.0186         -DE/DX =   -0.0001              !
 ! R2    R(2,7)                  1.0186         -DE/DX =   -0.0001              !
 ! R3    R(3,7)                  1.0186         -DE/DX =   -0.0001              !
 ! R4    R(4,8)                  1.21           -DE/DX =   -0.0001              !
 ! R5    R(5,8)                  1.21           -DE/DX =   -0.0001              !
 ! R6    R(6,8)                  1.21           -DE/DX =   -0.0001              !
 ! R7    R(7,8)                  1.6681         -DE/DX =   -0.0001              !
 ! A1    A(1,7,2)              107.873          -DE/DX =    0.0                 !
 ! A2    A(1,7,3)              107.873          -DE/DX =    0.0                 !
 ! A3    A(1,7,8)              111.0212         -DE/DX =    0.0                 !
 ! A4    A(2,7,3)              107.8692         -DE/DX =    0.0                 !
 ! A5    A(2,7,8)              111.0298         -DE/DX =    0.0                 !
 ! A6    A(3,7,8)              111.0297         -DE/DX =    0.0                 !
 ! A7    A(4,8,5)              113.8796         -DE/DX =    0.0                 !
 ! A8    A(4,8,6)              113.8796         -DE/DX =    0.0                 !
 ! A9    A(4,8,7)              104.5972         -DE/DX =    0.0                 !
 ! A10   A(5,8,6)              113.8728         -DE/DX =    0.0                 !
 ! A11   A(5,8,7)              104.591          -DE/DX =    0.0                 !
 ! A12   A(6,8,7)              104.591          -DE/DX =    0.0                 !
 ! D1    D(1,7,8,4)            179.9998         -DE/DX =    0.0                 !
 ! D2    D(1,7,8,5)            -59.9967         -DE/DX =    0.0                 !
 ! D3    D(1,7,8,6)             59.9963         -DE/DX =    0.0                 !
 ! D4    D(2,7,8,4)            -60.0005         -DE/DX =    0.0                 !
 ! D5    D(2,7,8,5)             60.003          -DE/DX =    0.0                 !
 ! D6    D(2,7,8,6)            179.996          -DE/DX =    0.0                 !
 ! D7    D(3,7,8,4)             60.0001         -DE/DX =    0.0                 !
 ! D8    D(3,7,8,5)           -179.9964         -DE/DX =    0.0                 !
 ! D9    D(3,7,8,6)            -60.0034         -DE/DX =    0.0                 !
 --------------------------------------------------------------------------------
 GradGradGradGradGradGradGradGradGradGradGradGradGradGradGradGradGradGrad
Frequency analysis
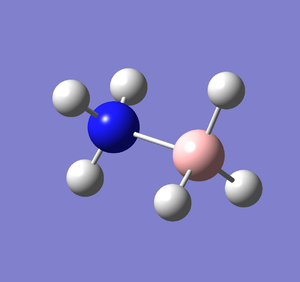
Frequency analysis was carried out on the fully optimised (6-31G(d,p)) structure to confirm the minimum energy structures. The output log file is linked here and the Gaussview image of the molecule is shown in Figure 25.
The optimised molecule was reproduced as a Java file and can be opened by clicking on the Molecule 10 button:
The summary table below shows all the important information about the calculation. As you can see, the total energy is the same as that recorded for the optimisation.
| NH3BH3_FREQ_AVC | ||
|---|---|---|
| File Type | .log | |
| Calculation Type | FREQ | |
| Calculation Method | RB3LYP | |
| Basis Set | 6-31G(d,p) | |
| Charge | 0 | |
| Spin | Singlet | |
| Total energy | -83.22469032 a.u. | |
| RMS Gradient Norm | 0.00005943 a.u. | |
| Imaginary Freq | 0 | |
| Dipole Moment | 5.5648 Debye | |
| Point Group | C1 | |
| Calculation Time | 44.0 seconds | |
The information below, extracted from the output log file, shows that the job has converged and the optimisation was successful.
 Item               Value     Threshold  Converged?
 Maximum Force            0.000113     0.000450     YES
 RMS     Force            0.000059     0.000300     YES
 Maximum Displacement     0.000582     0.001800     YES
 RMS     Displacement     0.000343     0.001200     YES
 Predicted change in Energy=-1.716440D-07
 Optimization completed.
    -- Stationary point found.
 GradGradGradGradGradGradGradGradGradGradGradGradGradGradGradGradGradGrad
The output log file also shows the important frequencies of the calculation (see below).
 Low frequencies ---   -0.0011    0.0006    0.0009   18.5424   23.7766   41.0416
 Low frequencies ---  266.2888  632.2327  639.8262
The better the method employed, the closer to zero these frequencies will be. Ideally, these should be within plus/minus 15 cm-1.
Association energies
The total energies of the molecules, obtained from frequency analysis, are:
E(NH3) = -56.55776852 a.u.
E(BH3) = -26.61532374 a.u.
E(NH3BH3) = -83.22469032 a.u.
The energy difference is given by:
ΔE = E(NH3BH3) - [E(NH3) + E(BH3)] = -83.22469032 - [-56.55776852 + -26.61532374]
ΔE = -0.05159826 a.u. = -135.471 kJ/mol
This number is the association energy for combining a molecule of NH3 with a molecule of BH3. It is also the dissociation energy. The literature value for the dissociation energy was found to be -98.3250 kJ/mol (-0.03745 a.u.), which is of the same order of magnitude as the obtained value.[1]
- ↑ J. S. Binkley and L. R. Thorne. J. Chem. Phys. 79, 6: 2932-2940.
Week 2: Investigating Aromaticity Project
Benzene
Optimisation - low level basis set
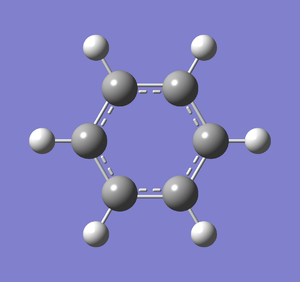
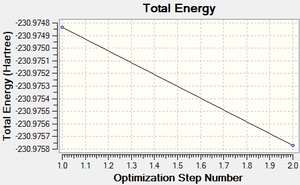
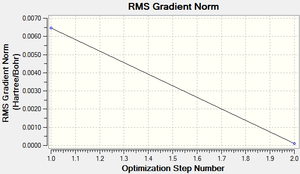
A molecule of benzene was created and optimised in Gaussview. Since it is a fairly large molecule, a low level basis set (3-21G) was initially used to ensure the structure was roughly correct. The output log file of this optimisation is linked here and the link to the D-space file is http://dx.doi.org/10042/23254. A Gaussview image of the optimised molecule is shown in Figure 26.
The optimised molecule was reproduced as a Java file and can be opened by clicking on the Molecule 11 button:
The summary table below shows the important information about the calculation:
| benzene_321g_avc | ||
|---|---|---|
| File Type | .log | |
| Calculation Type | FOPT | |
| Calculation Method | RB3LYP | |
| Basis Set | 3-21G | |
| Charge | 0 | |
| Spin | Singlet | |
| Total energy | -230.97576955 a.u. | |
| RMS Gradient Norm | 0.00011167 a.u. | |
| Imaginary Freq | ||
| Dipole Moment | 0.0001 Debye | |
| Point Group | C1 | |
| Calculation Time | 56.0 seconds | |
The total energy curve (Figure 27) shows the program moving along the potential energy surface (PES) of the benzene molecule and finding the minimum energy structure.
The RMS (root mean square) gradient curve (Figure 28) shows that the gradient goes to zero as the minimum is approached.
The information below, extracted from the output log file, shows that the job has converged and the optimisation was successful.
 Item                     Value        Threshold  Converged?
 Maximum Force            0.000216     0.000450     YES
 RMS     Force            0.000076     0.000300     YES
 Maximum Displacement     0.000726     0.001800     YES
 RMS     Displacement     0.000267     0.001200     YES
 Predicted change in Energy=-4.465157D-07
 Optimization completed.
    -- Stationary point found.
                           ----------------------------
                           !   Optimized Parameters   !
                           ! (Angstroms and Degrees)  !
 --------------------------                            --------------------------
 ! Name  Definition              Value          Derivative Info.                !
 --------------------------------------------------------------------------------
 ! R1    R(1,2)                  1.3974         -DE/DX =    0.0                 !
 ! R2    R(1,6)                  1.3971         -DE/DX =    0.0001              !
 ! R3    R(1,7)                  1.0838         -DE/DX =    0.0002              !
 ! R4    R(2,3)                  1.3971         -DE/DX =    0.0001              !
 ! R5    R(2,8)                  1.0838         -DE/DX =    0.0002              !
 ! R6    R(3,4)                  1.3973         -DE/DX =    0.0                 !
 ! R7    R(3,9)                  1.0838         -DE/DX =    0.0002              !
 ! R8    R(4,5)                  1.3971         -DE/DX =    0.0001              !
 ! R9    R(4,10)                 1.0838         -DE/DX =    0.0002              !
 ! R10   R(5,6)                  1.3973         -DE/DX =    0.0                 !
 ! R11   R(5,11)                 1.0838         -DE/DX =    0.0002              !
 ! R12   R(6,12)                 1.0838         -DE/DX =    0.0002              !
 ! A1    A(2,1,6)              119.9983         -DE/DX =    0.0                 !
 ! A2    A(2,1,7)              119.9999         -DE/DX =    0.0                 !
 ! A3    A(6,1,7)              120.0017         -DE/DX =    0.0                 !
 ! A4    A(1,2,3)              120.002          -DE/DX =    0.0                 !
 ! A5    A(1,2,8)              119.9952         -DE/DX =    0.0                 !
 ! A6    A(3,2,8)              120.0027         -DE/DX =    0.0                 !
 ! A7    A(2,3,4)              119.9997         -DE/DX =    0.0                 !
 ! A8    A(2,3,9)              120.0093         -DE/DX =    0.0                 !
 ! A9    A(4,3,9)              119.9909         -DE/DX =    0.0                 !
 ! A10   A(3,4,5)              119.9979         -DE/DX =    0.0                 !
 ! A11   A(3,4,10)             119.9871         -DE/DX =    0.0                 !
 ! A12   A(5,4,10)             120.015          -DE/DX =    0.0                 !
 ! A13   A(4,5,6)              120.0025         -DE/DX =    0.0                 !
 ! A14   A(4,5,11)             120.0084         -DE/DX =    0.0                 !
 ! A15   A(6,5,11)             119.9891         -DE/DX =    0.0                 !
 ! A16   A(1,6,5)              119.9995         -DE/DX =    0.0                 !
 ! A17   A(1,6,12)             120.0058         -DE/DX =    0.0                 !
 ! A18   A(5,6,12)             119.9947         -DE/DX =    0.0                 !
 ! D1    D(6,1,2,3)             -0.0094         -DE/DX =    0.0                 !
 ! D2    D(6,1,2,8)            180.0028         -DE/DX =    0.0                 !
 ! D3    D(7,1,2,3)           -180.0118         -DE/DX =    0.0                 !
 ! D4    D(7,1,2,8)              0.0004         -DE/DX =    0.0                 !
 ! D5    D(2,1,6,5)             -0.0054         -DE/DX =    0.0                 !
 ! D6    D(2,1,6,12)           180.0048         -DE/DX =    0.0                 !
 ! D7    D(7,1,6,5)           -180.003          -DE/DX =    0.0                 !
 ! D8    D(7,1,6,12)             0.0072         -DE/DX =    0.0                 !
 ! D9    D(1,2,3,4)              0.0171         -DE/DX =    0.0                 !
 ! D10   D(1,2,3,9)            180.0093         -DE/DX =    0.0                 !
 ! D11   D(8,2,3,4)            180.0049         -DE/DX =    0.0                 !
 ! D12   D(8,2,3,9)             -0.003          -DE/DX =    0.0                 !
 ! D13   D(2,3,4,5)             -0.01           -DE/DX =    0.0                 !
 ! D14   D(2,3,4,10)          -180.0081         -DE/DX =    0.0                 !
 ! D15   D(9,3,4,5)            179.9978         -DE/DX =    0.0                 !
 ! D16   D(9,3,4,10)            -0.0003         -DE/DX =    0.0                 !
 ! D17   D(3,4,5,6)             -0.0048         -DE/DX =    0.0                 !
 ! D18   D(3,4,5,11)           180.0075         -DE/DX =    0.0                 !
 ! D19   D(10,4,5,6)          -180.0067         -DE/DX =    0.0                 !
 ! D20   D(10,4,5,11)            0.0056         -DE/DX =    0.0                 !
 ! D21   D(4,5,6,1)              0.0125         -DE/DX =    0.0                 !
 ! D22   D(4,5,6,12)           180.0023         -DE/DX =    0.0                 !
 ! D23   D(11,5,6,1)           180.0002         -DE/DX =    0.0                 !
 ! D24   D(11,5,6,12)           -0.01           -DE/DX =    0.0                 !
 --------------------------------------------------------------------------------
 GradGradGradGradGradGradGradGradGradGradGradGradGradGradGradGradGradGrad
Optimisation - high level basis set
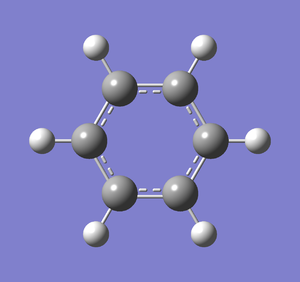
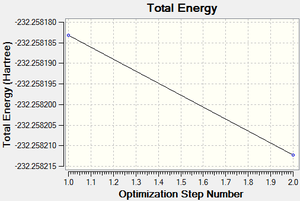
Following successful optimisation with a low level basis set, a high level basis set, 6-31G(d,p), was then used to fully optimise the molecule of benzene. The output log file of this optimisation is linked here and the link to the D-space file is http://dx.doi.org/10042/23255. A Gaussview image of the optimised molecule is shown in Figure 29.
The optimised molecule was reproduced as a Java file and can be opened by clicking on the Molecule 12 button:
The summary table below shows the important information about the calculation:
| BENZENE_631G_AVC | ||
|---|---|---|
| File Type | .log | |
| Calculation Type | FOPT | |
| Calculation Method | RB3LYP | |
| Basis Set | 6-31G(d,p) | |
| Charge | 0 | |
| Spin | Singlet | |
| Total energy | -232.25821232 a.u. | |
| RMS Gradient Norm | 0.00003385 a.u. | |
| Imaginary Freq | ||
| Dipole Moment | 0.0000 Debye | |
| Point Group | C1 | |
| Calculation Time | 1 minutes 6.0 seconds | |
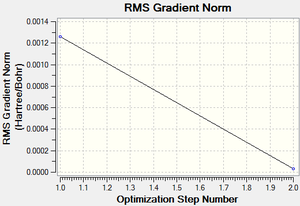
The total energy curve (Figure 30) shows the program moving along the potential energy surface (PES) of the benzene molecule and finding the minimum energy structure.
The RMS (root mean square) gradient curve (Figure 31) shows that the gradient goes to zero as the minimum is approached.
The information below, extracted from the output log file, shows that the job has converged and the optimisation was successful.
 Item                     Value        Threshold  Converged?
 Maximum Force            0.000071     0.000450     YES
 RMS     Force            0.000019     0.000300     YES
 Maximum Displacement     0.000124     0.001800     YES
 RMS     Displacement     0.000049     0.001200     YES
 Predicted change in Energy=-2.212772D-08
 Optimization completed.
    -- Stationary point found.
                           ----------------------------
                           !   Optimized Parameters   !
                           ! (Angstroms and Degrees)  !
 --------------------------                            --------------------------
 ! Name  Definition              Value          Derivative Info.                !
 --------------------------------------------------------------------------------
 ! R1    R(1,2)                  1.3963         -DE/DX =    0.0                 !
 ! R2    R(1,6)                  1.3962         -DE/DX =    0.0001              !
 ! R3    R(1,7)                  1.0864         -DE/DX =    0.0                 !
 ! R4    R(2,3)                  1.3962         -DE/DX =    0.0001              !
 ! R5    R(2,8)                  1.0864         -DE/DX =    0.0                 !
 ! R6    R(3,4)                  1.3963         -DE/DX =    0.0                 !
 ! R7    R(3,9)                  1.0864         -DE/DX =    0.0                 !
 ! R8    R(4,5)                  1.3962         -DE/DX =    0.0001              !
 ! R9    R(4,10)                 1.0864         -DE/DX =    0.0                 !
 ! R10   R(5,6)                  1.3963         -DE/DX =    0.0                 !
 ! R11   R(5,11)                 1.0864         -DE/DX =    0.0                 !
 ! R12   R(6,12)                 1.0864         -DE/DX =    0.0                 !
 ! A1    A(2,1,6)              120.0009         -DE/DX =    0.0                 !
 ! A2    A(2,1,7)              119.9975         -DE/DX =    0.0                 !
 ! A3    A(6,1,7)              120.0017         -DE/DX =    0.0                 !
 ! A4    A(1,2,3)              120.0012         -DE/DX =    0.0                 !
 ! A5    A(1,2,8)              119.9967         -DE/DX =    0.0                 !
 ! A6    A(3,2,8)              120.0021         -DE/DX =    0.0                 !
 ! A7    A(2,3,4)              119.9979         -DE/DX =    0.0                 !
 ! A8    A(2,3,9)              120.0052         -DE/DX =    0.0                 !
 ! A9    A(4,3,9)              119.9969         -DE/DX =    0.0                 !
 ! A10   A(3,4,5)              120.0008         -DE/DX =    0.0                 !
 ! A11   A(3,4,10)             119.9941         -DE/DX =    0.0                 !
 ! A12   A(5,4,10)             120.0051         -DE/DX =    0.0                 !
 ! A13   A(4,5,6)              120.0012         -DE/DX =    0.0                 !
 ! A14   A(4,5,11)             120.0039         -DE/DX =    0.0                 !
 ! A15   A(6,5,11)             119.9948         -DE/DX =    0.0                 !
 ! A16   A(1,6,5)              119.9979         -DE/DX =    0.0                 !
 ! A17   A(1,6,12)             120.0044         -DE/DX =    0.0                 !
 ! A18   A(5,6,12)             119.9976         -DE/DX =    0.0                 !
 ! D1    D(6,1,2,3)              0.0034         -DE/DX =    0.0                 !
 ! D2    D(6,1,2,8)           -180.0015         -DE/DX =    0.0                 !
 ! D3    D(7,1,2,3)            180.0033         -DE/DX =    0.0                 !
 ! D4    D(7,1,2,8)             -0.0017         -DE/DX =    0.0                 !
 ! D5    D(2,1,6,5)              0.0015         -DE/DX =    0.0                 !
 ! D6    D(2,1,6,12)          -180.0007         -DE/DX =    0.0                 !
 ! D7    D(7,1,6,5)            180.0016         -DE/DX =    0.0                 !
 ! D8    D(7,1,6,12)            -0.0005         -DE/DX =    0.0                 !
 ! D9    D(1,2,3,4)             -0.006          -DE/DX =    0.0                 !
 ! D10   D(1,2,3,9)           -180.0022         -DE/DX =    0.0                 !
 ! D11   D(8,2,3,4)           -180.0011         -DE/DX =    0.0                 !
 ! D12   D(8,2,3,9)              0.0027         -DE/DX =    0.0                 !
 ! D13   D(2,3,4,5)              0.0037         -DE/DX =    0.0                 !
 ! D14   D(2,3,4,10)           180.0024         -DE/DX =    0.0                 !
 ! D15   D(9,3,4,5)            179.9999         -DE/DX =    0.0                 !
 ! D16   D(9,3,4,10)            -0.0014         -DE/DX =    0.0                 !
 ! D17   D(3,4,5,6)              0.0012         -DE/DX =    0.0                 !
 ! D18   D(3,4,5,11)          -180.0014         -DE/DX =    0.0                 !
 ! D19   D(10,4,5,6)           180.0025         -DE/DX =    0.0                 !
 ! D20   D(10,4,5,11)           -0.0001         -DE/DX =    0.0                 !
 ! D21   D(4,5,6,1)             -0.0038         -DE/DX =    0.0                 !
 ! D22   D(4,5,6,12)          -180.0017         -DE/DX =    0.0                 !
 ! D23   D(11,5,6,1)           179.9988         -DE/DX =    0.0                 !
 ! D24   D(11,5,6,12)            0.001          -DE/DX =    0.0                 !
 --------------------------------------------------------------------------------
 GradGradGradGradGradGradGradGradGradGradGradGradGradGradGradGradGradGrad
Frequency analysis
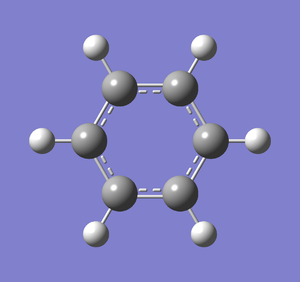
Frequency analysis was carried out on the fully optimised (6-31G(d,p)) structure to confirm the minimum energy structures. The output log file is linked to here and the link to the D-space file is http://dx.doi.org/10042/23253. The Gaussview image of the molecule is shown in Figure 32.
The optimised molecule was reproduced as a Java file and can be opened by clicking on the Molecule 13 button:
The summary table below shows all the important information about the calculation. As you can see, the total energy is the same as that recorded for the optimisation.
| BENZENE_FREQUENCY_AVC | ||
|---|---|---|
| File Type | .log | |
| Calculation Type | FREQ | |
| Calculation Method | RB3LYP | |
| Basis Set | 6-31G(d,p) | |
| Charge | 0 | |
| Spin | Singlet | |
| Total energy | -232.25821232 a.u. | |
| RMS Gradient Norm | 0.00003384 a.u. | |
| Imaginary Freq | 0 | |
| Dipole Moment | 0.0001 Debye | |
| Point Group | C1 | |
| Calculation Time | 5 minutes 35.2 seconds | |
The information below, extracted from the output log file, shows that the job has converged and the optimisation was successful.
 Item                     Value        Threshold  Converged?
 Maximum Force            0.000081     0.000450     YES
 RMS     Force            0.000034     0.000300     YES
 Maximum Displacement     0.000124     0.001800     YES
 RMS     Displacement     0.000064     0.001200     YES
 Predicted change in Energy=-2.546715D-08
 Optimization completed.
    -- Stationary point found.
The output log file also shows the important frequencies of the calculation (see below).
 Low frequencies ---   -5.1642   -0.0010   -0.0009   -0.0005   13.0466   16.7439
 Low frequencies ---  414.1402  414.9607  621.1690
Population analysis
MO analysis was carried out on the optimised benzene molecule. The output log file is linked here and the link to the D-space file is http://dx.doi.org/10042/23264.
NBO analysis
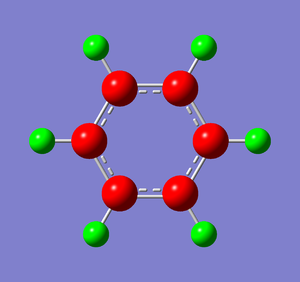
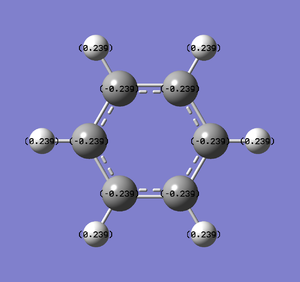
Natural Bond Orbital Analysis was carried out on a molecule of benzene, using the output log from from the population analysis. Figure 33 shows a Gaussview image of the charged molecule. Bright red represents a highly negative charge and bright green indicates a highly positive charge. The charge range for the NBO of benzene is -0.239 to +0.239. As shown in Figure 34, the C atoms have a charge of -0.239 and each H has a charge of +0.239.
Boratabenzene
Optimisation - low level basis set
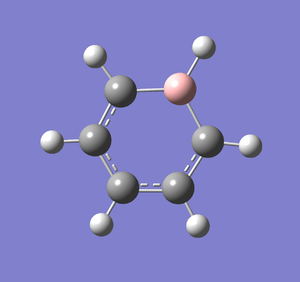
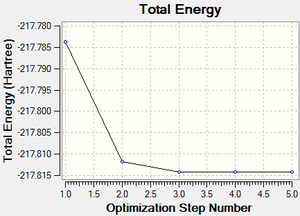
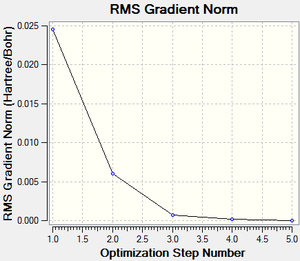
A molecule of boratabenzene was created and optimised in Gaussview. Since it is a fairly large molecule, a low level basis set (3-21G) was initially used to ensure the structure was roughly correct. The output log file of this optimisation is linked here and the link to the D-space file is http://dx.doi.org/10042/23250. A Gaussview image of the optimised molecule is shown in Figure 35.
The optimised molecule was reproduced as a Java file and can be opened by clicking on the Molecule 14 button:
The summary table below shows the important information about the calculation:
| BC5H6_321G_AVC | ||
|---|---|---|
| File Type | .log | |
| Calculation Type | FOPT | |
| Calculation Method | RB3LYP | |
| Basis Set | 3-21G | |
| Charge | -1 | |
| Spin | Singlet | |
| Total energy | -217.81414734 a.u. | |
| RMS Gradient Norm | 0.00004211 a.u. | |
| Imaginary Freq | ||
| Dipole Moment | 8.2275 Debye | |
| Point Group | C1 | |
| Calculation Time | 1 minutes 37.2 seconds | |
The total energy curve (Figure 36) shows the program moving along the potential energy surface (PES) of the boratabenzene molecule and finding the minimum energy structure.
The RMS (root mean square) gradient curve (Figure 37) shows that the gradient goes to zero as the minimum is approached.
The information below, extracted from the output log file, shows that the job has converged and the optimisation was successful.
 Item                     Value        Threshold  Converged?
 Maximum Force            0.000075     0.000450     YES
 RMS     Force            0.000020     0.000300     YES
 Maximum Displacement     0.000282     0.001800     YES
 RMS     Displacement     0.000082     0.001200     YES
 Predicted change in Energy=-4.181592D-08
 Optimization completed.
    -- Stationary point found.
                           ----------------------------
                           !   Optimized Parameters   !
                           ! (Angstroms and Degrees)  !
 --------------------------                            --------------------------
 ! Name  Definition              Value          Derivative Info.                !
 --------------------------------------------------------------------------------
 ! R1    R(1,2)                  1.4054         -DE/DX =    0.0                 !
 ! R2    R(1,5)                  1.4053         -DE/DX =    0.0                 !
 ! R3    R(1,6)                  1.0896         -DE/DX =    0.0                 !
 ! R4    R(2,3)                  1.4017         -DE/DX =   -0.0001              !
 ! R5    R(2,7)                  1.0948         -DE/DX =    0.0                 !
 ! R6    R(3,8)                  1.0965         -DE/DX =    0.0                 !
 ! R7    R(3,12)                 1.5149         -DE/DX =    0.0001              !
 ! R8    R(4,5)                  1.4018         -DE/DX =   -0.0001              !
 ! R9    R(4,10)                 1.0965         -DE/DX =    0.0                 !
 ! R10   R(4,12)                 1.5149         -DE/DX =    0.0001              !
 ! R11   R(5,11)                 1.0948         -DE/DX =    0.0                 !
 ! R12   R(9,12)                 1.2183         -DE/DX =    0.0                 !
 ! A1    A(2,1,5)              120.5537         -DE/DX =    0.0                 !
 ! A2    A(2,1,6)              119.7217         -DE/DX =    0.0                 !
 ! A3    A(5,1,6)              119.7246         -DE/DX =    0.0                 !
 ! A4    A(1,2,3)              122.1916         -DE/DX =    0.0                 !
 ! A5    A(1,2,7)              117.6592         -DE/DX =    0.0                 !
 ! A6    A(3,2,7)              120.1492         -DE/DX =    0.0                 !
 ! A7    A(2,3,8)              116.3905         -DE/DX =    0.0                 !
 ! A8    A(2,3,12)             119.8052         -DE/DX =    0.0                 !
 ! A9    A(8,3,12)             123.8042         -DE/DX =    0.0                 !
 ! A10   A(5,4,10)             116.3798         -DE/DX =    0.0                 !
 ! A11   A(5,4,12)             119.8002         -DE/DX =    0.0                 !
 ! A12   A(10,4,12)            123.82           -DE/DX =    0.0                 !
 ! A13   A(1,5,4)              122.195          -DE/DX =    0.0                 !
 ! A14   A(1,5,11)             117.6458         -DE/DX =    0.0                 !
 ! A15   A(4,5,11)             120.1592         -DE/DX =    0.0                 !
 ! A16   A(3,12,4)             115.4543         -DE/DX =    0.0                 !
 ! A17   A(3,12,9)             122.2759         -DE/DX =    0.0                 !
 ! A18   A(4,12,9)             122.2698         -DE/DX =    0.0                 !
 ! D1    D(5,1,2,3)             -0.0032         -DE/DX =    0.0                 !
 ! D2    D(5,1,2,7)            179.9998         -DE/DX =    0.0                 !
 ! D3    D(6,1,2,3)           -180.002          -DE/DX =    0.0                 !
 ! D4    D(6,1,2,7)              0.001          -DE/DX =    0.0                 !
 ! D5    D(2,1,5,4)              0.0009         -DE/DX =    0.0                 !
 ! D6    D(2,1,5,11)           180.0018         -DE/DX =    0.0                 !
 ! D7    D(6,1,5,4)            179.9997         -DE/DX =    0.0                 !
 ! D8    D(6,1,5,11)             0.0006         -DE/DX =    0.0                 !
 ! D9    D(1,2,3,8)            180.0025         -DE/DX =    0.0                 !
 ! D10   D(1,2,3,12)             0.0033         -DE/DX =    0.0                 !
 ! D11   D(7,2,3,8)             -0.0005         -DE/DX =    0.0                 !
 ! D12   D(7,2,3,12)          -179.9997         -DE/DX =    0.0                 !
 ! D13   D(2,3,12,4)            -0.0013         -DE/DX =    0.0                 !
 ! D14   D(2,3,12,9)          -180.0011         -DE/DX =    0.0                 !
 ! D15   D(8,3,12,4)          -180.0005         -DE/DX =    0.0                 !
 ! D16   D(8,3,12,9)            -0.0003         -DE/DX =    0.0                 !
 ! D17   D(10,4,5,1)          -179.9999         -DE/DX =    0.0                 !
 ! D18   D(10,4,5,11)           -0.0008         -DE/DX =    0.0                 !
 ! D19   D(12,4,5,1)             0.001          -DE/DX =    0.0                 !
 ! D20   D(12,4,5,11)          180.0001         -DE/DX =    0.0                 !
 ! D21   D(5,4,12,3)            -0.0008         -DE/DX =    0.0                 !
 ! D22   D(5,4,12,9)          -180.001          -DE/DX =    0.0                 !
 ! D23   D(10,4,12,3)          180.0002         -DE/DX =    0.0                 !
 ! D24   D(10,4,12,9)            0.0            -DE/DX =    0.0                 !
 --------------------------------------------------------------------------------
 GradGradGradGradGradGradGradGradGradGradGradGradGradGradGradGradGradGrad
Optimisation - high level basis set
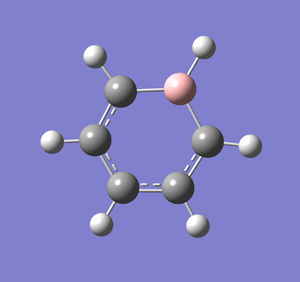
Following the successful optimisation of the boratabenzene molecule with a low level basis set, a new optimisation was carried out on the HPC using a higher level basis set. The output log file is linked here and the link to the D-space file is http://dx.doi.org/10042/23251. A Gaussview image of the optimised molecule is shown in Figure 38.
The optimised molecule was reproduced as a Java file and can be opened by clicking on the Molecule 15 button:
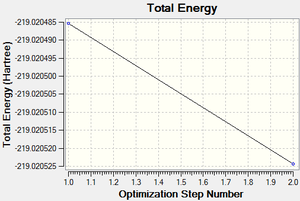
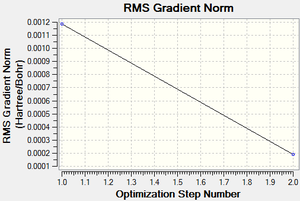
The total energy and gradient curves for the optimised boratabenzene molecule are both linear and are shown in Figures 39 and 40, respectively.
The summary table below shows all the important information about the calculation.
| BC5H6_631G_AVC | ||
|---|---|---|
| File Type | .log | |
| Calculation Type | FOPT | |
| Calculation Method | RB3LYP | |
| Basis Set | 6-31G(d,p) | |
| Charge | -1 | |
| Spin | Singlet | |
| Total energy | -219.02052430 a.u. | |
| RMS Gradient Norm | 0.00019085 a.u. | |
| Imaginary Freq | ||
| Dipole Moment | 8.1137 Debye | |
| Point Group | C1 | |
| Calculation Time | 1 minutes 59.4 seconds | |
The information below, extracted from the output log file, shows that the job has converged and the optimisation was successful.
 Item                     Value        Threshold  Converged?
 Maximum Force            0.000235     0.000450     YES
 RMS     Force            0.000095     0.000300     YES
 Maximum Displacement     0.001778     0.001800     YES
 RMS     Displacement     0.000515     0.001200     YES
 Predicted change in Energy=-1.134863D-06
 Optimization completed.
    -- Stationary point found.
                           ----------------------------
                           !   Optimized Parameters   !
                           ! (Angstroms and Degrees)  !
 --------------------------                            --------------------------
 ! Name  Definition              Value          Derivative Info.                !
 --------------------------------------------------------------------------------
 ! R1    R(1,2)                  1.4048         -DE/DX =    0.0002              !
 ! R2    R(1,5)                  1.4048         -DE/DX =    0.0002              !
 ! R3    R(1,6)                  1.0915         -DE/DX =    0.0                 !
 ! R4    R(2,3)                  1.3989         -DE/DX =    0.0                 !
 ! R5    R(2,7)                  1.0968         -DE/DX =    0.0001              !
 ! R6    R(3,8)                  1.0965         -DE/DX =    0.0002              !
 ! R7    R(3,12)                 1.5139         -DE/DX =    0.0001              !
 ! R8    R(4,5)                  1.399          -DE/DX =    0.0                 !
 ! R9    R(4,10)                 1.0965         -DE/DX =    0.0002              !
 ! R10   R(4,12)                 1.5138         -DE/DX =    0.0001              !
 ! R11   R(5,11)                 1.0968         -DE/DX =    0.0001              !
 ! R12   R(9,12)                 1.2188         -DE/DX =   -0.0001              !
 ! A1    A(2,1,5)              120.4786         -DE/DX =   -0.0002              !
 ! A2    A(2,1,6)              119.7577         -DE/DX =    0.0001              !
 ! A3    A(5,1,6)              119.7637         -DE/DX =    0.0001              !
 ! A4    A(1,2,3)              122.162          -DE/DX =    0.0                 !
 ! A5    A(1,2,7)              117.5047         -DE/DX =   -0.0001              !
 ! A6    A(3,2,7)              120.3334         -DE/DX =    0.0001              !
 ! A7    A(2,3,8)              116.0906         -DE/DX =   -0.0002              !
 ! A8    A(2,3,12)             120.0008         -DE/DX =    0.0002              !
 ! A9    A(8,3,12)             123.9087         -DE/DX =    0.0                 !
 ! A10   A(5,4,10)             116.0795         -DE/DX =   -0.0002              !
 ! A11   A(5,4,12)             119.9982         -DE/DX =    0.0002              !
 ! A12   A(10,4,12)            123.9223         -DE/DX =    0.0                 !
 ! A13   A(1,5,4)              122.1622         -DE/DX =    0.0                 !
 ! A14   A(1,5,11)             117.4953         -DE/DX =   -0.0001              !
 ! A15   A(4,5,11)             120.3425         -DE/DX =    0.0001              !
 ! A16   A(3,12,4)             115.1982         -DE/DX =   -0.0002              !
 ! A17   A(3,12,9)             122.4036         -DE/DX =    0.0001              !
 ! A18   A(4,12,9)             122.3982         -DE/DX =    0.0001              !
 ! D1    D(5,1,2,3)              0.0012         -DE/DX =    0.0                 !
 ! D2    D(5,1,2,7)            179.9996         -DE/DX =    0.0                 !
 ! D3    D(6,1,2,3)            180.0012         -DE/DX =    0.0                 !
 ! D4    D(6,1,2,7)             -0.0004         -DE/DX =    0.0                 !
 ! D5    D(2,1,5,4)             -0.0002         -DE/DX =    0.0                 !
 ! D6    D(2,1,5,11)          -180.0006         -DE/DX =    0.0                 !
 ! D7    D(6,1,5,4)            179.9998         -DE/DX =    0.0                 !
 ! D8    D(6,1,5,11)            -0.0006         -DE/DX =    0.0                 !
 ! D9    D(1,2,3,8)           -180.0013         -DE/DX =    0.0                 !
 ! D10   D(1,2,3,12)            -0.0012         -DE/DX =    0.0                 !
 ! D11   D(7,2,3,8)              0.0003         -DE/DX =    0.0                 !
 ! D12   D(7,2,3,12)          -179.9995         -DE/DX =    0.0                 !
 ! D13   D(2,3,12,4)             0.0003         -DE/DX =    0.0                 !
 ! D14   D(2,3,12,9)           180.0005         -DE/DX =    0.0                 !
 ! D15   D(8,3,12,4)           180.0004         -DE/DX =    0.0                 !
 ! D16   D(8,3,12,9)             0.0006         -DE/DX =    0.0                 !
 ! D17   D(10,4,5,1)           179.9998         -DE/DX =    0.0                 !
 ! D18   D(10,4,5,11)            0.0002         -DE/DX =    0.0                 !
 ! D19   D(12,4,5,1)            -0.0006         -DE/DX =    0.0                 !
 ! D20   D(12,4,5,11)         -180.0003         -DE/DX =    0.0                 !
 ! D21   D(5,4,12,3)             0.0006         -DE/DX =    0.0                 !
 ! D22   D(5,4,12,9)           180.0004         -DE/DX =    0.0                 !
 ! D23   D(10,4,12,3)         -179.9999         -DE/DX =    0.0                 !
 ! D24   D(10,4,12,9)           -0.0001         -DE/DX =    0.0                 !
 --------------------------------------------------------------------------------
 GradGradGradGradGradGradGradGradGradGradGradGradGradGradGradGradGradGrad
Frequency analysis
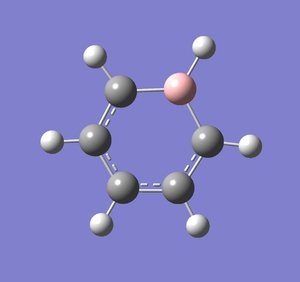
Frequency analysis was carried out on the fully optimised (6-31G(d,p)) structure to confirm the minimum energy structures. The output log file is linked to here and the link to the D-space file is http://dx.doi.org/10042/23252. A Gaussview image of the molecule is shown in Figure 41.
The optimised molecule was reproduced as a Java file and can be opened by clicking on the Molecule 16 button:
The summary table below shows all the important information about the calculation. As you can see, the total energy is the same as that recorded for the optimisation.
| BC5H6_FREQ_AVC | ||
|---|---|---|
| File Type | .log | |
| Calculation Type | FREQ | |
| Calculation Method | RB3LYP | |
| Basis Set | 6-31G(d,p) | |
| Charge | -1 | |
| Spin | Singlet | |
| Total energy | -219.02052430 a.u. | |
| RMS Gradient Norm | 0.00019093 a.u. | |
| Imaginary Freq | 0 | |
| Dipole Moment | 8.1137 Debye | |
| Point Group | C1 | |
| Calculation Time | 5 minutes 31.2 seconds | |
The information below, extracted from the output log file, shows that the job has converged and the optimisation was successful.
Item               Value     Threshold  Converged?
 Maximum Force            0.000448     0.000450     YES
 RMS     Force            0.000191     0.000300     YES
 Maximum Displacement     0.002063     0.001800     NO
 RMS     Displacement     0.000710     0.001200     YES
 Predicted change in Energy=-1.290820D-06
 GradGradGradGradGradGradGradGradGradGradGradGradGradGradGradGradGradGrad
The output log file also shows the important frequencies of the calculation (see below).
 Low frequencies ---  -17.4214   -3.4426   -0.0008   -0.0005    0.0002   10.4928
 Low frequencies ---  370.7426  404.4178  565.0823
Population analysis
MO analysis was carried out on the fully optimised boratabenzene molecule. The output log file is linked here and the link to the D-space file is http://dx.doi.org/10042/23265.
NBO analysis
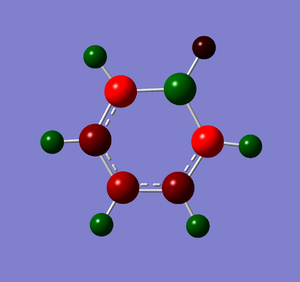
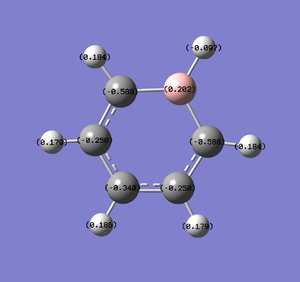
Natural Bond Orbital Analysis was carried out on a molecule of boratabenzene. Figure 42 shows a Gaussview image of the charged molecule. Bright red represents a highly negative charge and bright green indicates a highly positive charge. The charge range for the NBO of boratabenzene is -0.588 to +0.588.
Pyridinium
Optimisation - low level basis set
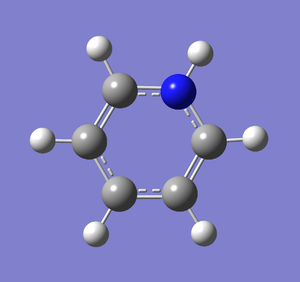
A molecule of pyridinium was created and optimised in Gaussview. Since it is a fairly large molecule, a low level basis set (3-21G) was initially used to ensure the structure was roughly correct. The output log file of this optimisation is linked to here and the link to the D-space file is http://dx.doi.org/10042/23245. A Gaussview image of the optimised molecule is shown in Figure 44.
The optimised molecule was reproduced as a Java file and can be opened by clicking on the Molecule 17 button:
The summary table below shows the important information about the calculation:
| NC5H6_321G_AVC | ||
|---|---|---|
| File Type | .log | |
| Calculation Type | FOPT | |
| Calculation Method | RB3LYP | |
| Basis Set | 3-21G | |
| Charge | 1 | |
| Spin | Singlet | |
| Total energy | -247.29354287 a.u. | |
| RMS Gradient Norm | 0.00019627 a.u. | |
| Imaginary Freq | ||
| Dipole Moment | 9.7154 Debye | |
| Point Group | C1 | |
| Calculation Time | 1 minutes 2.7 seconds | |
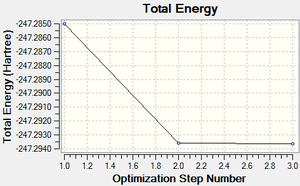
The total energy curve (Figure 45) shows the program moving along the potential energy surface (PES) of the pyridinium molecule and finding the minimum energy structure.
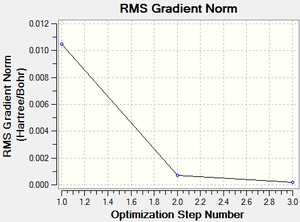
The RMS (root mean square) gradient curve (Figure 46) shows that the gradient goes to zero as the minimum is approached.
The information below, extracted from the output log file, shows that the job has converged and the optimisation was successful.
 Item                     Value        Threshold  Converged?
 Maximum Force            0.000409     0.000450     YES
 RMS     Force            0.000132     0.000300     YES
 Maximum Displacement     0.001776     0.001800     YES
 RMS     Displacement     0.000676     0.001200     YES
 Predicted change in Energy=-1.671961D-06
 Optimization completed.
    -- Stationary point found.
                           ----------------------------
                           !   Optimized Parameters   !
                           ! (Angstroms and Degrees)  !
 --------------------------                            --------------------------
 ! Name  Definition              Value          Derivative Info.                !
 --------------------------------------------------------------------------------
 ! R1    R(1,2)                  1.4004         -DE/DX =    0.0                 !
 ! R2    R(1,5)                  1.4002         -DE/DX =    0.0                 !
 ! R3    R(1,6)                  1.0828         -DE/DX =    0.0001              !
 ! R4    R(2,3)                  1.3844         -DE/DX =   -0.0004              !
 ! R5    R(2,7)                  1.0812         -DE/DX =   -0.0001              !
 ! R6    R(3,8)                  1.0808         -DE/DX =    0.0                 !
 ! R7    R(3,12)                 1.3602         -DE/DX =    0.0001              !
 ! R8    R(4,5)                  1.3845         -DE/DX =   -0.0004              !
 ! R9    R(4,10)                 1.0808         -DE/DX =    0.0                 !
 ! R10   R(4,12)                 1.3601         -DE/DX =    0.0002              !
 ! R11   R(5,11)                 1.0812         -DE/DX =   -0.0001              !
 ! R12   R(9,12)                 1.0232         -DE/DX =    0.0003              !
 ! A1    A(2,1,5)              119.8465         -DE/DX =    0.0003              !
 ! A2    A(2,1,6)              120.077          -DE/DX =   -0.0001              !
 ! A3    A(5,1,6)              120.0765         -DE/DX =   -0.0001              !
 ! A4    A(1,2,3)              119.2863         -DE/DX =   -0.0001              !
 ! A5    A(1,2,7)              121.3043         -DE/DX =    0.0                 !
 ! A6    A(3,2,7)              119.4094         -DE/DX =    0.0001              !
 ! A7    A(2,3,8)              123.0766         -DE/DX =    0.0002              !
 ! A8    A(2,3,12)             119.5212         -DE/DX =   -0.0002              !
 ! A9    A(8,3,12)             117.4022         -DE/DX =    0.0                 !
 ! A10   A(5,4,10)             123.0644         -DE/DX =    0.0002              !
 ! A11   A(5,4,12)             119.5191         -DE/DX =   -0.0002              !
 ! A12   A(10,4,12)            117.4165         -DE/DX =    0.0                 !
 ! A13   A(1,5,4)              119.2896         -DE/DX =   -0.0001              !
 ! A14   A(1,5,11)             121.3065         -DE/DX =    0.0                 !
 ! A15   A(4,5,11)             119.4039         -DE/DX =    0.0001              !
 ! A16   A(3,12,4)             122.5373         -DE/DX =    0.0003              !
 ! A17   A(3,12,9)             118.7255         -DE/DX =   -0.0001              !
 ! A18   A(4,12,9)             118.7371         -DE/DX =   -0.0001              !
 ! D1    D(5,1,2,3)             -0.001          -DE/DX =    0.0                 !
 ! D2    D(5,1,2,7)           -179.9987         -DE/DX =    0.0                 !
 ! D3    D(6,1,2,3)           -180.0018         -DE/DX =    0.0                 !
 ! D4    D(6,1,2,7)              0.0006         -DE/DX =    0.0                 !
 ! D5    D(2,1,5,4)              0.0004         -DE/DX =    0.0                 !
 ! D6    D(2,1,5,11)          -179.9983         -DE/DX =    0.0                 !
 ! D7    D(6,1,5,4)            180.0012         -DE/DX =    0.0                 !
 ! D8    D(6,1,5,11)             0.0024         -DE/DX =    0.0                 !
 ! D9    D(1,2,3,8)            180.0018         -DE/DX =    0.0                 !
 ! D10   D(1,2,3,12)             0.0013         -DE/DX =    0.0                 !
 ! D11   D(7,2,3,8)             -0.0005         -DE/DX =    0.0                 !
 ! D12   D(7,2,3,12)           179.999          -DE/DX =    0.0                 !
 ! D13   D(2,3,12,4)            -0.0011         -DE/DX =    0.0                 !
 ! D14   D(2,3,12,9)          -179.9999         -DE/DX =    0.0                 !
 ! D15   D(8,3,12,4)          -180.0016         -DE/DX =    0.0                 !
 ! D16   D(8,3,12,9)            -0.0004         -DE/DX =    0.0                 !
 ! D17   D(10,4,5,1)          -180.0014         -DE/DX =    0.0                 !
 ! D18   D(10,4,5,11)           -0.0027         -DE/DX =    0.0                 !
 ! D19   D(12,4,5,1)            -0.0002         -DE/DX =    0.0                 !
 ! D20   D(12,4,5,11)         -180.0014         -DE/DX =    0.0                 !
 ! D21   D(5,4,12,3)             0.0006         -DE/DX =    0.0                 !
 ! D22   D(5,4,12,9)           179.9993         -DE/DX =    0.0                 !
 ! D23   D(10,4,12,3)          180.0017         -DE/DX =    0.0                 !
 ! D24   D(10,4,12,9)            0.0005         -DE/DX =    0.0                 !
 --------------------------------------------------------------------------------
 GradGradGradGradGradGradGradGradGradGradGradGradGradGradGradGradGradGrad
Optimisation - high level basis set
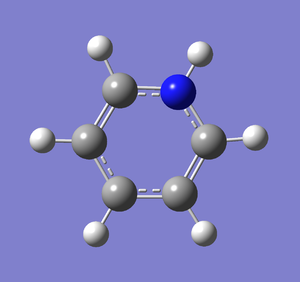
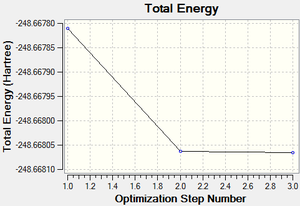
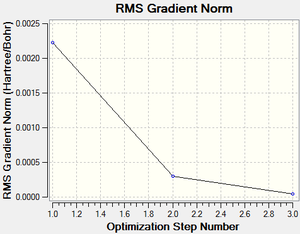
Following the successful optimisation of the pyridinium molecule with a low level basis set, a new optimisation was carried out on the HPC using a higher level basis set. The output log file is linked to here and the link to the D-space file is http://dx.doi.org/10042/23248. A Gaussview image of the optimised molecule is shown in Figure 47.
The optimised molecule was reproduced as a Java file and can be opened by clicking on the Molecule 18 button:
The total energy and gradient curves for the optimised pyridinium molecule are shown in Figures 48 and 49, respectively.
The summary table below shows all the important information about the calculation.
| NC5H6_631G_AVC | ||
|---|---|---|
| File Type | .log | |
| Calculation Type | FOPT | |
| Calculation Method | RB3LYP | |
| Basis Set | 6-31G(d,p) | |
| Charge | 1 | |
| Spin | Singlet | |
| Total energy | -248.66806594 a.u. | |
| RMS Gradient Norm | 0.00004950 a.u. | |
| Imaginary Freq | ||
| Dipole Moment | 9.6404 Debye | |
| Point Group | C1 | |
| Calculation Time | 3 minutes 0.1 seconds | |
The information below, extracted from the output log file, shows that the job has converged and the optimisation was successful.
 Item                     Value        Threshold  Converged?
 Maximum Force            0.000102     0.000450     YES
 RMS     Force            0.000032     0.000300     YES
 Maximum Displacement     0.000861     0.001800     YES
 RMS     Displacement     0.000254     0.001200     YES
 Predicted change in Energy=-1.449365D-07
 Optimization completed.
    -- Stationary point found.
                           ----------------------------
                           !   Optimized Parameters   !
                           ! (Angstroms and Degrees)  !
 --------------------------                            --------------------------
 ! Name  Definition              Value          Derivative Info.                !
 --------------------------------------------------------------------------------
 ! R1    R(1,2)                  1.3988         -DE/DX =    0.0                 !
 ! R2    R(1,5)                  1.3988         -DE/DX =    0.0                 !
 ! R3    R(1,6)                  1.0852         -DE/DX =    0.0                 !
 ! R4    R(2,3)                  1.3838         -DE/DX =    0.0                 !
 ! R5    R(2,7)                  1.0836         -DE/DX =    0.0                 !
 ! R6    R(3,8)                  1.0833         -DE/DX =    0.0                 !
 ! R7    R(3,12)                 1.3524         -DE/DX =    0.0                 !
 ! R8    R(4,5)                  1.3838         -DE/DX =    0.0                 !
 ! R9    R(4,10)                 1.0833         -DE/DX =    0.0                 !
 ! R10   R(4,12)                 1.3523         -DE/DX =    0.0001              !
 ! R11   R(5,11)                 1.0836         -DE/DX =    0.0                 !
 ! R12   R(9,12)                 1.0168         -DE/DX =    0.0001              !
 ! A1    A(2,1,5)              120.0319         -DE/DX =    0.0001              !
 ! A2    A(2,1,6)              119.9843         -DE/DX =   -0.0001              !
 ! A3    A(5,1,6)              119.9838         -DE/DX =   -0.0001              !
 ! A4    A(1,2,3)              119.0948         -DE/DX =    0.0                 !
 ! A5    A(1,2,7)              121.4866         -DE/DX =    0.0                 !
 ! A6    A(3,2,7)              119.4186         -DE/DX =    0.0001              !
 ! A7    A(2,3,8)              123.9168         -DE/DX =    0.0001              !
 ! A8    A(2,3,12)             119.2467         -DE/DX =    0.0                 !
 ! A9    A(8,3,12)             116.8365         -DE/DX =    0.0                 !
 ! A10   A(5,4,10)             123.9125         -DE/DX =    0.0001              !
 ! A11   A(5,4,12)             119.2486         -DE/DX =    0.0                 !
 ! A12   A(10,4,12)            116.8389         -DE/DX =    0.0                 !
 ! A13   A(1,5,4)              119.0923         -DE/DX =    0.0                 !
 ! A14   A(1,5,11)             121.4897         -DE/DX =    0.0                 !
 ! A15   A(4,5,11)             119.418          -DE/DX =    0.0001              !
 ! A16   A(3,12,4)             123.2857         -DE/DX =    0.0                 !
 ! A17   A(3,12,9)             118.3566         -DE/DX =    0.0                 !
 ! A18   A(4,12,9)             118.3577         -DE/DX =    0.0                 !
 ! D1    D(5,1,2,3)             -0.0001         -DE/DX =    0.0                 !
 ! D2    D(5,1,2,7)            180.0            -DE/DX =    0.0                 !
 ! D3    D(6,1,2,3)           -180.0001         -DE/DX =    0.0                 !
 ! D4    D(6,1,2,7)              0.0            -DE/DX =    0.0                 !
 ! D5    D(2,1,5,4)              0.0            -DE/DX =    0.0                 !
 ! D6    D(2,1,5,11)          -179.9999         -DE/DX =    0.0                 !
 ! D7    D(6,1,5,4)            180.0            -DE/DX =    0.0                 !
 ! D8    D(6,1,5,11)             0.0001         -DE/DX =    0.0                 !
 ! D9    D(1,2,3,8)           -180.0            -DE/DX =    0.0                 !
 ! D10   D(1,2,3,12)             0.0001         -DE/DX =    0.0                 !
 ! D11   D(7,2,3,8)              0.0            -DE/DX =    0.0                 !
 ! D12   D(7,2,3,12)          -179.9999         -DE/DX =    0.0                 !
 ! D13   D(2,3,12,4)            -0.0002         -DE/DX =    0.0                 !
 ! D14   D(2,3,12,9)          -179.9999         -DE/DX =    0.0                 !
 ! D15   D(8,3,12,4)           179.9999         -DE/DX =    0.0                 !
 ! D16   D(8,3,12,9)             0.0002         -DE/DX =    0.0                 !
 ! D17   D(10,4,5,1)           179.9998         -DE/DX =    0.0                 !
 ! D18   D(10,4,5,11)           -0.0002         -DE/DX =    0.0                 !
 ! D19   D(12,4,5,1)             0.0            -DE/DX =    0.0                 !
 ! D20   D(12,4,5,11)          179.9999         -DE/DX =    0.0                 !
 ! D21   D(5,4,12,3)             0.0001         -DE/DX =    0.0                 !
 ! D22   D(5,4,12,9)           179.9999         -DE/DX =    0.0                 !
 ! D23   D(10,4,12,3)         -179.9997         -DE/DX =    0.0                 !
 ! D24   D(10,4,12,9)            0.0            -DE/DX =    0.0                 !
 --------------------------------------------------------------------------------
 GradGradGradGradGradGradGradGradGradGradGradGradGradGradGradGradGradGrad
Frequency analysis
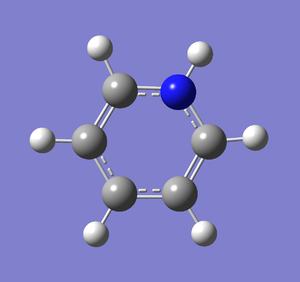
Frequency analysis was carried out on the fully optimised (6-31G(d,p)) structure to confirm the minimum energy structures. The output log file is linked to here and the link to the D-space file is http://dx.doi.org/10042/23249. A Gaussview image of the molecule is shown in Figure 50.
The optimised molecule was reproduced as a Java file and can be opened by clicking on the Molecule 19 button:
The summary table below shows all the important information about the calculation. As you can see, the total energy is the same as that recorded for the optimisation.
| NC5H6_FREQ_AVC | ||
|---|---|---|
| File Type | .log | |
| Calculation Type | FREQ | |
| Calculation Method | RB3LYP | |
| Basis Set | 6-31G(d,p) | |
| Charge | 1 | |
| Spin | Singlet | |
| Total energy | -248.66806594 a.u. | |
| RMS Gradient Norm | 0.00004948 a.u. | |
| Imaginary Freq | 0 | |
| Dipole Moment | 9.6404 Debye | |
| Point Group | C1 | |
| Calculation Time | 4 minutes 37.1 seconds | |
The information below, extracted from the output log file, shows that the job has converged and the optimisation was successful.
 Item                     Value        Threshold  Converged?
 Maximum Force            0.000133     0.000450     YES
 RMS     Force            0.000049     0.000300     YES
 Maximum Displacement     0.000973     0.001800     YES
 RMS     Displacement     0.000338     0.001200     YES
 Predicted change in Energy=-1.515341D-07
 Optimization completed.
    -- Stationary point found.
The output log file also shows the important frequencies of the calculation (see below).
 Low frequencies ---   -6.3814   -0.0003    0.0003    0.0005   11.1870   13.9458
 Low frequencies ---  391.5402  404.4359  620.4576
Population analysis
MO analysis was carried out on the fully optimised pyridinium molecule. The output log file is linked here and the link to the D-space file is http://dx.doi.org/10042/23266.
NBO analysis
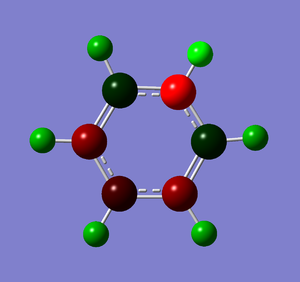
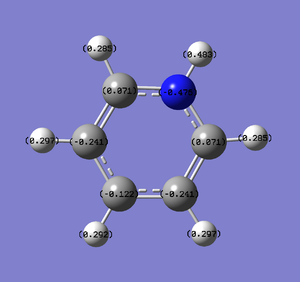
Natural Bond Orbital Analysis was carried out on a molecule of pyridinium. Figure 51 shows a Gaussview image of the charged molecule. Bright red represents a highly negative charge and bright green indicates a highly positive charge. The charge range for the NBO of pyridinium is -0.483 to +0.483.
Borazine
Optimisation - low level basis set
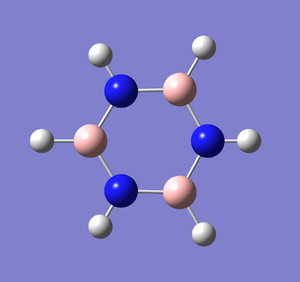
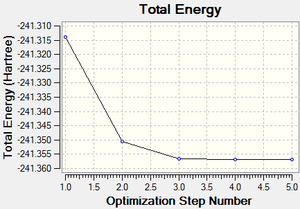
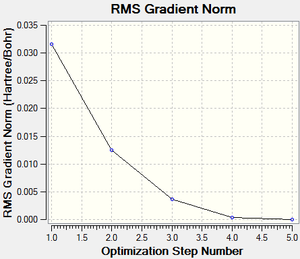
A molecule of borazine was created and optimised in Gaussview. Since it is a fairly large molecule, a low level basis set (3-21G) was initially used to ensure the structure was roughly correct. The output log file of this optimisation is linked to here and the link to the D-space file is http://dx.doi.org/10042/23242. A Gaussview image of the optimised molecule is shown in Figure 53.
The optimised molecule was reproduced as a Java file and can be opened by clicking on the Molecule 20 button:
The summary table below shows the important information about the calculation:
| BORAZINE_321G_AVC | ||
|---|---|---|
| File Type | .log | |
| Calculation Type | FOPT | |
| Calculation Method | RB3LYP | |
| Basis Set | 3-21G | |
| Charge | 0 | |
| Spin | Singlet | |
| Total energy | -241.35696458 a.u. | |
| RMS Gradient Norm | 0.00005974 a.u. | |
| Imaginary Freq | ||
| Dipole Moment | 0.0001 Debye | |
| Point Group | C1 | |
| Calculation Time | 1 minutes 32.2 seconds | |
The total energy curve (Figure 54) shows the program moving along the potential energy surface (PES) of the borazine molecule and finding the minimum energy structure.
The RMS (root mean square) gradient curve (Figure 55) shows that the gradient goes to zero as the minimum is approached.
The information below, extracted from the output log file, shows that the job has converged and the optimisation was successful.
 Item                     Value        Threshold  Converged?
 Maximum Force            0.000096     0.000450     YES
 RMS     Force            0.000030     0.000300     YES
 Maximum Displacement     0.000175     0.001800     YES
 RMS     Displacement     0.000067     0.001200     YES
 Predicted change in Energy=-7.625951D-08
 Optimization completed.
    -- Stationary point found.
                           ----------------------------
                           !   Optimized Parameters   !
                           ! (Angstroms and Degrees)  !
 --------------------------                            --------------------------
 ! Name  Definition              Value          Derivative Info.                !
 --------------------------------------------------------------------------------
 ! R1    R(1,10)                 1.019          -DE/DX =    0.0                 !
 ! R2    R(2,8)                  1.1943         -DE/DX =    0.0001              !
 ! R3    R(3,11)                 1.019          -DE/DX =    0.0                 !
 ! R4    R(4,7)                  1.1943         -DE/DX =    0.0001              !
 ! R5    R(5,12)                 1.019          -DE/DX =    0.0                 !
 ! R6    R(6,9)                  1.1943         -DE/DX =    0.0001              !
 ! R7    R(7,11)                 1.4456         -DE/DX =   -0.0001              !
 ! R8    R(7,12)                 1.4456         -DE/DX =    0.0                 !
 ! R9    R(8,10)                 1.4456         -DE/DX =   -0.0001              !
 ! R10   R(8,11)                 1.4455         -DE/DX =    0.0                 !
 ! R11   R(9,10)                 1.4455         -DE/DX =    0.0                 !
 ! R12   R(9,12)                 1.4456         -DE/DX =   -0.0001              !
 ! A1    A(4,7,11)             121.5043         -DE/DX =    0.0                 !
 ! A2    A(4,7,12)             121.5069         -DE/DX =    0.0                 !
 ! A3    A(11,7,12)            116.9888         -DE/DX =    0.0                 !
 ! A4    A(2,8,10)             121.5015         -DE/DX =    0.0                 !
 ! A5    A(2,8,11)             121.5095         -DE/DX =    0.0                 !
 ! A6    A(10,8,11)            116.989          -DE/DX =    0.0                 !
 ! A7    A(6,9,10)             121.5094         -DE/DX =    0.0                 !
 ! A8    A(6,9,12)             121.5046         -DE/DX =    0.0                 !
 ! A9    A(10,9,12)            116.986          -DE/DX =    0.0                 !
 ! A10   A(1,10,8)             118.4985         -DE/DX =    0.0                 !
 ! A11   A(1,10,9)             118.4888         -DE/DX =    0.0                 !
 ! A12   A(8,10,9)             123.0127         -DE/DX =    0.0                 !
 ! A13   A(3,11,7)             118.493          -DE/DX =    0.0                 !
 ! A14   A(3,11,8)             118.4965         -DE/DX =    0.0                 !
 ! A15   A(7,11,8)             123.0106         -DE/DX =    0.0                 !
 ! A16   A(5,12,7)             118.5014         -DE/DX =    0.0                 !
 ! A17   A(5,12,9)             118.4857         -DE/DX =    0.0                 !
 ! A18   A(7,12,9)             123.0129         -DE/DX =    0.0                 !
 ! D1    D(4,7,11,3)             0.0001         -DE/DX =    0.0                 !
 ! D2    D(4,7,11,8)           180.0003         -DE/DX =    0.0                 !
 ! D3    D(12,7,11,3)         -180.0004         -DE/DX =    0.0                 !
 ! D4    D(12,7,11,8)           -0.0003         -DE/DX =    0.0                 !
 ! D5    D(4,7,12,5)             0.0003         -DE/DX =    0.0                 !
 ! D6    D(4,7,12,9)          -179.9994         -DE/DX =    0.0                 !
 ! D7    D(11,7,12,5)          180.0009         -DE/DX =    0.0                 !
 ! D8    D(11,7,12,9)            0.0011         -DE/DX =    0.0                 !
 ! D9    D(2,8,10,1)             0.0003         -DE/DX =    0.0                 !
 ! D10   D(2,8,10,9)           179.9998         -DE/DX =    0.0                 !
 ! D11   D(11,8,10,1)         -180.0001         -DE/DX =    0.0                 !
 ! D12   D(11,8,10,9)           -0.0006         -DE/DX =    0.0                 !
 ! D13   D(2,8,11,3)            -0.0002         -DE/DX =    0.0                 !
 ! D14   D(2,8,11,7)          -180.0004         -DE/DX =    0.0                 !
 ! D15   D(10,8,11,3)          180.0002         -DE/DX =    0.0                 !
 ! D16   D(10,8,11,7)            0.0            -DE/DX =    0.0                 !
 ! D17   D(6,9,10,1)             0.0004         -DE/DX =    0.0                 !
 ! D18   D(6,9,10,8)          -179.9992         -DE/DX =    0.0                 !
 ! D19   D(12,9,10,1)          180.0009         -DE/DX =    0.0                 !
 ! D20   D(12,9,10,8)            0.0014         -DE/DX =    0.0                 !
 ! D21   D(6,9,12,5)            -0.0009         -DE/DX =    0.0                 !
 ! D22   D(6,9,12,7)           179.9989         -DE/DX =    0.0                 !
 ! D23   D(10,9,12,5)          179.9986         -DE/DX =    0.0                 !
 ! D24   D(10,9,12,7)           -0.0017         -DE/DX =    0.0                 !
 --------------------------------------------------------------------------------
 GradGradGradGradGradGradGradGradGradGradGradGradGradGradGradGradGradGrad
Optimisation - high level basis set
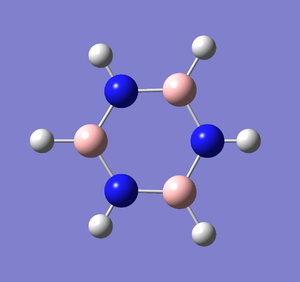
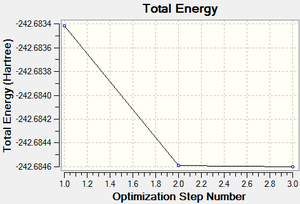
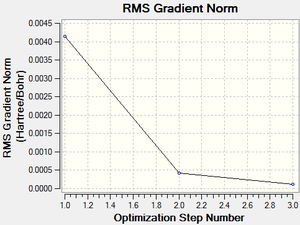
Following the successful optimisation of the borazine molecule with a low level basis set, a new optimisation was carried out on the HPC using a higher level basis set. The output log file is linked to here and the link to the D-space is http://dx.doi.org/10042/23243. A Gaussview image of the optimised molecule is shown in Figure 56.
The optimised molecule was reproduced as a Java file and can be opened by clicking on the Molecule 21 button:
The total energy and gradient curves for the optimised borazine molecule are shown in Figures 57 and 58, respectively.
The summary table below shows all the important information about the calculation.
| BORAZINE_631G_AVC | ||
|---|---|---|
| File Type | .log | |
| Calculation Type | FOPT | |
| Calculation Method | RB3LYP | |
| Basis Set | 6-31G(d,p) | |
| Charge | 0 | |
| Spin | Singlet | |
| Total energy | -242.68459787 a.u. | |
| RMS Gradient Norm | 0.00011477 a.u. | |
| Imaginary Freq | ||
| Dipole Moment | 0.0002 Debye | |
| Point Group | C1 | |
| Calculation Time | 2 minutes 52.1 seconds | |
The information below, extracted from the output log file, shows that the job has converged and the optimisation was successful.
 Item                     Value        Threshold  Converged?
 Maximum Force            0.000121     0.000450     YES
 RMS     Force            0.000052     0.000300     YES
 Maximum Displacement     0.000584     0.001800     YES
 RMS     Displacement     0.000224     0.001200     YES
 Predicted change in Energy=-4.245908D-07
 Optimization completed.
    -- Stationary point found.
                           ----------------------------
                           !   Optimized Parameters   !
                           ! (Angstroms and Degrees)  !
 --------------------------                            --------------------------
 ! Name  Definition              Value          Derivative Info.                !
 --------------------------------------------------------------------------------
 ! R1    R(1,10)                 1.0098         -DE/DX =    0.0                 !
 ! R2    R(2,8)                  1.195          -DE/DX =    0.0001              !
 ! R3    R(3,11)                 1.0098         -DE/DX =    0.0                 !
 ! R4    R(4,7)                  1.195          -DE/DX =    0.0001              !
 ! R5    R(5,12)                 1.0098         -DE/DX =    0.0                 !
 ! R6    R(6,9)                  1.195          -DE/DX =    0.0001              !
 ! R7    R(7,11)                 1.4306         -DE/DX =    0.0                 !
 ! R8    R(7,12)                 1.4306         -DE/DX =    0.0                 !
 ! R9    R(8,10)                 1.4306         -DE/DX =    0.0                 !
 ! R10   R(8,11)                 1.4306         -DE/DX =    0.0                 !
 ! R11   R(9,10)                 1.4306         -DE/DX =    0.0                 !
 ! R12   R(9,12)                 1.4306         -DE/DX =    0.0                 !
 ! A1    A(4,7,11)             121.4542         -DE/DX =   -0.0001              !
 ! A2    A(4,7,12)             121.4549         -DE/DX =   -0.0001              !
 ! A3    A(11,7,12)            117.0909         -DE/DX =    0.0001              !
 ! A4    A(2,8,10)             121.4534         -DE/DX =   -0.0001              !
 ! A5    A(2,8,11)             121.4557         -DE/DX =   -0.0001              !
 ! A6    A(10,8,11)            117.0909         -DE/DX =    0.0001              !
 ! A7    A(6,9,10)             121.456          -DE/DX =   -0.0001              !
 ! A8    A(6,9,12)             121.4546         -DE/DX =   -0.0001              !
 ! A9    A(10,9,12)            117.0895         -DE/DX =    0.0001              !
 ! A10   A(1,10,8)             118.5469         -DE/DX =    0.0001              !
 ! A11   A(1,10,9)             118.5434         -DE/DX =    0.0001              !
 ! A12   A(8,10,9)             122.9097         -DE/DX =   -0.0001              !
 ! A13   A(3,11,7)             118.5448         -DE/DX =    0.0001              !
 ! A14   A(3,11,8)             118.5459         -DE/DX =    0.0001              !
 ! A15   A(7,11,8)             122.9092         -DE/DX =   -0.0001              !
 ! A16   A(5,12,7)             118.5479         -DE/DX =    0.0001              !
 ! A17   A(5,12,9)             118.5423         -DE/DX =    0.0001              !
 ! A18   A(7,12,9)             122.9098         -DE/DX =   -0.0001              !
 ! D1    D(4,7,11,3)             0.0003         -DE/DX =    0.0                 !
 ! D2    D(4,7,11,8)           180.0002         -DE/DX =    0.0                 !
 ! D3    D(12,7,11,3)         -180.0003         -DE/DX =    0.0                 !
 ! D4    D(12,7,11,8)           -0.0003         -DE/DX =    0.0                 !
 ! D5    D(4,7,12,5)             0.0001         -DE/DX =    0.0                 !
 ! D6    D(4,7,12,9)          -180.0002         -DE/DX =    0.0                 !
 ! D7    D(11,7,12,5)          180.0006         -DE/DX =    0.0                 !
 ! D8    D(11,7,12,9)            0.0004         -DE/DX =    0.0                 !
 ! D9    D(2,8,10,1)             0.0004         -DE/DX =    0.0                 !
 ! D10   D(2,8,10,9)           179.9998         -DE/DX =    0.0                 !
 ! D11   D(11,8,10,1)         -180.0001         -DE/DX =    0.0                 !
 ! D12   D(11,8,10,9)           -0.0006         -DE/DX =    0.0                 !
 ! D13   D(2,8,11,3)             0.0            -DE/DX =    0.0                 !
 ! D14   D(2,8,11,7)          -180.0            -DE/DX =    0.0                 !
 ! D15   D(10,8,11,3)          180.0004         -DE/DX =    0.0                 !
 ! D16   D(10,8,11,7)            0.0005         -DE/DX =    0.0                 !
 ! D17   D(6,9,10,1)            -0.0005         -DE/DX =    0.0                 !
 ! D18   D(6,9,10,8)          -179.9999         -DE/DX =    0.0                 !
 ! D19   D(12,9,10,1)          180.0001         -DE/DX =    0.0                 !
 ! D20   D(12,9,10,8)            0.0007         -DE/DX =    0.0                 !
 ! D21   D(6,9,12,5)            -0.0002         -DE/DX =    0.0                 !
 ! D22   D(6,9,12,7)           180.0            -DE/DX =    0.0                 !
 ! D23   D(10,9,12,5)         -180.0008         -DE/DX =    0.0                 !
 ! D24   D(10,9,12,7)           -0.0005         -DE/DX =    0.0                 !
 --------------------------------------------------------------------------------
 GradGradGradGradGradGradGradGradGradGradGradGradGradGradGradGradGradGrad
Frequency analysis
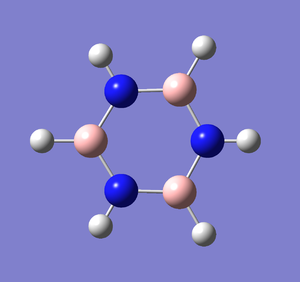
Frequency analysis was carried out on the fully optimised (6-31G(d,p)) structure to confirm the minimum energy structures. The output log file is linked to here and the link to the D-space file is http://dx.doi.org/10042/23244. A Gaussview image of the molecule is shown in Figure 59.
The optimised molecule was reproduced as a Java file and can be opened by clicking on the Molecule 22 button:
The summary table below shows all the important information about the calculation. As you can see, the total energy is the same as that recorded for the optimisation.
| BORAZINE_FREQ_AVC | ||
|---|---|---|
| File Type | .log | |
| Calculation Type | FREQ | |
| Calculation Method | RB3LYP | |
| Basis Set | 6-31G(d,p) | |
| Charge | 0 | |
| Spin | Singlet | |
| Total energy | -242.68459787 a.u. | |
| RMS Gradient Norm | 0.00011475 a.u. | |
| Imaginary Freq | 0 | |
| Dipole Moment | 0.0002 Debye | |
| Point Group | C1 | |
| Calculation Time | 5 minutes 31.5 seconds | |
The information below, extracted from the output log file, shows that the job has converged and the optimisation was successful.
 Item                     Value        Threshold  Converged?
 Maximum Force            0.000282     0.000450     YES
 RMS     Force            0.000115     0.000300     YES
 Maximum Displacement     0.000590     0.001800     YES
 RMS     Displacement     0.000277     0.001200     YES
 Predicted change in Energy=-4.266156D-07
 Optimization completed.
    -- Stationary point found.
 GradGradGradGradGradGradGradGradGradGradGradGradGradGradGradGradGradGrad
The output log file also shows the important frequencies of the calculation (see below).
 Low frequencies ---   -9.5775   -0.0008   -0.0005    0.0002    3.6840   11.3544
 Low frequencies ---  288.6082  290.5790  404.6112
Analysis of charge distribution
The table below summarises the charge distributions of benzene, boratabenzene and pyridinium.
| Benzene | Boratazene | Pyridinium |
|---|---|---|
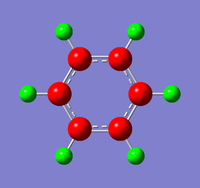 |
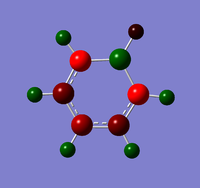 |
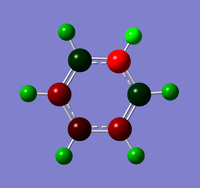
|
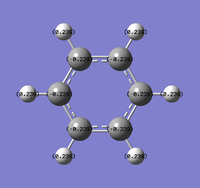 |
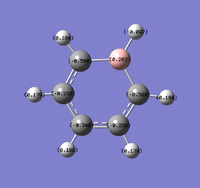 |
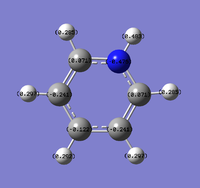
|
In the benzene molecule, the delocalised electrons are evenly spread around the six carbon atoms. The distribution of negative charge around the ring results in all six carbon atoms being equally electronegative, with a charge value of -0.239. The six electropositive hydrogen atoms donate electron density into the carbon ring, with an equal charge distribution of opposite charge (+0.239).
In the boratabenzene molecule, the boron atom is electropositive with a charge of +0.202. In order to counteract this positive charge, the five carbon atoms in the ring all vary in their degree of electronegativity. The two neighbouring carbon atoms have a large negative charge of -0.588 and appear bright red in the Gaussview image, whereas the remaining three carbon atoms are less electronegative. Furthermore, the hydrogen atom bonded to the boron appears to have a very small negative charge, which is influenced by the electropositivity of the boron as well as the -1 charge of the system. The other five hydrogen atoms are all positively charged, with various values depending on the carbon ring to which they are attached.
The pyridinium molecule is, in some ways, opposite to the boratabenzene molecule. The nitrogen atom is electronegative as expected, with a charge of -0.476. In order to compensate for this highly negative charge, the five carbon atoms in the ring vary greatly in their charge. The two neighbouring carbon atoms are slightly electropositive with a value of +0.071, whereas the other three carbons are electronegative due to delocalisation of charge around the system. Unlike the boratabenzene molecule, all six hydrogen atoms in pyridinium are positively charged. The hydrogen attached to the nitrogen atom is most electropositive, with a charge equal and opposite to the nitrogen, as denoted by the bright green colour. The other five hydrogen atoms are less electropositive with values between +0.285 and +0.297, and they all appear to be the same shade of green.
Conclusion
Computational chemistry is a very important tool because it allows us to carry out calculations that would otherwise be too time-consuming and complicated to solve. Calculations can be solved in a series of steps using Gaussview, which uses a series of approximations to solve the important Schrodinger equation.
