Rep:Mod:XYZ1257
INORGANIC COMPUTATIONAL LABORATORY - WEEK 1
Optimisation of BH3
1st optimisation
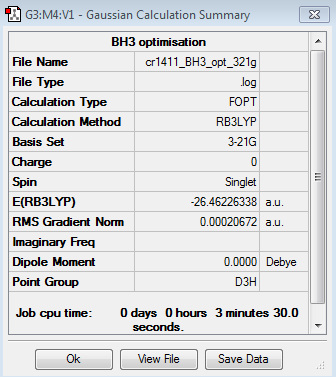
The results of the first optimisation of the BH3 molecule are given below:
Optimised B-H bond distance: 1.19 Å
Optimised H-B-H angle: 120.0°
Total energy of optimised molecule: E1 = -26.46226338 a.u.
Item               Value     Threshold  Converged?
 Maximum Force            0.000413     0.000450     YES
 RMS     Force            0.000271     0.000300     YES
 Maximum Displacement     0.001610     0.001800     YES
 RMS     Displacement     0.001054     0.001200     YES
 Predicted change in Energy=-1.071764D-06
 Optimization completed.
    -- Stationary point found.
The optimisation is converged.
2nd optimisation
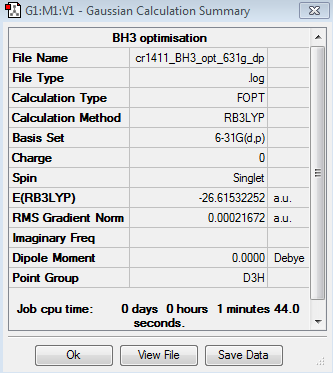
The results of the second optimisation of the BH3 molecule are summarised below:
Optimised B-H bond distance: 1.19 Å
Optimised H-B-H angle: 120.0°
Total energy of optimised molecule: E2 = -26.61532252 a.u.
Item               Value     Threshold  Converged?
 Maximum Force            0.000433     0.000450     YES
 RMS     Force            0.000284     0.000300     YES
 Maximum Displacement     0.001702     0.001800     YES
 RMS     Displacement     0.001114     0.001200     YES
 Predicted change in Energy=-1.189019D-06
 Optimization completed.
    -- Stationary point found.
The optimisation is converged.
Optimisation of GaBr3
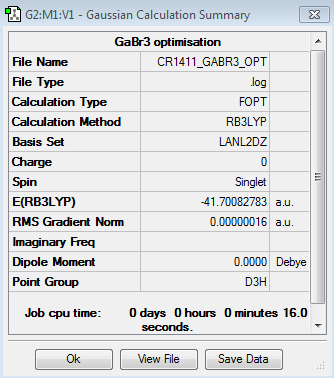
The optimisation of the GaBr3 molecule gives the following results:
https://spectradspace.lib.imperial.ac.uk:8443/dspace/handle/10042/25224
Optimised Ga-Br bond distance: 2.35 Å, lit.[1] 2.42 Å. The value found in literature is close enough to the experimentally determined bond distance; it confirms the optimisation was run successfully (this value is here used to provide a rough estimate of the actual bond distance and is not meant for a comparative study purpose).
Optimised Br-Ga-Br bond angle: 120.0°
Item Value Threshold Converged?
Maximum Force 0.000000 0.000450 YES
RMS Force 0.000000 0.000300 YES
Maximum Displacement 0.000003 0.001800 YES
RMS Displacement 0.000002 0.001200 YES
Predicted change in Energy=-1.282681D-12
Optimization completed.
-- Stationary point found.
The optimisation is converged.
Optimisation of BBr3
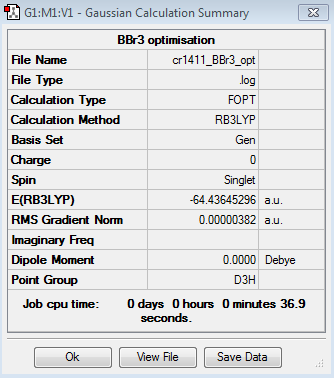
The results of the optimisation of the BBr3 molecule are the following:
https://spectradspace.lib.imperial.ac.uk:8443/dspace/handle/10042/25245
Optimised B-Br bond distance: 1.93 Å
Optimised Br-B-Br angle: 120.0°
Item Value Threshold Converged?
Maximum Force 0.000008 0.000450 YES
RMS Force 0.000005 0.000300 YES
Maximum Displacement 0.000036 0.001800 YES
RMS Displacement 0.000023 0.001200 YES
Predicted change in Energy=-4.026784D-10
Optimization completed.
-- Stationary point found.
The optimisation is converged.
Bond distance comparative analysis
The bond distances for the BH3, BBr3 and GaBr3 molecules are summarised in Table 1. below:
| B-H | B-Br | Ga-Br |
| 1.19 | 1.93 | 2.35 |
The bond length increases from left to right in the table, corresponding to a weakening of the bond.[2] In all three compounds, the difference in Pauling electronegativity between the central atom and the ligands is lower than 1.7 (cf. Table 2.), indicating the presence of covalent bonds for all three compounds;[3] the polarity of the bond increasing from left to right of the table.
| B-H | B-Br | Ga-Br |
| 0.16 | 0.92 | 1.15 |
The difference in bond length and hence bond strength can be mainly rationalised on the basis of both the size of the atoms' orbitals involved in bonding and the extent of orbital overlap between the central atom and its ligands. In the case of BH3, both the 1s orbital of the hydrogens and the hybridised sp2 orbitals of the boron atom are small, as the two elements are located in period 1 and 2, respectively. The overlap between the hydrogens' 1s orbitals and boron's sp2 orbitals is therefore relatively good, hence the relatively strong bonds formed in BH3.
For both BBr3 and GaBr3, the molecules benefit from an extra stabilisation resulting from the π-donation from the lone pair of electrons present on the Br atom to the central atom.[5] This stabilisation is however more significant in GaBr3, where the 4p-4p overlap between Ga and Br is greater than the 2p-4p overlap between B and Br. The bonds formed in GaBr3 should therefore be expected to be stronger and hence shorter than the bonds present in BBr3. However, the bigger size of Ga with respect to B inevitably results in longer Ga-Br bond distance than for B-Br. Another factor influencing bond strength and hence bond length is the inert pair effect:[6] both B and Ga possess an oxidation state of 3. Nevertheless, the promotional energy is much higher in the case of Ga than Br, since the s-p gap increases down a given group. This is why stronger (and hence shorter) bonds are formed in the case of BBr3. Therefore, despite the greater orbital overlap factor in GaBr3 with respect to BBr3 (which should result in smaller Ga-Br bond distance with respect to the B-Br one), both Ga's bigger atomic size and higher promotional energy result in larger Ga-Br bonds with respect to B-Br bonds.
In some structures, gaussview does not draw the bonds where we would expect them to be, however this does not mean that these bonds are nonexistent: bonds can be understood to be an accumulation of the total electron density[7] and are hence only conceptual.
Frequency analysis of BH3
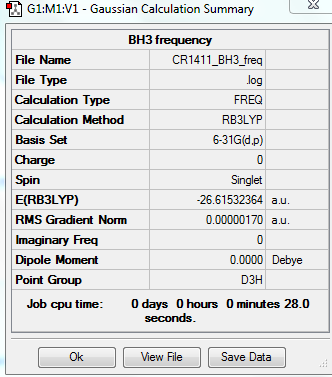
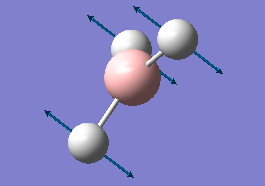
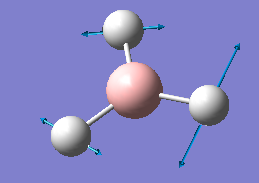
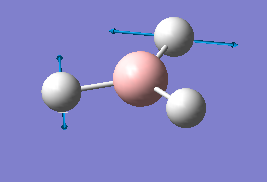
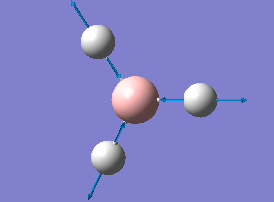
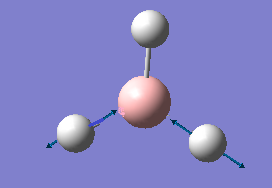
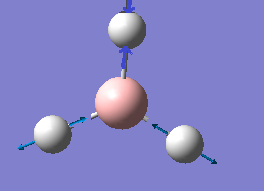
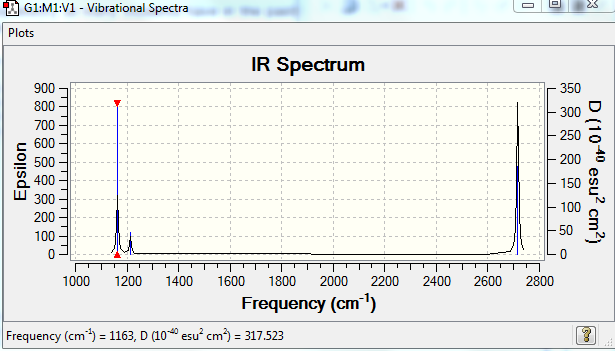
The results of the frequency analysis for the BH3 molecule are given below; the six vibrational modes are summarised in Table 3.
Low frequencies --- -6.9470 -6.9094 -0.0273 0.0005 0.7219 6.7701
Low frequencies --- 1163.0029 1213.1581 1213.1583
The frequencies are "low" (i.e. they are located in the range ±15 cm-1), and there are no negative frequencies.
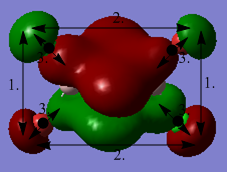
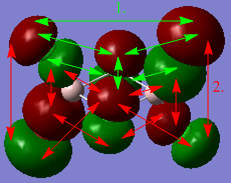
The first three vibrations are bending vibrations and correspond to a change in H-B-H angles.[8] They are lower in energy than the following three stretching vibrations, which correspond to a change in 2 adjacent H atoms' inter-atomic distance along their respective B-H bonds.[9] Although there are 6 vibrational modes for the BH3 molecule which would imply seeing 6 peaks in its IR spectrum, only 3 peaks are visible. This is due to the fact that the vibrations 2 and 3 are degenerate, as are vibrations 5 and 6, i.e. the second peak visible in the IR spectrum corresponds to both vibrations 2 and 3, whilst the third peak corresponds to vibrations 5 and 6. Furthermore, for the vibration no 4, there is no net change in the molecule's dipole moment, the condition for IR absorption occurring.[10] The dipole arising from the movement of 2 adjacent H atoms effectively cancels out with the one of the third H atom. There is thus no net absorption in the spectrum (this is confirmed by the value of the intensity which is zero). Hence the only 3 peaks observed in the IR spectrum instead of the 6 expected.
Frequency analysis of GaBr3
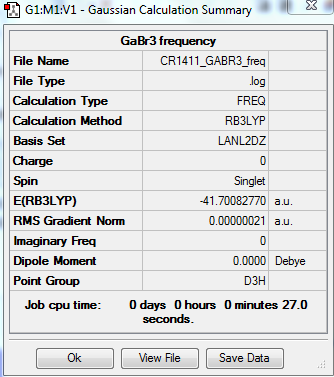
The results of the frequency analysis for the GaBr3 molecule are given below:
Low frequencies --- -1.4877 -0.0015 -0.0002 0.0096 0.6540 0.6540
Low frequencies --- 76.3920 76.3924 99.6767
The frequencies are "low" (i.e. they are located in the range ±15 cm-1), and there are no negative frequencies.
https://spectradspace.lib.imperial.ac.uk:8443/dspace/handle/10042/25332
Unlike for the BH3 molecule, the lowest real normal mode is E' in the case of GaBr3.
Comparison of the vibrational frequencies of BH3 and GaBr3
| BH3 frequency (cm-1) | Mode | Intensity | GaBr3 frequency (cm-1) | Mode | Intensity |
|---|---|---|---|---|---|
| 1163 | A2" | 93 | 76 | E' | 3 |
| 1213 | E' | 14 | 76 | E' | 3 |
| 1213 | E' | 14 | 100 | A2" | 9 |
| 2582 | A1' | 0 | 197 | A1' | 0 |
| 2716 | E' | 126 | 316 | E' | 57 |
| 2716 | E' | 126 | 316 | E' | 57 |
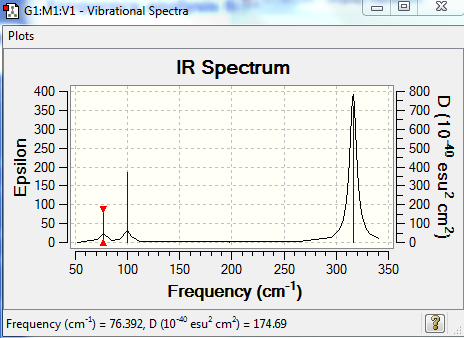
The IR spectrum of GaBr3 is similar to the one of BH3: both have three peaks corresponding to three
infrared absorptions. Just like the BH3 molecule, GaBr3 has the D3H point group and has thus the same vibrational modes. It will therefore have two sets of doubly degenerate orbitals giving rise to only two peaks in the IR spectrum instead of the four expected. In addition, the A1' mode will not appear in the spectrum either.
However, in the case of GaBr3, the spectrum is significantly shifted to the left, i.e. the frequency values are much lower. This can be rationalised as follows: the value of the frequency is given by the following equation f=(1/2πc)*(k/µ)0.5, with c the light velocity in vacuum, k the bond strength and µ the reduced mass of the molecule; µ=(m1*m2)/(m1+m2), where m1 and m2 are the masses of the atoms considered.
The frequency is thus proportional to both the bond strength and inversely proportional to the reduced mass of the molecule. The reduced masses of BH3 and GaBr3 are 0.92 and 37.2, respectively: GaBr3 is a much heavier molecule than BH3. Hence, although the Ga-Br bond is weaker than the B-H bond (cf. above), the reduced mass factor outweighs the bond strength factor k. GaBr3 being a much heavier molecule than BH3, the vibrational frequencies are significantly lower for GaBr3.
It can further be noted that the intensity of the peaks is much higher in the case of BH3, which suggests a greater change in dipole moment for this compound with respect to GaBr3.
Moreover, there has been a reordering of the A2" and E' modes for the GaBr3 molecule: the A2" mode comes before the E' mode for BH3, but comes after E' for GaBr3. The E' and A2" levels are very close in energy and can actually rearrange from one compound to the other.
The method and basis set define the number of functions that will be employed to study the electronic structure of a given molecule; they thus define the degree of complexity that is used to study the system and must be kept unchanged for both the optimisation and frequency analysis calculations.[11] Indeed, one would not be able to compare the results obtained for the frequency to the ones obtained for the optimisation should the degree of complexity differ between the two calculations.
Carrying out a frequency analysis allows us to find the second derivative of the potential energy surface with respect to the internuclear distance and therefore reveal the presence of any minimum, which is equivalent to having all frequencies positive. The frequency analysis further gives the infrared and Raman modes, which can then be confronted with the experimental results obtained.[12]
The nine "Low frequencies" correspond to each movement performed by the center of mass the molecule studied.[13] The first three negative are translations, the following three rotations and the last three are vibrations.[14]
NBO Analysis
Molecular orbitals of BH3
The population analysis can be found here:
https://spectradspace.lib.imperial.ac.uk:8443/dspace/handle/10042/25733
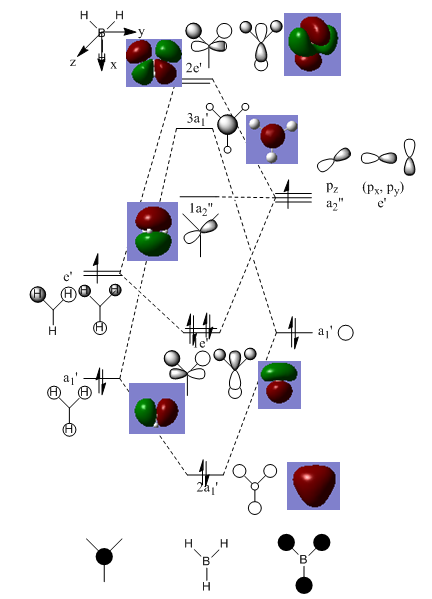
The MO diagram of BH3 is the following:[15]
Whilst the LCAO MOs resemble the "real" computed MOs, there are still significant differences between the two types of molecular orbitals. The computed MOs are much more complex than the ones constructed from the LCAO method: the fomer present a higher degree of delocalisation than the latter. The MOs constructed from the LCAO method allow to come up with a relatively good approximation of the real MOs; they are used to get a rough estimation of what the real MOs look like but cannot they substitute the actual MOs which need to be determined computationally.
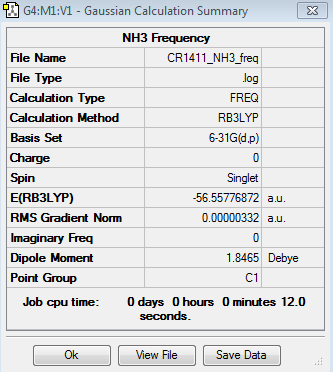
Optimisation of NH3
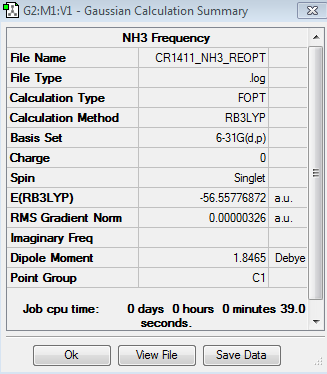
The results for the optimisation of the NH3 molecule are given below:
Item Value Threshold Converged?
Maximum Force 0.000008 0.000015 YES
RMS Force 0.000003 0.000010 YES
Maximum Displacement 0.000008 0.000060 YES
RMS Displacement 0.000006 0.000040 YES
Predicted change in Energy=-9.206820D-11
Optimization completed.
-- Stationary point found.
The optimisation is converged.
Frequency analysis of NH3
The results of the frequency analysis for the NH3 molecule are summarised below:
Low frequencies --- -3.6810 0.0004 0.0012 0.0014 5.2652 7.1126
Low frequencies --- 1089.3805 1693.9291 1693.9387
The frequencies are "low" (i.e. they are located in the range ±15 cm-1), and there are no negative frequencies.
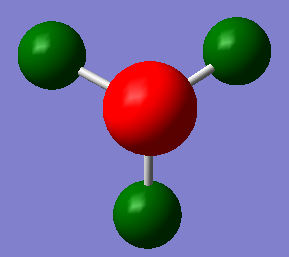
Population Analysis of NH3
The population analysis for the NH3 molecule can be found here:
https://spectradspace.lib.imperial.ac.uk:8443/dspace/handle/10042/25382
The charge distribution of the NH3 molecule gives the following results:
The charge range is -1.0e to +1.0e; the specific NBO charges for the nitrogen and hydrogen atoms are -1.125e and 0.375e, respectively.
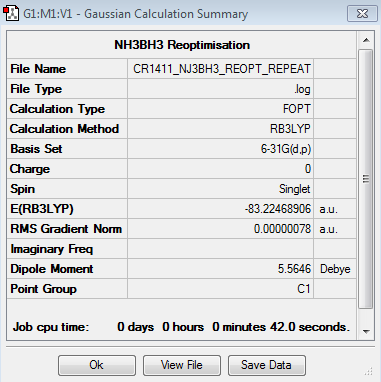
Association energy for NH3BH3
Optimisation
The results of the optimisation of the NH3BH3 molecule are the following:
 Item Value Threshold Converged?
Maximum Force 0.000002 0.000015 YES
RMS Force 0.000000 0.000010 YES
Maximum Displacement 0.000024 0.000060 YES
RMS Displacement 0.000010 0.000040 YES
Predicted change in Energy=-1.877361D-11
Optimization completed.
-- Stationary point found.
The optimisation is converged.
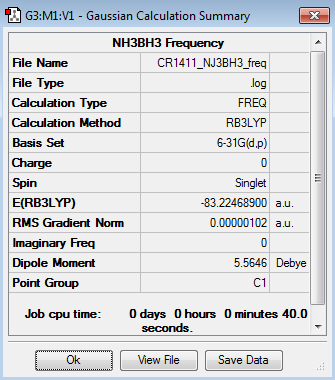
Frequency analysis
The results of the frequency analysis for the NH3BH3 molecule are given below:
Low frequencies --- -6.9846 -4.7856 -2.5584 -0.0010 -0.0009 -0.0008
Low frequencies --- 263.3829 632.9461 638.3612
The frequencies are "low" (i.e. they are located in the range ±15 cm-1), and there are no negative frequencies.
Result
The energies of NH3, BH3 and c are summarised in Table 5.
| NH3 | BH3 | NH3BH3 |
| -56.55776872 | -26.61532252 | -83.22468906 |
The association energy for the NH3BH3 adduct can then be determined:
ΔE=E(NH3BH3)-[E(NH3)+E(BH3)]
hence ΔE=-83.22468906-[-56.55776872-26.61532252]
hence ΔE=-0.05159782 a.u.
hence ΔE=-0.05159782*2625.50 KJ/mol=-135 KJ/mol, lit[16] -109 KJ/mol.
ΔE<0: the reaction is exo-energetic. The product formed lies lower in energy than the starting materials; NH3BH3 is thus a more stable molecule than the isolated NH3 and BH3.
MINI-PROJECT: LEWIS ACIDS AND BASES: ISOMERS OF Al2Br2Cl4 - WEEK 2
Introduction
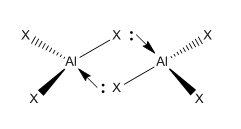
Group 13 elements have been introduced in the 1st year inorganic course "Periodicity and Inorganic reactivity"[17] where ways of relieving electron deficiency in Lewis acidic AlX3 species (6 valence electrons) were investigated. It was shown that AlX3 species were able to form dimers in order to complete their octet:
The two bridging X atoms form bonds with one Aluminium atom by σ-donation of their lone pair into the empty sp3 hybridised orbital of the Al atom. This project aims to investigate the bonding in the four conformers of the Al2Br2Cl4 molecule by carrying out an optimisation and a subsequent frequency analysis of the different structures. These were then used to determine the relative stability of the four conformers.
Results
This study involved using pseudo-potentials for the calculations to be carried out: a full basis set 6-31G(d,p) was selected for Al and Cl whilst a PP LANL2DZdp was used for Br. The results are listed below for each isomer. All four structures had to be re-optimised with entering "int=ultrafine scf=conver=9" as additional keyword before carrying out the frequency analysis, as the frequency analysis carried out after a first optimisation did not give the expected range of ±15 cm-1 for the "Low frequencies". Furthermore, the symmetry was not imposed for any calculation; the point group of each conformer was determined by using a flow chart.
1st isomer
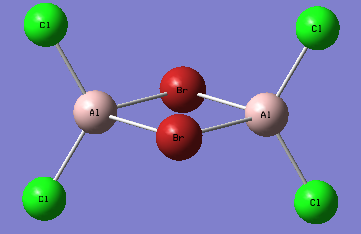
A first isomer of Al2Br2Cl4 has two bridging bromine atoms with four terminal chlorine atoms.
The molecule is not linear, it possesses a principal rotation axis C2, 3 C2 perpendicular to it and an internal mirror plane σH. Hence its point group is D2h.
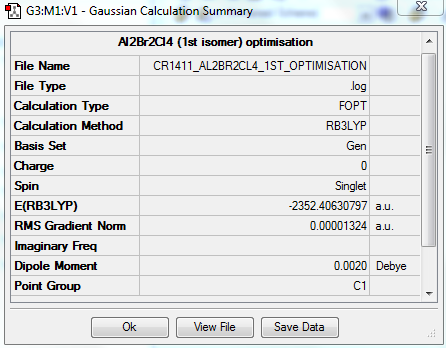
OPTIMISATION
https://spectradspace.lib.imperial.ac.uk:8443/dspace/handle/10042/25581
Item Value Threshold Converged?
Maximum Force 0.000026 0.000450 YES
RMS Force 0.000012 0.000300 YES
Maximum Displacement 0.000852 0.001800 YES
RMS Displacement 0.000322 0.001200 YES
Predicted change in Energy=-2.227178D-08
Optimization completed.
-- Stationary point found.
The optimisation is converged.
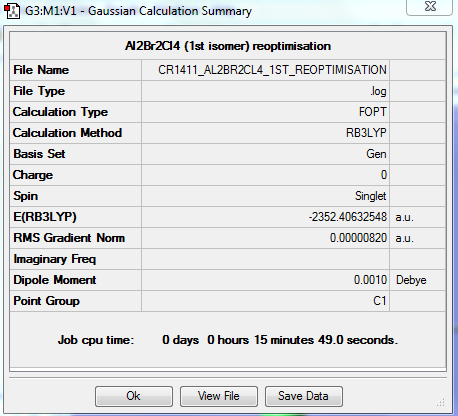
REOPTIMISATION
https://spectradspace.lib.imperial.ac.uk:8443/dspace/handle/10042/25626
Item Value Threshold Converged?
Maximum Force 0.000017 0.000450 YES
RMS Force 0.000007 0.000300 YES
Maximum Displacement 0.000810 0.001800 YES
RMS Displacement 0.000311 0.001200 YES
Predicted change in Energy=-1.468216D-08
Optimization completed.
-- Stationary point found.
The optimisation is converged.
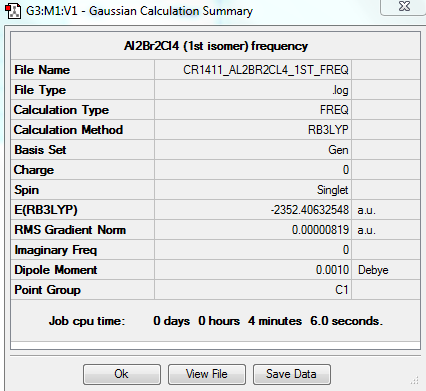
FREQUENCY ANALYSIS
https://spectradspace.lib.imperial.ac.uk:8443/dspace/handle/10042/25627
Low frequencies --- -0.8250 -0.0001 0.0018 0.0024 1.2292 1.3892
Low frequencies --- 16.0692 63.6225 86.1118
The frequencies are "low" (i.e. they are located in the range ±15 cm-1), and there are no negative frequencies.
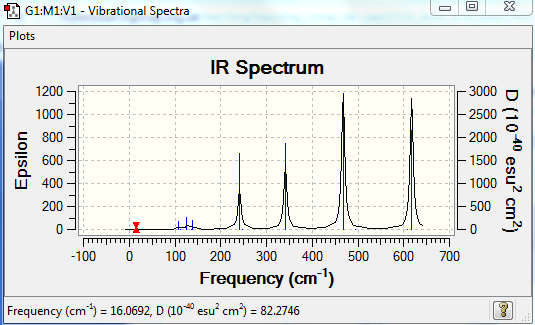
The frequency analysis reveals 18 vibrational modes - they are summarised in Table 6. 10 of these have a zero intensity, that is the overall dipole moment is zero and there is thus no absorption of energy. This first isomer is indeed highly symmetric and has therefore many infrared inactive vibrational modes (the dipole moment cancels out). The 8 remaining frequencies give rise to energy absorption, however the first frequency has a very low intensity and is therefore not visible in the spectrum. Hence the only 7 peaks observed in the spectrum.
| Mode | Frequency (cm-1) | Intensity | IR active |
|---|---|---|---|
| 1 | 16 | 0.3 | yes but not visible on spectrum (intensity too low) |
| 2 | 64 | 0 | no |
| 3 | 86 | 0 | no |
| 4 | 87 | 0 | no |
| 5 | 108 | 5 | yes |
| 6 | 111 | 0 | no |
| 7 | 126 | 8 | yes |
| 8 | 135 | 0 | no |
| 9 | 138 | 7 | yes |
| 10 | 163 | 0 | no |
| 11 | 197 | 0 | no |
| 12 | 241 | 100 | yes |
| 13 | 247 | 0 | no |
| 14 | 341 | 161 | yes |
| 15 | 468 | 346 | yes |
| 16 | 494 | 0 | no |
| 17 | 609 | 0 | no |
| 18 | 617 | 332 | yes |
The first four IR-active modes are bending modes: they are low in energy. Moreover, they give rise to a small change in dipole moment and hence the frequencies are of low intensity (the greater the change in dipole moment, the greater the intensity). The following four IR-active modes are stretching modes and are therefore higher in energy. The change in dipole moment is much greater and so is the intensity. Hence the four intense peaks observed at 241, 341, 468 and 617 cm-1.
2nd isomer
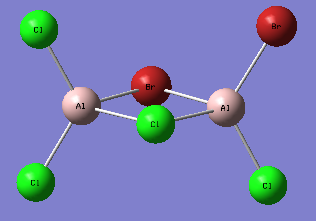
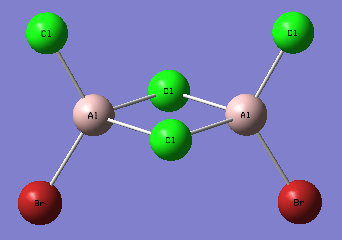
A second isomer of the Al2Br2Cl4 has one bridging Br atom and one bridging Cl atom.
The molecule is not linear, does not have any rotation axis, plane σ or center of inversion. Hence its point group is C1.
OPTIMISATION
https://spectradspace.lib.imperial.ac.uk:8443/dspace/handle/10042/25583
 Item Value Threshold Converged?
Maximum Force 0.000030 0.000450 YES
RMS Force 0.000014 0.000300 YES
Maximum Displacement 0.000923 0.001800 YES
RMS Displacement 0.000326 0.001200 YES
Predicted change in Energy=-1.542949D-08
Optimization completed.
-- Stationary point found.
The optimisation is converged.
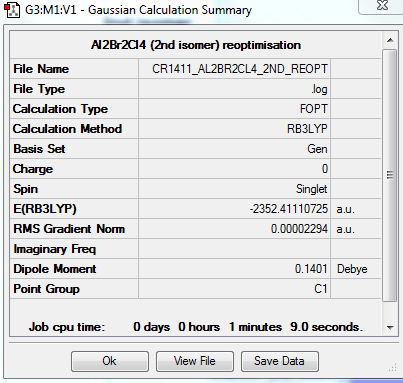
REOPTIMSATION
https://spectradspace.lib.imperial.ac.uk:8443/dspace/handle/10042/25628
Item Value Threshold Converged?
Maximum Force 0.000047 0.000450 YES
RMS Force 0.000020 0.000300 YES
Maximum Displacement 0.001657 0.001800 YES
RMS Displacement 0.000528 0.001200 YES
Predicted change in Energy=-4.120267D-08
Optimization completed.
-- Stationary point found.
The optimisation is converged.
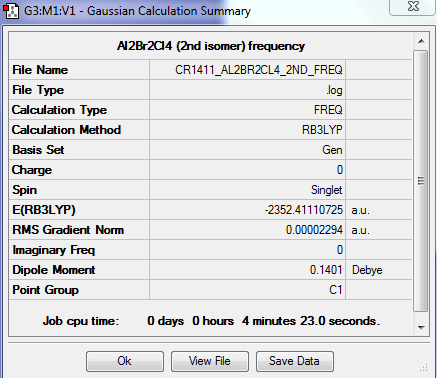
FREQUENCY ANALYSIS
https://spectradspace.lib.imperial.ac.uk:8443/dspace/handle/10042/25630
Low frequencies --- -1.5611 -0.7406 0.0023 0.0030 0.0033 0.9731
Low frequencies --- 16.8084 55.9145 80.0550
The frequencies are "low" (i.e. they are located in the range ±15 cm-1), and there are no negative frequencies.
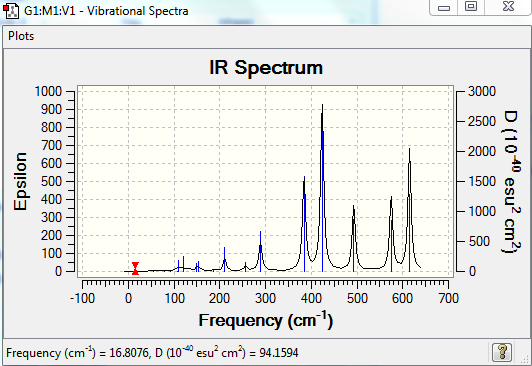
The 18 vibrational modes are summarised in Table 7. The molecule has a lower symmetry with respect to the first isomer and hence only has 2 vibrational modes for which the overall dipole moment is zero. All the other modes are infrared active, giving rise to absorption of energy, with peaks of varying intensity depending on the magnitude of the overall dipole moment.
| Mode | Frequency (cm-1) | Intensity | IR active |
|---|---|---|---|
| 1 | 17 | 0.4 | yes but not visible on spectrum (intensity too low) |
| 2 | 56 | 0 | no |
| 3 | 80 | 0.1 | yes but not visible on spectrum (intensity too low) |
| 4 | 92 | 0.6 | yes but not visible on spectrum (intensity too low) |
| 5 | 107 | 0 | no |
| 6 | 110 | 5 | yes |
| 7 | 121 | 8 | yes |
| 8 | 149 | 5 | yes |
| 9 | 154 | 6 | yes |
| 10 | 186 | 1 | yes |
| 11 | 211 | 21 | yes |
| 12 | 257 | 10 | yes |
| 13 | 289 | 48 | yes |
| 14 | 384 | 153 | yes |
| 15 | 424 | 274 | yes |
| 16 | 493 | 107 | yes |
| 17 | 575 | 122 | yes |
| 18 | 615 | 197 | yes |
3rd isomer
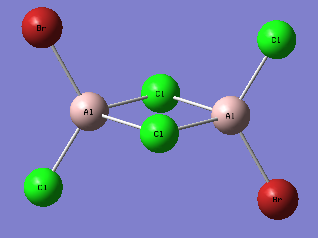
A third isomer of the Al2Br2Cl4 molecule has terminal bromine atoms facing each other (cis) on opposite Al atoms, with in this case two bridging chlorine atoms.
This conformer is not linear, has a principal rotation axis C2 and an internal mirror plane σH. Hence its point group is C2h.
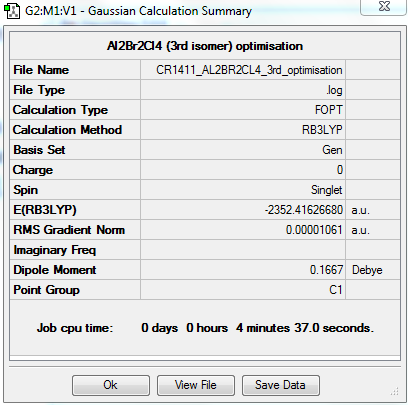
OPTIMISATION
https://spectradspace.lib.imperial.ac.uk:8443/dspace/handle/10042/25580
 Item Value Threshold Converged?
Maximum Force 0.000018 0.000450 YES
RMS Force 0.000008 0.000300 YES
Maximum Displacement 0.000599 0.001800 YES
RMS Displacement 0.000164 0.001200 YES
Predicted change in Energy=-9.205418D-09
Optimization completed.
-- Stationary point found.
The optimisation is converged.
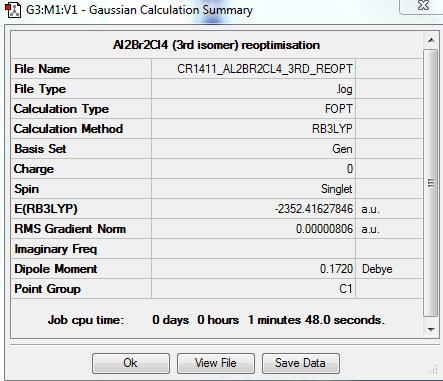
REOPTIMISATION
https://spectradspace.lib.imperial.ac.uk:8443/dspace/handle/10042/25631
Item Value Threshold Converged?
Maximum Force 0.000014 0.000450 YES
RMS Force 0.000007 0.000300 YES
Maximum Displacement 0.000517 0.001800 YES
RMS Displacement 0.000194 0.001200 YES
Predicted change in Energy=-5.451771D-09
Optimization completed.
-- Stationary point found.
The optimisation is converged.
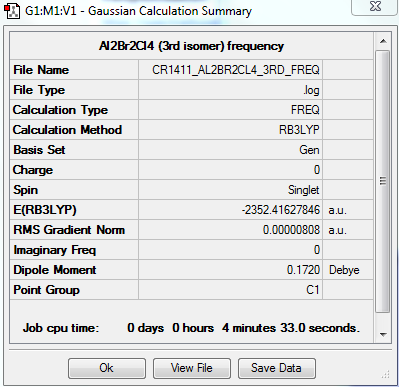
FREQUENCY ANALYSIS
https://spectradspace.lib.imperial.ac.uk:8443/dspace/handle/10042/25632
Low frequencies --- -1.4009 -1.1078 -0.0025 -0.0013 -0.0011 1.9732
Low frequencies --- 17.4851 51.1401 78.5251
The frequencies are "low" (i.e. they are located in the range ±15 cm-1), and there are no negative frequencies.
The frequency analysis reveals four IR inactive modes (cf. Table 8), hence only 14 peaks are expected in the spectrum. However, there are 2 additional frequencies with a very low intensity that are not visible in the spectrum. Therefore only 12 peaks are observed. The 3rd isomer has a higher symmetry than the 2nd isomer (C1 point group) but a lower symmetry than the 1st (D2h point group); it has therefore more infrared active modes (and thus more peaks in its spectrum) than the 1st isomer but less than the 2nd isomer.
| Mode | Frequency (cm-1) | Intensity | IR active |
|---|---|---|---|
| 1 | 17 | 0.4 | yes but not visible on spectrum (intensity too low) |
| 2 | 51 | 0 | no |
| 3 | 79 | 0 | no |
| 4 | 99 | 0.2 | yes but not visible on spectrum (intensity too low) |
| 5 | 103 | 3 | yes |
| 6 | 121 | 13 | yes |
| 7 | 123 | 6 | yes |
| 8 | 157 | 0 | no |
| 9 | 158 | 5 | yes |
| 10 | 194 | 2 | yes |
| 11 | 263 | 0 | no |
| 12 | 279 | 26 | yes |
| 13 | 308 | 2 | yes |
| 14 | 413 | 149 | yes |
| 15 | 420 | 410 | yes |
| 16 | 461 | 35 | yes |
| 17 | 571 | 33 | yes |
| 18 | 583 | 277 | yes |
4th isomer
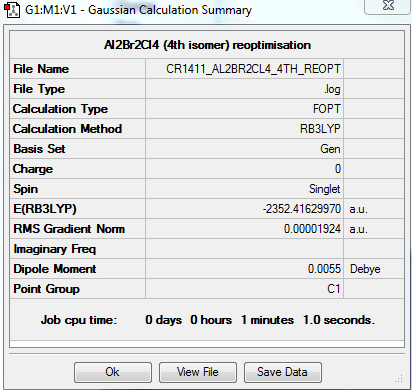
The fourth isomer of Al2Br2Cl4 has the two terminal bromine atoms located furthest away from each other (trans).
The molecule has one principal rotation axis C2 and an internal mirror plane σH. Its point group is therefore C2h.
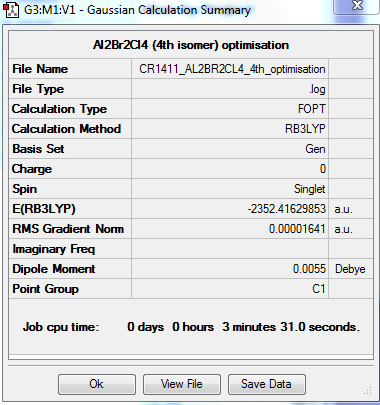
OPTIMISATION
https://spectradspace.lib.imperial.ac.uk:8443/dspace/handle/10042/25579
Item Value Threshold Converged?
Maximum Force 0.000043 0.000450 YES
RMS Force 0.000016 0.000300 YES
Maximum Displacement 0.000452 0.001800 YES
RMS Displacement 0.000178 0.001200 YES
Predicted change in Energy=-2.611082D-08
Optimization completed.
-- Stationary point found.
The optimisation is converged.
REOPTIMISATION
https://spectradspace.lib.imperial.ac.uk:8443/dspace/handle/10042/25633
 Item Value Threshold Converged?
Maximum Force 0.000053 0.000450 YES
RMS Force 0.000019 0.000300 YES
Maximum Displacement 0.000546 0.001800 YES
RMS Displacement 0.000157 0.001200 YES
Predicted change in Energy=-3.340597D-08
Optimization completed.
-- Stationary point found.
The optimisation is converged.
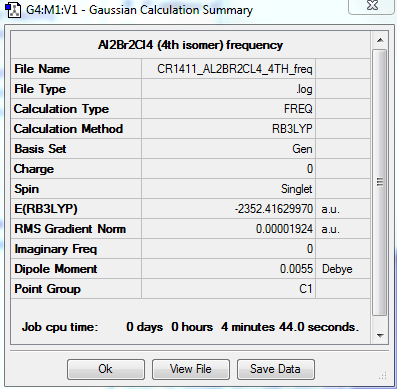
FREQUENCY ANALYSIS
https://spectradspace.lib.imperial.ac.uk:8443/dspace/handle/10042/25635
Low frequencies --- -3.2383 -1.8721 -1.2160 -0.0015 0.0017 0.0028
Low frequencies --- 18.1050 49.1239 72.8941
The frequencies are "low" (i.e. they are located in the range ±15 cm-1), and there are no negative frequencies.
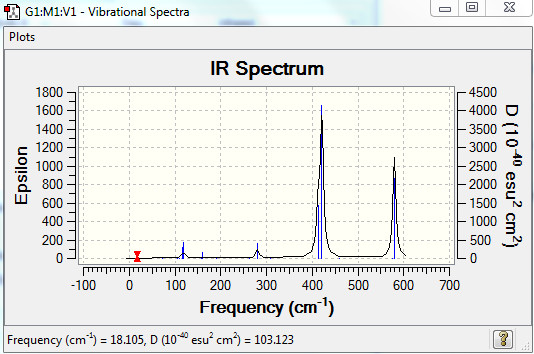
This conformer has 8 infrared inactive modes (cf. Table 9), hence only 10 peaks are expected in its IR spectrum. It further has 3 frequencies of too low intensity to be detected, bringing the number of peaks down to 7. Conformers 3 and 4 have a similar degree of symmetry (intermediate between isomer 1 with the highest degree of symmetry, and isomer 2 with the lowest degree of symmetry). They have thus similar IR spectra. However the number of their infrared active modes differs: the 4th conformer has actually twice the number of infrared inactive modes than the 3rd isomer, resulting in less peaks in its spectrum.
| Mode | Frequency (cm-1) | Intensity | IR active |
|---|---|---|---|
| 1 | 18 | 0.5 | yes but not visible on spectrum (intensity too low) |
| 2 | 49 | 0.1 | yes but not visible on spectrum (intensity too low) |
| 3 | 73 | 0 | no |
| 4 | 105 | 0 | no |
| 5 | 109 | 0 | no |
| 6 | 117 | 8 | yes |
| 7 | 120 | 13 | yes |
| 8 | 157 | 0 | no |
| 9 | 159 | 6 | yes |
| 10 | 192 | 0 | no |
| 11 | 264 | 0 | no |
| 12 | 280 | 29 | yes |
| 13 | 308 | 0 | no |
| 14 | 413 | 149 | yes |
| 15 | 421 | 438 | yes |
| 16 | 459 | 0 | no |
| 17 | 575 | 0.1 | yes but not visible on spectrum (intensity too low) |
| 18 | 580 | 316 | yes |
Discussion
IR spectrum comparison
The vibrational frequencies of the isomers, together with their corresponding intensity, are summarised in Table 10. In all four cases, modes 1-10 are bending modes whilst modes 11-18 are stretching ones: bending frequencies are much lower in energy than stretching ones. Whilst the values of the bending frequencies are similar for all four isomers, there are significant differences for the values of their stretching frequencies.
Firstly, for the modes 10-14 involving the bridging ligands, the value of the frequency increases from left to right of the table, that is the frequency increases upon substituting the bridging chlorine atoms by bromine atoms. This implies that the Al-X-Al bonds are stronger with bridging chlorine atoms. This in turn suggests that there is a better Cl-Al orbital overlap with respect to the one existing in the Al-Br bond. The σ-donation from the Cl lone pair (3p) to the empty sp3 orbital on Al is actually better matched in terms of size and energy compared to the σ-donation of the Br atom (involving 4p orbitals).
For the modes 15-18 concerning the movement of terminal atoms, the trend is reversed: the frequency diminishes from left to right, that is, when having terminal bromine atoms. This corroborates the observation from above for the bridging bonds, as it shows here the greater strength of the Al-Cl σ bond with respect to the Al-Br one. This is the expected result considering that the orbitals involved in bonding are both from the third period, whilst the Al-Br bond has component from the fourth period. Hence a weaker resulting overlap in the latter case.
| Vibrational mode | 1st isomer frequency (cm-1) | Intensity | 2nd isomer frequency (cm-1) | Intensity | 3rd isomer frequency (cm-1) | Intensity | 4th isomer frequency | Intensity |
|---|---|---|---|---|---|---|---|---|
| 1 | 16 | 0.3 | 17 | 0.4 | 17 | 0.4 | 18 | 0.5 |
| 2 | 64 | 0 | 56 | 0 | 51 | 0 | 49 | 0.1 |
| 3 | 86 | 0 | 80 | 0.1 | 79 | 0 | 73 | 0 |
| 4 | 87 | 0 | 92 | 0.6 | 99 | 0.2 | 105 | 0 |
| 5 | 108 | 5 | 107 | 0 | 103 | 3 | 109 | 0 |
| 6 | 111 | 0 | 110 | 5 | 121 | 13 | 117 | 8 |
| 7 | 126 | 8 | 121 | 8 | 123 | 6 | 120 | 13 |
| 8 | 135 | 0 | 149 | 5 | 157 | 0 | 157 | 0 |
| 9 | 138 | 7 | 154 | 6 | 158 | 5 | 159 | 6 |
| 10 | 163 | 0 | 186 | 1 | 194 | 2 | 192 | 0 |
| 11 | 197 | 0 | 211 | 21 | 263 | 0 | 264 | 0 |
| 12 | 241 | 100 | 257 | 10 | 279 | 26 | 280 | 29 |
| 13 | 247 | 0 | 289 | 48 | 308 | 2 | 308 | 0 |
| 14 | 341 | 161 | 384 | 153 | 413 | 149 | 413 | 149 |
| 15 | 468 | 346 | 424 | 274 | 420 | 410 | 421 | 438 |
| 16 | 494 | 0 | 493 | 107 | 461 | 35 | 459 | 0 |
| 17 | 609 | 0 | 575 | 122 | 571 | 33 | 575 | 0.1 |
| 18 | 617 | 332 | 615 | 197 | 583 | 277 | 580 | 316 |
Energies of the conformers
The energies of the different conformers were determined; they are summarised in Table 11. The 3rd and 4th isomers are significantly lower in energy compared to the first two, with the 4th isomer being the lowest in energy; having the bigger Br atoms bridging is not favoured. The molecule is more stable with terminal Br atoms; moreover it achieves its greatest stability with the 2 Br atoms furthest away from each other (trans conformer).
| Energy/Isomer | 1st | 2nd | 3rd | 4th |
|---|---|---|---|---|
| in a.u. | -2352.40630797 | -2352.41109946 | -2352.41626680 | -2352.41629853 |
| energy relative to lowest energy conformer (a.u.) | 9.99056*10-3 | 5.19907*10-3 | 3.17300*10-5 | 0 |
| energy relative to lowest energy conformer (KJ/mol) | 26.2 | 13.7 | 83.3*10-3 | 0 |
DISSOCIATION ENERGY OF THE LOWEST ENERGY (4TH) CONFORMER
The dissociation energy of the 4th conformer was determined in order to establish whether the dimerisation process is favoured. The results of the analysis can be found below:
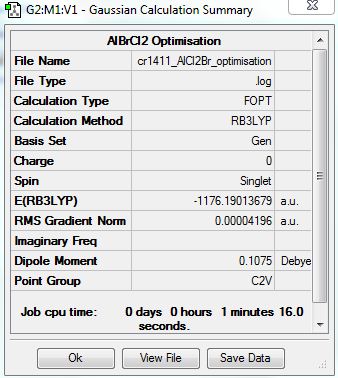
https://spectradspace.lib.imperial.ac.uk:8443/dspace/handle/10042/25582
Item Value Threshold Converged?
Maximum Force 0.000136 0.000450 YES
RMS Force 0.000073 0.000300 YES
Maximum Displacement 0.000681 0.001800 YES
RMS Displacement 0.000497 0.001200 YES
Predicted change in Energy=-7.984428D-08
Optimization completed.
-- Stationary point found.
The optimisation is converged.
The equation for the dissociation reaction is the following:
AlBr2Cl4 -> 2 AlBrCl2 | ΔE=?
ΔE= 2*E(AlBrCl2)-E(AlBr2Cl4)
Hence ΔE= 2*(-1176.19013679)-(-2352.41629853)
Hence ΔE= 3.602495*10-2
Hence ΔE= 3.602495*10-2*2625.5 KJ/mol= 94.6 KJ/mol
The value of the energy difference ΔE is positive: the reaction is endo-energetic. The isolated monomers are higher in energy than the Al2Br2Cl4 dimer, which is thus more stable than the isolated monomers. It can therefore be deduced that the dimer formation is actually energetically favoured.
Natural Bond Orbital analysis
A NBO analysis was carried out on the 4th isomer, the lowest in energy. 5 non-core MOs are shown and ranked from the strongest bonding to the strongest antibonding in Table 12.
https://spectradspace.lib.imperial.ac.uk:8443/dspace/handle/10042/25653
Conclusion
In this study, the four isomers of the Al2Br2Cl4 molecule were optimised in order to establish their vibrational frequencies and energy to subsequently determine their relative stability. The frequency analysis revealed that having two bridging chlorine atoms was favoured due to the better orbital overlap observed between the Al and Cl atom with respect to the one existing between the Al and Br atom. Furthermore, it was observed that the conformer having the two bromine atoms furthest away from each other (trans conformer) was the lowest in energy and was hence the most stable. The positive dissociation energy obtained for this isomer further showed that the dimer formation is actually favoured. The results obtained thus corroborate the fact that the Al2Br2Cl4 molecule is most stable by adopting the 4th conformation.
- ↑ J. Hartig et al, Wiley-VCH Verlag, 2007
- ↑ Shriver & Atkins, Inorganic Chemistry, Oxford University Press, 5th Edition, 2010, Chapter 2, pp.50-51
- ↑ R. Davies, Periodicity and Inorganic reactivity, 1st year inorganic chemistry lecture course
- ↑ Shriver & Atkins, Inorganic Chemistry, Oxford University Press, 5th Edition, 2010, Chapter 1, p.30.
- ↑ R. Davies, Periodicity and Inorganic reactivity, 1st year inorganic chemistry lecture course
- ↑ R. Davies, Periodicity and Inorganic reactivity, 1st year inorganic chemistry lecture course
- ↑ P. Hunt, Molecular Orbital theory, 2nd year inorganic chemistry lecture course
- ↑ Sheffield Hallam University teaching
- ↑ Sheffield Hallam University teaching
- ↑ Sheffield Hallam University teaching
- ↑ 3rd Year Inorganic Chemistry Computational lab script
- ↑ 3rd Year Inorganic Chemistry Computational lab script
- ↑ 3rd Year Inorganic Chemistry Computational lab script
- ↑ B. Tattershall, Newcastle University teaching
- ↑ P. Hunt, Molecular Orbital theory, 2nd year inorganic chemistry lecture course
- ↑ N. Hess et al, Basic Research for the Hydrogen Fuel Initiative, 2006, U.S Department of Energy
- ↑ R. Davies, Periodicity and Inorganic reactivity, 1st year inorganic chemistry lecture course

