Rep:Mod:XYZ12394
INORGANIC COMPUTATIONAL MODULE: SAMUEL PAGE (CID: 00687062)
COMPULSORY SECTION
BH3 optimisation
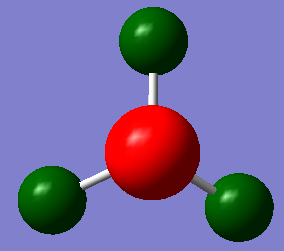
The first stage was to create a molecule of BH3 in Gaussview, which I proceeded to optimise using a B3LYP method and a 3-21G basis set. The summary table is included here:
| Name | Structure |
| File type |
log |
| Calculation type |
FOPT |
| Calculation method |
RB3LYP |
| Basis set |
3-21G |
| Final energy (a.u.) |
-26.46226429 |
| Gradient (a.u.) |
0.00008851 |
| Dipole moment |
0.003 D |
| Point group |
CS |
| Calculation time |
34 secs |
The optimisation file is linked to here.
To check that the optimisation job truly did converge, it is useful to check the Item table found in the output file. The signs of a converged job are small values and a column full of 'YES' under 'Converged?'. This is included here:
Item               Value     Threshold  Converged?
 Maximum Force            0.000220     0.000450     YES
 RMS     Force            0.000106     0.000300     YES
 Maximum Displacement     0.000709     0.001800     YES
 RMS     Displacement     0.000447     0.001200     YES
 Predicted change in Energy=-1.672478D-07
 Optimization completed.
    -- Stationary point found.
BH3 optimisation: using a better basis set
Now, it possible to use the optimised geometry above to carry out a second optimisation with a higher level basis set, this time 6-31G(d,p).
| Name | Structure |
| File type |
log |
| Calculation type |
FOPT |
| Calculation method |
RB3LYP |
| Basis set |
6-31G(d,p) |
| Charge |
0 |
| Spin |
Singlet |
| Final energy (a.u.) |
-26.61532360 |
| RMS Grad Norm (a.u.) |
0.00000707 |
| Dipole moment |
0.0001 D |
| Point group |
CS |
| Calculation time |
32 secs |
The optimisation file is linked to here.
Item               Value     Threshold  Converged?
 Maximum Force            0.000012     0.000450     YES
 RMS     Force            0.000008     0.000300     YES
 Maximum Displacement     0.000061     0.001800     YES
 RMS     Displacement     0.000038     0.001200     YES
 Predicted change in Energy=-1.069855D-09
 Optimization completed.
    -- Stationary point found.
The optimised bond angle is found to be 120 ° and the optimised bond length is 1.19 Å. This fits with literature (quoting a bond length of 1.191 Å). [1]
It is possible to look at the energies obtained from each optimisation. For the 3-21G optimisation, the total energy is -26.46226429 A.U.; for the -26.61532360 A.U. This is a difference of 0.15305931 A.U., or 401.86kJ/mol. However, it is the case that one cannot compare the energies of structures which have been computed using different basis sets, as is the case here.
GaBr3 optimisation
This time a molecule of GaBr3 was created in Gaussview. An optimisation was calculated; the differences this time being that the symmetry was constrained to D3h, and a new basis set LanL2DZ was used. The calculation was submitted to the HPC service.
| Name | Structure |
| File type |
log |
| Calculation type |
FOPT |
| Calculation method |
RB3LYP |
| Basis set |
LANL2DZ |
| Charge |
0 |
| Spin |
Singlet |
| Final energy (a.u.) |
-41.70082783 |
| RMS Grad Norm (a.u.) |
0.00000011 |
| Dipole moment |
0 D |
| Point group |
D3H |
| Calculation time |
8 secs |
The population analysis file is linked to here: DOI:10042/26071 .
Item               Value     Threshold  Converged?
 Maximum Force            0.000000     0.000450     YES
 RMS     Force            0.000000     0.000300     YES
 Maximum Displacement     0.000002     0.001800     YES
 RMS     Displacement     0.000001     0.001200     YES
 Predicted change in Energy=-5.834383D-13
 Optimization completed.
    -- Stationary point found.
The optimised Ga-Br bond length is found to be 2.35 Å, and the optimised Br-Ga-Br bond angle 120 °.
As a check, a reference Ga-Br bond length is 2.353 Å[2] (compared to 2.35018 Å calculated). There is no meaningful difference between the two lengths, so this literature value definitely suggests that the calculated length is reasonable.
BBr3 optimisation
Starting from the optimised file for BH3, a molecule of BBr3 was created and optimised (again using the HPC service). This time the basis set GEN was used, allowing the B atoms (light) and the Br atoms (heavy) to be treated separately, with pseudo-potentials used for the Br atoms.
| Name | Structure |
| File type |
log |
| Calculation type |
FOPT |
| Calculation method |
RB3LYP |
| Basis set |
Gen |
| Charge |
0 |
| Spin |
Singlet |
| Final energy (a.u.) |
-64.43644651 |
| RMS Grad Norm (a.u.) |
0.00000941 |
| Dipole moment |
0.0002 D |
| Point group |
CS |
| Calculation time |
35 secs |
The optimisation file is linked to here.
Item               Value     Threshold  Converged?
 Maximum Force            0.000023     0.000450     YES
 RMS     Force            0.000011     0.000300     YES
 Maximum Displacement     0.000148     0.001800     YES
 RMS     Displacement     0.000084     0.001200     YES
 Predicted change in Energy=-2.424079D-09
 Optimization completed.
    -- Stationary point found.
The optimised B-Br bond length is 1.93 Å (compared to a literature value of 1.89 Å)[3] and the optimised Br-B-Br bond angle is 120 °.
Comparisons
| BH3 bond length (Å) | BBr3 bond length (Å) | GaBr3 bond length (Å) |
|---|---|---|
| 1.19 | 1.93 | 2.35 |
For the same centre (BH3 and BBr3), changing the ligand from H to Br increases the bond length significantly. At first glance, this seems sensible; Br is after all a much larger atom than H, and for steric reasons one would expect the Br atoms to be further away from the B atom, which is itself relatively very small. The bond angles for each molecule are 120 ° (the arrangement whereby the ligands are as far away as possible), so to maintain this, the Br atoms are forced further away than the corresponding H atoms. B and H have radii much closer in size than B and Br, hence there is better orbital overlap, leading to stronger bonds.
Another consideration is the electronegativity of H and Br. Br is more electronegative than H; whilst the electronegativities of B and H are very similar, Br is considerably more electronegative than B. Hence, B and H will be happy to share electrons and form a strong covalent bond, whilst the B-Br bond will have some more ionic character and have a higher bond polarity. H has just the one electron, and hence acts as a one electron donor. Br- behaves similarly due to its single negative charge.
For the same ligand (BBr3 and GaBr3), changing the centre from B to Ga increases the bond length significantly. Whilst B and Ga are both Group 13 elements, and hence have three valence electrons each, Ga is two periods below B and therefore much larger. In fact, Ga and Br are both in the same period and hence their radii are much more similar than for B and Br. Despite this, Ga and Br have very large orbitals and hence there is poor orbital overlap. In this case, changing the centre has less of an effect on the bond length than changing the ligand. However, the electronegativity difference between Ga and Br is very large, and hence the Ga-Br bond has a large ionic component i.e. the bond is polar.
- In some structures Gaussview does not draw in the bonds where we expect, does this mean there is no bond? Why?
- What is a bond?
On Gaussview, a bond is only displayed as a line between two atoms when two atoms have a separation within a certain distance (pre-defined by the program)- if any two atoms are placed further away than this set distance, no bond is shown; two atoms closer together than this set distance are joined by a bond. Clearly, this is a huge approximation; it is true that if two atoms are very far apart then they will interact more weakly than if they are very close together, but it is not realistic for this behaviour to be defined as switching on/off at a defined point; it is a simplification. The display of a bond or not in Gaussview has no effect on the way it treats the molecule: it is more of a display 'quirk'.
A chemical bond is something open to interpretation: in its most basic form, an attractive interaction between two atoms, or some sort of force holding two atoms together. This electrostatic force does indeed have a distance dependence. However, there are a vast array of different bonding types: covalent, ionic, van der Waals, Hydrogen... These will all have different strengths and thus different contributions to the stability of a molecule.
Frequency analysis for BH3
Using the optimisation file (6-31G(d,p) basis set) as completed before for BH3, it is possible to continue further and carry out a frequency analysis.
The low frequencies labelled in the output file (included here) are important. The 6 frequencies in the first line are those of the 3N-6 vibrational frequencies of each molecule. It is required for these to be low, especially in comparison to the first vibration listed in the second line.
Low frequencies ---   -3.6020   -1.1356   -0.0054    1.3734    9.7035    9.7697
 Low frequencies --- 1162.9825 1213.1733 1213.1760
The optimisation file is linked to here.
Animating the vibrations
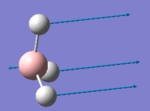
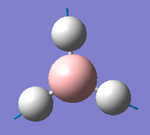
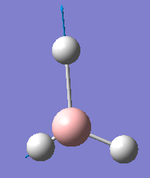
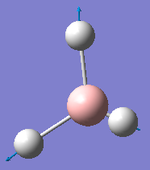
From the frequency analysis, it was possible to animate the vibrations, which are summarised in the table here.
It should be noted that the bending vibrational are all of lower energy than the stretching vibrational modes (less energy is needed to bend a bond than to stretch it.)
The computed IR spectrum is here:
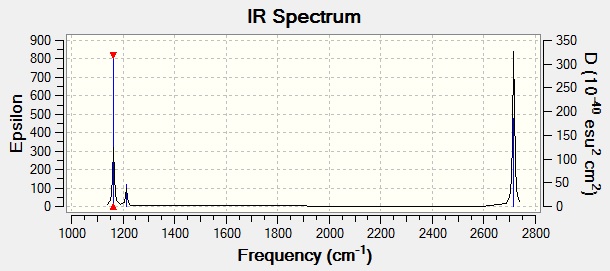
Although there are six listed frequencies, the two sets of E' frequencies occur at very almost or exactly the same frequency value and are hence seen as just one peak. In addition, the A1' frequency has zero intensity. This is because this vibration is IR inactive, as there is no change of dipole moment. This leaves just 3 peaks visible.
Frequency analysis for GaBr3
A similar frequency analysis can be carried out for GaBr3.
 Low frequencies ---   -0.5252   -0.5247   -0.0024   -0.0010    0.0235    1.2010
 Low frequencies ---   76.3744   76.3753   99.6982
The population analysis file is linked to here: DOI:10042/26086 .
| No. | Frequency (cm-1) | Intensity | Symmetry D3h point group |
|---|---|---|---|
| 1 | 76 | 3 | E' |
| 2 | 76 | 3 | E' |
| 3 | 100 | 9 | A2'' |
| 4 | 197 | 0 | A1' |
| 5 | 316 | 57 | E' |
| 6 | 316 | 57 | E' |

Comparing the vibrational frequencies of BH3 and GaBr3
| BH3: Frequency (cm-1) | Intensity | Symmetry | GaBr3: Frequency (cm-1) | Intensity | Symmetry |
|---|---|---|---|---|---|
| 1163 | 93 | A2'' |
76 | 3 | E' |
| 1213 | 14 | E' | 76 | 3 | E' |
| 1213 | 14 | E' | 100 | 9 | A2'' |
| 2582 | 0 | A1' | 197 | 0 | A1' |
| 2716 | 126 | E' | 316 | 57 | E' |
| 2716 | 126 | E' | 316 | 57 | E' |
The value of the frequencies are very different for BH3 compared to GaBr3. The frequencies for GaBr3 are much lower than those of BH3. This can be attributed to the weaker bonds present in GaBr3 (and hence less energy is required to stretch or bend the bonds) and the much larger reduced mass of that molecule.
There has been a slight reordering of modes; although the A2 and E' modes have a set of similar frequencies with the A1' and E' modes having another set of similar frequencies but at higher energy, for BH3, the A2 frequency is of lower energy than its E' brothers, for GaBr3 this order has been reversed.
The spectra are similar in that each has 3 peaks. 2 of these appear close together at lower frequency and are of lesser intensity. The 1 remaining peak appears at much higher frequency and is of much higher intensity.
- Why must you use the same method and basis set for both the optimisation and frequency analysis calculations?
This allows direct comparison between the results from the calculations.
- What is the purpose of carrying out a frequency analysis?
Frequency analysis allows us to confirm that we truly have our optimised our structure as a minimum. The diagnostic information givn is that the frequencies should all be positive for a minimum; if any are positive, this suggests transition state or a failed optimisation. The low frequencies should be low. Frequency analysis allows production of an IR spectrum, and for the vibrations of the molecule to be explored.
- What do the "Low frequencies" represent?
Each molecule (that is not linear) has 3N-6 degrees of vibrational modes; the low frequencies are those 6 and are the motions of the centre of mass of the molecule. These should be as small as possible, and are minimised with increasingly good optimisation.
Molecular orbitals of BH3
The population analysis file is linked to here: DOI:10042/26095 .
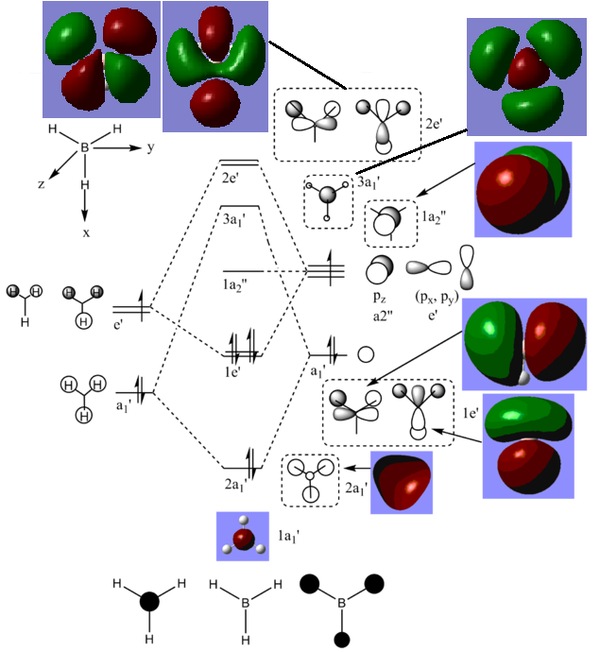
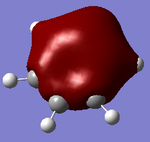
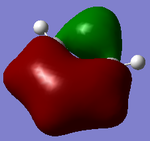
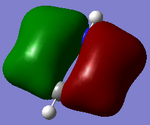
There are no significant differences between the real and LCAO orbitals, suggesting that qualitative MO analysis is both very accurate and useful.
| Molecular orbital | Energy (A.U.) |
|---|---|
| 8 - 2e' | 0.17929 |
| 7 - 2e' | 0.17929 |
| 6 - 3a1' | 0.16839 |
5 - A2'' |
-0.06605 |
| 4 - 1e' | -0.35079 |
| 3 - 1e' | -0.35079 |
| 2 - 2a1' | -0.51254 |
| 1 - 1a1' (core) | -6.77140 |
NBO analysis
NH3
 Item               Value     Threshold  Converged?
 Maximum Force            0.000024     0.000450     YES
 RMS     Force            0.000012     0.000300     YES
 Maximum Displacement     0.000079     0.001800     YES
 RMS     Displacement     0.000053     0.001200     YES
 Predicted change in Energy=-1.634443D-09
 Optimization completed.
    -- Stationary point found.
The optimisation file is linked to here. The frequency analysis file is linked to here. https://spectradspace.lib.imperial.ac.uk:8443/dspace/handle/10042/26112 DOI:10042/26112
The optimised bond length is 1.02 Å (compared to literature of 1.03 Å[4]) and the optimised bond angle is 106 °.
| Name | Structure |
| File type |
log |
| Calculation type |
FOPT |
| Calculation method |
RB3LYP |
| Basis set |
6-31G(d,p) |
| Charge |
0 |
| Spin |
Singlet |
| Final energy (a.u.) |
-56.55776872 |
| RMS Grad Norm (a.u.) |
0.00000878 |
| Dipole moment |
1.8464 D |
| Point group |
C1 |
| Calculation time |
36 secs |
Low frequencies ---   -6.8215    0.0013    0.0015    0.0018   11.3351   16.1518
 Low frequencies --- 1089.3553 1693.9211 1693.9586
Colour range: -1.132 to +1.132.
Specific NBO charges: N: -1.132, H: +0.377
NH3BH3
| Name | Structure |
| File type |
log |
| Calculation type |
FOPT |
| Calculation method |
RB3LYP |
| Basis set |
6-31G(d,p) |
| Charge |
0 |
| Spin |
Singlet |
| Final energy (a.u.) |
-83.22468889 |
| RMS Grad Norm (a.u.) |
0.00005803 |
| Dipole moment |
5.5626 D |
| Point group |
C1 |
| Calculation time |
50 secs |
Item               Value     Threshold  Converged?
 Maximum Force            0.000137     0.000450     YES
 RMS     Force            0.000038     0.000300     YES
 Maximum Displacement     0.001017     0.001800     YES
 RMS     Displacement     0.000224     0.001200     YES
 Predicted change in Energy=-1.130217D-07
 Optimization completed.
    -- Stationary point found.
 Low frequencies ---  -12.0985   -0.0014   -0.0009   -0.0006    9.2098   10.2976
 Low frequencies ---  262.8357  631.2185  638.0529
The optimisation file is linked to here. The frequency analysis file is linked to here.
- E(NH3)= -56.55776856 A.U.
- E(BH3)= -26.61532360 A.U.
- E(NH3BH3)= -83.22468889 A.U.
- ΔE=E(NH3BH3)-[E(NH3)+E(BH3)]=(-83.22468889)-((-56.55776872)+(-26.6152360))= -0.05168417 A.U.
- To convert from A.U. to kJ/mol, it is necessary to multiply the calculated figure by 2625.5, giving ΔE = -135.7 kJ/mol. This is in the same 'ballpark' as typical bond energy values. This energy value is only as a result of the enthalpy change (for these calculations, entropy is ignored). Hence, NH3BH3 is energetically more stable than the reactants. This analysis suggests that the B-N bond that has been formed adds stability; B-N is a strong bond.
MINI PROJECT - AROMATICITY
In this mini project, four aromatic molecules will be explored: benzene, boratabenzene, pyridinium and borazine.
Benzene
As a starting point, a benzene molecule was created and optimised.
| Name | Structure |
| File type |
log |
| Calculation type |
FOPT |
| Calculation method |
RB3LYP |
| Basis set |
6-31G(d,p) |
| Charge |
0 |
| Spin |
Singlet |
| Final energy (a.u.) |
-232.25820396 |
| RMS Grad Norm (a.u.) |
0.00003423 |
| Dipole moment |
0 D |
| Point group |
C1 |
| Calculation time |
55 secs |
Item               Value     Threshold  Converged?
 Maximum Force            0.000074     0.000450     YES
 RMS     Force            0.000019     0.000300     YES
 Maximum Displacement     0.000111     0.001800     YES
 RMS     Displacement     0.000051     0.001200     YES
 Predicted change in Energy=-2.326716D-08
 Optimization completed.
    -- Stationary point found.
 Low frequencies ---   -5.4822   -2.4429   -0.0006    0.0008    0.0009    5.2613
 Low frequencies ---  414.4720  414.5447  621.1074
The optimisation file is linked to here. The frequency file is linked to here. The population analysis file is linked to here: DOI:10042/26118
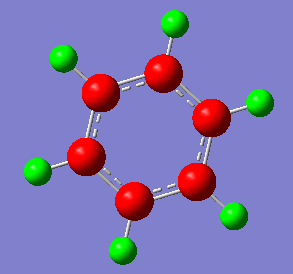
As before, some simple information can quickly be found. Each C-C bond length is 1.40 Å (a fit with literature[5]) and each C-H bond 1.09 Å. The C-C-C bond angle is 120 °.
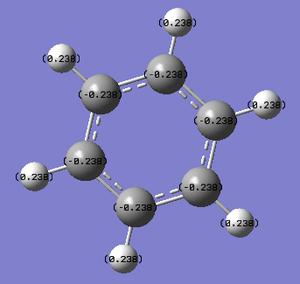
NBO analysis can also be carried out:
| Type of charge display | Image |
| Colour atoms by charge | |
| Show numbers |
The charge range is from -0.238 to +0.238.
Further analysis of the log file from this calculation more or less confirms what is known about benzene already. There are two types of C-C bonds as calculated. One has equal contribution from each C (50% each) and the orbitals involved are 35%s and 65%p, clearly suggesting sp2 hybrid orbitals. The other C-C bond again has equal contribution from each carbon, this time with p orbitals. This represents the delocalisation of the pi electrons. The C-H bonds are 1.98 Å, this time with 62% contribution from C (38% from H), formed by the overlap of a C sp2 orbital and a H s orbital.
The first C-C bond has an occupancy of 2 electrons, as expected; however the pi type bond has an occupancy of 1.66, significantly below 2. This reinforces the idea of delocalisation. Under the section 'Second Order Perturbation Theory Analysis of Fock Matrix in NBO basis' which describes MO mixing, there are six E(2) energies greater than 20 kcal/mol. Each of the bonding orbitals C1-C6, C2-C3 and C4-C5 mixes with the two other anti-bonding orbitals (i.e. for C1-C6 bonding orbital, there is mixing with C2-C3 and C4-C5 anti-bonding orbitals). These all have E(2) energies of 20.38/20/39 kcal/mol, which adds a great deal of stability to the molecule. From the summary section, it is shown that the sp2 C-C bonds are of lowest energy (~-0.681), followed by C-H bonds (~-0.51) then pi C-C bonds (~-0.24).
The MO diagram for benzene including both sigma and pi orbitals has been drawn and included below.
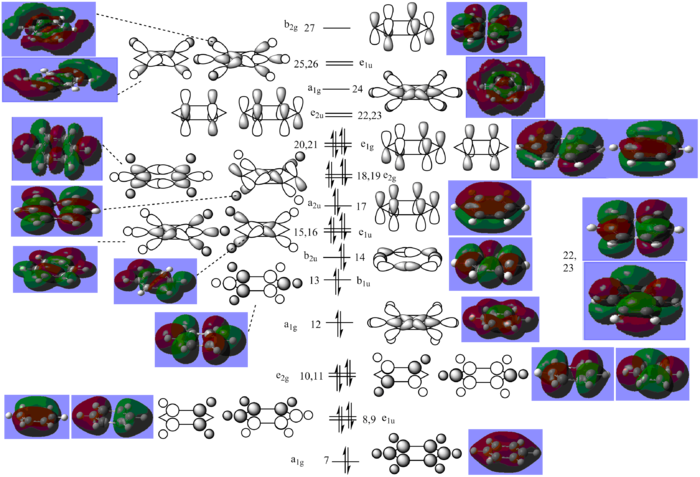
The standard MO diagram for benzene (that found in most textbooks[6]) includes only the 6 pz orbitals on the carbon atoms, ignoring the sigma orbitals. In effect, this is limiting the above MO diagram to just MOs 17, 20 and 21 (bonding) and 22, 23 and 27 (anti-bonding) from the above diagram. Aromatic systems are those which have a ring system of unexpectedly high stability, due to the delocalisation of electrons throughout the ring; for benzene, each carbon atom has an unpaired electron in its pz orbital and these electrons are said to be delocalised, or spread around the ring, not attached to any particular carbon atom. This means that the pi type C=C bonds are not in fixed positions. In reality, each carbon-carbon bond is somewhat in between that of a single and double bond. The pi type carbon bonds explored in the file from the calculation have an occupancy significantly below 1, as these bonds are instead spread over all six carbon atoms.
Boratabenzene
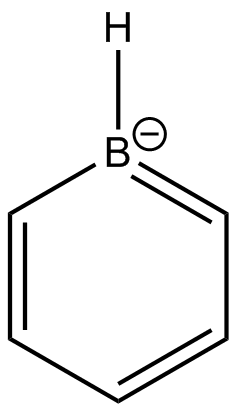
Boratabenzene is a molecule of benzene with one of the carbon atoms exchanged for a boron atom. The molecule carries a negative charge.
| Name | Structure |
| File type |
log |
| Calculation type |
FOPT |
| Calculation method |
RB3LYP |
| Basis set |
6-31G(d,p) |
| Charge |
-1 |
| Spin |
Singlet |
| Final energy (a.u.) |
-219.02052295 |
| RMS Grad Norm (a.u.) |
0.00003609 |
| Dipole moment |
2.8457 D |
| Point group |
C1 |
| Calculation time |
1m 7 secs |
Item               Value     Threshold  Converged?
 Maximum Force            0.000061     0.000450     YES
 RMS     Force            0.000018     0.000300     YES
 Maximum Displacement     0.000277     0.001800     YES
 RMS     Displacement     0.000088     0.001200     YES
 Predicted change in Energy=-3.727712D-08
 Optimization completed.
    -- Stationary point found.
Low frequencies ---   -7.0096   -0.0005    0.0007    0.0010    1.2981    6.0551
 Low frequencies ---  371.2955  404.4402  565.1118
The optimisation file is linked to here. The frequency file is linked to here. The population analysis file is linked to here: DOI:10042/26133
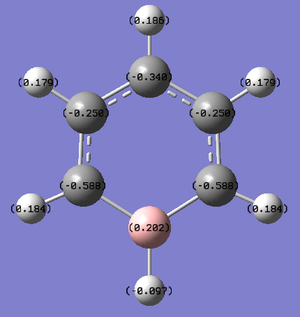
For boratabenzene, the C-C bond lengths are 1.41 Å or 1.40 Å when one of the carbons is attached to attached to the B. This is slightly longer than in benzene, suggesting slightly weaker bonds. The C-H bonds are all 1.09 or 1.10 Å. The C-B bond is 1.51 Å and the B-H bond is 1.22 Å. The bond angles range from 116 - 124 °, portraying the distortion in the ring, unlike benzene which has a regular configuration of all 120 ° angles.
| Type of charge display | Image |
| Colour atoms by charge | |
| Show numbers |
The charge range is -0.588 to +0.588.
Looking again at the NBO log file, the two C-C bonds and the C-H bonds are as before. For the two C-B bonds, the C contribution is 67% and B contribution 33%, each formed by sp2 orbitals from each atom. The B-H bond has 55% H contribution (s) and 45% B contribution (sp2.
In addition, there is a lone pair labelled as being in a p orbital on a C atom, with an occupancy of a little over 1; also, there is an anti-bonding lone pair in a p orbital on the B atom with an occupancy of under 1. This is trying to accommodate for the negative charge of the boratabenzene anion.
Some of the E(2) energies in boratabenzene are extremely high. Both the C2-C3 and C4-C5 bonds mix with the two lone pairs to give E(2) = ~24 (LP* B) and E(2) = ~37 (LP C). Each lone pair mixes with anti-bonding C4-C5 and C2-C3 orbitals to give E(2) = ~71 (LP C) and E(2) = ~180(!) (LP* B).
The energy ordering of the bonds has been altered too. The sp2 C-C bond is still most stable (-0.47), followed by C-B (-0.32), C-H (-0.31), B-H (-0.18) and pi C-C (-0.02). The lone pairs are at 0.1 and 0.22 for LP C and LP* B respectively.
Pyridinium
Pyridinium is a benzene molecule with one of the carbon atoms exchanged for a nitrogen. The molecule carries a positive charge.

| Name | Structure |
| File type |
log |
| Calculation type |
FOPT |
| Calculation method |
RB3LYP |
| Basis set |
6-31G(d,p) |
| Charge |
1 |
| Spin |
Singlet |
| Final energy (a.u.) |
-248.66806081 |
| RMS Grad Norm (a.u.) |
0.00004820 |
| Dipole moment |
1.8720 D |
| Point group |
C1 |
| Calculation time |
1 m 31 secs |
Item               Value     Threshold  Converged?
 Maximum Force            0.000086     0.000450     YES
 RMS     Force            0.000028     0.000300     YES
 Maximum Displacement     0.000682     0.001800     YES
 RMS     Displacement     0.000208     0.001200     YES
 Predicted change in Energy=-1.056565D-07
 Optimization completed.
    -- Stationary point found.
Low frequencies ---   -9.5599   -5.3753   -0.0011    0.0003    0.0012    3.8264
 Low frequencies ---  391.9440  404.3126  620.2380
The optimisation file is linked to here. The frequency file is linked to here. The population analysis file is linked to here: DOI:10042/26134
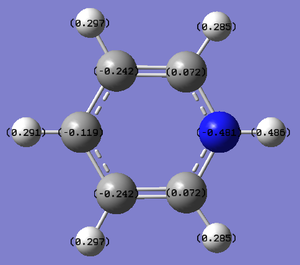
For pyridinium, there are two C-C bond lengths: 1.40 and 1.38 Å (when one of the carbons is attached to the N). This is slightly shorter than in benzene, suggesting that the bonds have been made stronger upon addition of the more electronegative atom. Each C-H bond length is 1.08 Å, each C-N bond is 1.35 Å and the N-H bond is 1.02 Å. The bond angles range from 117 to 124 °, similar to boratabenzene.
| Type of charge display | Image |
| Colour atoms by charge | |
| Show numbers |
The charge range is -0.486 to +0.486.
From the NBO analysis, it is found that the C-N bond has 37% from the C and 63% from the N. The orbital contributions suggest a sp3 C orbital(!) and a N sp2 orbital. The pi type bond between C and N is only 28% C and 72% N. The H-N bond is 25% H (s) and 75% N (sp3(!)).
This time, there are two sets of orbital mixes with E(2)>20. Bonding C1-C2 and anti-bonding C4-C5 has E(2)=20.68; bonding C3-N12 and anti-bonding C1-C2 has E(2)=20.25; bonding C4-C5 and anti-bonding C3-N12 has E(2)=47.85; anti-bonding C3-N12 and anti-bonding C4-C5 has E(2)=49.28.
The most stable bonds are the C-N bonds (non-pi) (-1.06), followed by C-C (-0.93), C-N (pi) (-0.57), C-C (pi) (-0.47), N-H (-0.89) and C-H (-0.75).
Borazine
The ring of borazine is made up of alternating boron and nitrogen atoms.

| Name | Structure |
| File type |
log |
| Calculation type |
FOPT |
| Calculation method |
RB3LYP |
| Basis set |
6-31G(d,p) |
| Charge |
0 |
| Spin |
Singlet |
| Final energy (a.u.) |
-242.68459891 |
| RMS Grad Norm (a.u.) |
0.00010587 |
| Dipole moment |
0.0001 D |
| Point group |
C1 |
| Calculation time |
1m 38 secs |
Item               Value     Threshold  Converged?
 Maximum Force            0.000114     0.000450     YES
 RMS     Force            0.000048     0.000300     YES
 Maximum Displacement     0.000558     0.001800     YES
 RMS     Displacement     0.000206     0.001200     YES
 Predicted change in Energy=-3.585769D-07
 Optimization completed.
    -- Stationary point found.
Low frequencies ---   -8.7385   -1.2062   -0.0009   -0.0001    0.0002    6.6430
 Low frequencies ---  289.5220  289.6665  404.7099
The optimisation file is linked to here. The frequency file is linked to here. The population analysis file is linked to here: DOI:10042/26132
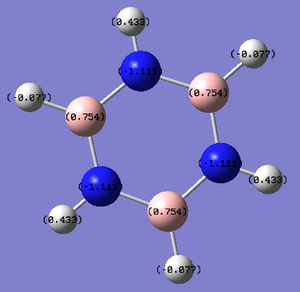
For borazine, the N-H bond length is 1.01 Å, the B-H bond length is 1.20 Å and each B-N bond length is 1.43 Å (a literature value is 1.44 Å[7]). There is variation in the bond angles, from 117 to 123 °.
| Type of charge display | Image |
| Colour atoms by charge | |
| Show numbers |
The charge range is -1.111 to +1.111.
In borazine, there are two types of B-N bonds. The first is 77% B and 23% B, both sp2 orbitals. The second is 88% N and 12% B, this being the one using p orbitals. The H-N bonds are 28% H and 72% N (s and sp3 respectively) and the B-H bonds are 46% B and 54% H (sp2 and s respectively). The order of bond energies has N-B (non pi) lowest (-0.68) followed by N-H (-0.61), B-H (-0.41) and N-B (pi) (-0.27).
Comparing the charge distributions

| Benzene atom | Benzene charge | Boratabenzene atom | Boratabenzene charge | Pyridinium atom | Pyridinium charge | Borazine atom | Borazine charge |
|---|---|---|---|---|---|---|---|
| C1 | -0.238 | B1 | +0.202 | N1 | -0.481 | N1 | -1.11 |
| C2 | -0.238 | C2 | -0.588 | C2 | 0.072 | B2 | 0.754 |
| C3 | -0.238 | C3 | -0.250 | C3 | -0.242 | N3 | -1.11 |
| C4 | -0.238 | C4 | -0.340 | C4 | -0.119 | B4 | 0.754 |
| C5 | -0.238 | C5 | -0.250 | C5 | -0.242 | N5 | -1.11 |
| C6 | -0.238 | C6 | -0.588 | C6 | 0.072 | B6 | 0.754 |
| H1 | +0.238 | H1 | -0.097 | H1 | 0.486 | H1 | 0.433 |
| H2 | +0.238 | H2 | 0.184 | H2 | 0.285 | H2 | -0.077 |
| H3 | +0.238 | H3 | 0.179 | H3 | 0.297 | H3 | 0.433 |
| H4 | +0.238 | H4 | 0.186 | H4 | 0.291 | H4 | -0.077 |
| H5 | +0.238 | H5 | 0.179 | H5 | 0.297 | H5 | 0.433 |
| H6 | +0.238 | H6 | 0.184 | H6 | 0.285 | H6 | -0.077 |
The charge distribution in benzene is, unsurprisingly, the simplest of all. Each carbon atom has the same negative charge, -0.238, and each H atom has the same positive charge, equal in magnitude but opposite in sign to that of carbon. This reflects the idea that there is more electron density in the ring itself (in the pi cloud) and that carbon is more electronegative than hydrogen. The range of -0.238 to +0.238 is relatively small compared to the benzene derivatives; the electronegativity difference is not large.
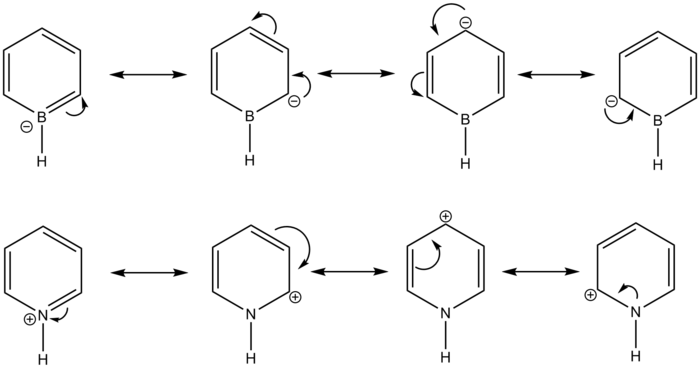
Boratabenzene has a more interesting charge distribution. H is slightly more electronegative than B, hence for the B-H unit, it is H that has the negative charge and B with the positive charge. However, because this electronegativity difference is even smaller than for C and H, the charges on these two atoms are smaller than those in benzene. The carbons adjacent to the B have increased negative charge compared to benzene carbons; they are attached to both a more electropositive H but this time also the even more electropositive B. The next pair of carbon atoms around the ring are again have more negative charge than those in benzene, but reduced compared to the carbons attached to B. However, the carbon para- to the boron has more negative charge than the pair next to it. This can be rationalised by considering the possible resonance forms for the anion, drawn below. There are canonical forms in which the negative charge is on the B atom, and also on the carbons at ortho- and para- positions to the boron. This leaves the meta- position with the lowest negative charge of all carbons. The ring as a whole has a more negative charge than for benzene (-1.814); when the total charge of the H atoms (+0.815) is taken into consideration, this leaves the overall -1 charge of the anion.
In pyridinium, the N-H unit displays the largest charges, due to the high electronegativity of nitrogen. Its H atom has a more or less equal in magnitude but opposite in sign charge. The carbons adjacent to the N display a small positive charge; however, the remaining carbons and hydrogens display similar charge distribution to that of benzene. The meta- positions to the nitrogen has more negative charge than the para- position; again, this can be rationalised by drawing resonance forms, which feature a form with the positive charge on the para- position, but none with the positive charge on the meta- positions. Because pyridinium has a positive charge, of course this means that there is less negative charge in the ring itself than in benzene.
Borazine has an overall neutral charge. Each nitrogen has the same, large negative charge and every boron has the same, large (though slightly reduced) positive charge, reflecting the large electronegativity difference between the two atoms. Each boron H and nitrogen H has the same charge with charge signs reflecting that of B/N. The boron H has a very small negative charge, reflecting the much higher electronegativity of the nitrogen atom also attached to each B.
Comparing the molecular orbitals
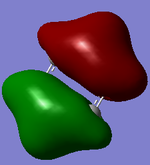
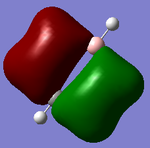
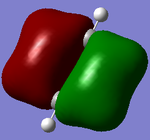
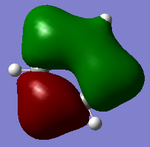
The three molecular orbitals chosen to compare were the three lowest orbitals (not including the core orbitals). These are MOs 7,8 and 9. These were chosen for their simplicity, allowing general ideas to be explored more clearly.
| Molecular orbital | Image | Molecular orbital | Image |
| Benzene 7: -0.84624 A.U. | Boratabenzene 7: -0.60393 A.U. | ||
| Benzene 8: -0.73992 A.U. | Boratabenzene 8: -0.51913 A.U. | ||
| Benzene 9: -0.73992 A.U. | Boratabenzene 9: -0.46063 A.U. |
| Molecular orbital | Image | Molecular orbital | Image |
| Pyridinium 7: -1.20934 A.U. | Borazine 7: -0.88193 A.U. | ||
| Pyridinium 8: -1.02549 A.U. | Borazine 8: -0.83040 A.U. | ||
| Pyridinium 9: -0.99157 A.U. | Borazine 9: -0.83040 A.U. |
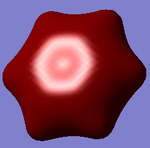
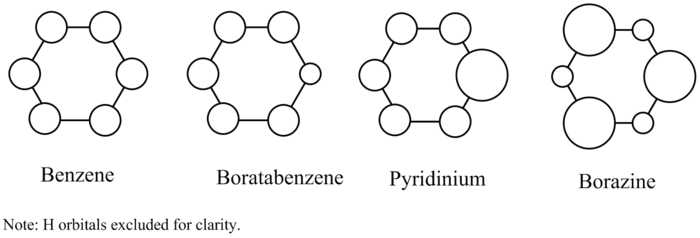
Molecular orbital 7 is that in which each C and H s orbital is involved and in phase and is therefore totally bonding. For benzene, there is equal contribution from each C 2s orbital; on the MO diagram, each orbital is depicted as having the same size. This would not be the case for boratabenzene; carbon is more electronegative than boron and hence its orbitals sit at lower energy, meaning that this bonding orbital would have more contribution from the C 2s orbitals than the B 2s orbitals; the B 2s orbital would be drawn smaller than those of C on an MO diagram. This would be opposite to pyridinium, where the more electronegative N would have more stable orbitals and hence a greater contribution to the MO. In borazine, each nitrogen would have the same, larger contribution compared to each boron which would have the same, smaller contribution. This is all reflected in the images above: for benzene, the electron cloud is spread evenly over the ring; in boratabenzene there is a lack of electron density on the B; in pyridinium an increased electron density on the N; and in borazine, the MO is as in benzene, but with undulating electron density around the ring as each B and N is passed. Molecular orbital 7 is of lowest energy for pyridinium; then borazine, benzene, boratabenzene. The electronegativity of N in pyridinium stabilises the orbitals of N, and hence of the MO itself. Boron has the opposite effect in being more electropositive than carbon. One interesting feature present in each of the MO 7s is the slight indentation in the MO, demonstrating that electron density is being preferentially pulled towards the plane of the ring.
The theory behind molecular orbitals 8 and 9 is similar to that of 7, however an additional interest is the degeneracy of these MOs in benzene. These MOs are still strongly bonding (although of not insignificantly higher energy than MO 7) and this time feature a node halfway between a set of either 3 or 4 sets of carbon and hydrogen bonding interactions. For benzene, it can be seen that these MOs are exactly symmetric. In boratabenzene, however, there is a loss of degeneracy with MOs 8 and 9, with an energy difference of 0.0585 A.U. This loss of degeneracy can clearly be seen in the lack of symmetry in the two MOs. Unsurprisingly, it is the MO which includes a contribution from the B atom which is of higher energy; the other contains only carbon (and hydrogen) orbitals, lacking the more electropositive B atom. In pyridinium, too, there is loss of degeneracy between MOs 8 and 9. Their energy difference this time is only 0.03392 A.U. Using the same reasoning, it is the MO that has more contribution from the N atom that is lower in energy, due to the stabilising effect of the more electronegative N atom. In borazine, the degeneracy with MOs 8 and 9 is restored, as might be expected. Although the forms of the MOs look slightly more unusual, each features the same contribution from the B and N atoms, and is hence of equal energy. The ordering of MOs between molecules is as for MO 7 (pyridinium lowest, then borazine, benzene and boratabenzene) which is not surprising.
| Molecule | Energy (A.U.) |
| Benzene | -232.25820396 |
| Boratabenzene | -219.02052295 |
| Pyridinium | -248.66806081 |
| Borazine | -242.68459891 |
It has been seen that for the MOs chosen above, the energy ordering each time had pyridinium lowest, then borazine, benzene and boratabenzene. (This is mainly true for the entire set of molecular orbitals, with some variation; for example, the LUMO of benzene is more stable than that of borazine). This is reflected in the overall energies of the molecules, found early on after optimisation of the molecules (collected in the table above). This showed that pyridinium is actually the most stable of the molecules, followed by borazine and benzene, with the least stable being boratabenzene. In other words, pyridinium is the most aromatic of all the molecules. There are several definitions of aromaticity; Huckel's rule states that there must be 4n + 2 delocalised electrons; 6 for benzene, and indeed each of the molecules thanks to the presence of the negative charge on boratabenzene or on the positively charged pyridinium, the lone pair of the nitrogen. This means that each of these molecules is isoelectronic. Although the energy difference between the molecules is fairly small when using A.U., it is to be remembered that in more conventional units - kJ/mol - the differences would be large.
This mini-project has allowed exploration of the topic of aromaticity through carrying out calculations on four different aromatic molecules. The calculations as run all successfully found optimised minimums for the molecules, using the same, relatively simple, basis set each time (6-31G(d,p). This was appropriate for these molecules, each of which contains only 2nd row elements. However, it is not the case that further, more complex calculations could have given better results (this can be seen in the calculated bond lengths, each of which is close (or equal) to literature, but there is room for improvement).
References
- ↑ C-Y. Ng, Vacuum Ultraviolet Photoionization and Photodissociation of Molecules and Clusters, World Scientific, Singapore, 1991, pp. 29
- ↑ K. Balasubramanian, J. X. Tao, D. W. Liao, J. Chem. Phys., 1991, 95, 4905-4913
- ↑ M. Satake, S. A. Iqbal, Chemistry of P-Block Elements, Discovery Publishing House, India, 1995, pp. 38
- ↑ M. Elanany, P. Selvam, A. Endou, M. Kubo, A. Miyamoto, Studies in Surface Science and Catalysis, 2004, 154, 1763-1768
- ↑ P. M. Dewick, Essential of Organic Chemistry, Wiley, Chichester, 2006, pp. 44
- ↑ J. C. Kotz, P. M. Treichel, J. R. Townsend, Chemistry and Chemical Reactivity, Thomson Higher Education, Belmont, 7th edn., 2009, pp. 432
- ↑ P. B. Saxena, Chemistry of Interhalogen Compounds. Discovery, Delhi, 2007, pp. 75

