Rep:Mod:XYZ1234126
Modeling the thermal expansion of MgO
Introduction
Magnesium oxide is an ionic crystal with a simple structure, similar to that of rock salt. O2- anions fill all the octahedral sites in a face-centred cubic lattice of Mg2+ cations, (the reverse is also possible). Thus there is an octahedral coordination environment around each ion. [1]
This experiment investigates the phonons and free energy of a MgO crystal. The aim is to use computer simulations to model the thermal expansion of the crystal, hence decipher the thermal expansion coefficient. In estimating the aforementioned thermodynamic properties, comparisons are made between lattice dynamics (LD) and molecular dynamics (MD) methods.
Lattice dynamics describes the motion of the nuclei in a solid based on the quasi-harmonic model. [2] The electrons can be largely ignored due to the Born-Oppenheimer approximation. This assumes that because electrons move much faster than the nuclei they are always in an equilibrium configuration when the nuclei are moving.[3] The harmonic approximation expresses the energy, between all neighbouring atoms, as a Taylor series expansion. Terms with orders higher than two are neglected. [4] The result is a parabolic function. The quasi-harmonic model treats a three-dimensional lattice as a collection of independent harmonic oscillators. These make up the quantum mechanical energy levels of the system. The levels are used to calculate the Helmholtz free energy, F(T,V). This can then be used to derive all thermodynamic functions. [5]
Molecular dynamics is a computer simulation technique that follows the time evolution of a set of interacting atoms by solving Newton’s, second-order differential, equations of motion. [6] These equations are integrated to give trajectories that the atoms move along; from these trajectories physical properties of a system are measured by taking an arithmetic average. A prerequisite of integration is that the initial positions and velocities of the atoms as well as the instantaneous forces acting on them must be known. Therefore a suitable force field must also be selected to define the physical model of the simulated system.
Computational methods
The General Utility Lattice Program (GULP) and DL Visualize (DLV) program were used to generate and visualize the experimental results respectively. The GULP software was designed, more than a decade ago, specifically for the simulation of solids based on interatomic potential models. The most computationally demanding stage in the simulation of the solid is the minimisation of the energy. GULP commonly achieves this by optimization of the system at constant pressure. [7] DLV is a platform that allows the output of GULP calculations to be visualised and analysed. It also enables the data inputted into computational programs to be controlled. [8]
Results and Discussion
Computing lattice energy
In modeling the motion of atoms in a solid a variety of interatomic forces must be considered. For instance, electrostatic, dispersive and repulsive interactions. A function commonly used for the repulsive interaction is an exponential term called the Born-Mayer interaction.[3] This is typically combined with the r-6 dispersive interaction to give the Buckingham potential. [3] this force field is selected to compute the lattice energy of MgO.
The total energy of a crystal is equal to the sum over all the individual interactions between all atoms in the infinite lattice.[3] This summation is computationally impossible[3] so, where possible, we only focus on interactions between atoms that are a set distance apart. However for coulombic interactions, the Ewald Sum, a more complex mathematical technique, is required to obtain an accurate lattice sum.[3] After running the GULP calculation the energy output was -41.0753 eV (to 4.d.p).
Computing the phonon modes
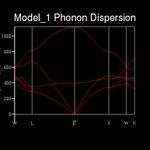
For a three-dimensional crystal with n atoms per unit cell, there are 3n different combinations of motion. Each combination will have a unique frequency (ω) at a given wave vector (k). [3] In general the crystal will contain all possible vibrational modes as a linear superposition at any time. [3] Every phonon can be labelled with a k-vector that has three components. For example the k-vector encompasses information on the direction and wavelength of the phonon. The angular frequency (ω) is also a function of k.[3] The dispersion curve of MgO (Figure 1) is generated by computing the phonon frequencies at 50 points along a path (Brillouin zone) in reciprocal space. Special points and lines of symmetry in the aforementioned path are denoted by letters, seen on the x-axis of figure 1.
Computing phonon density of states
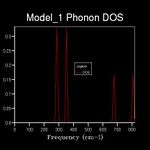
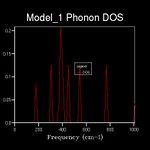
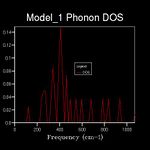
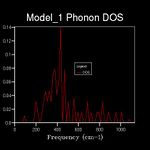
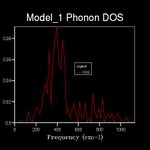
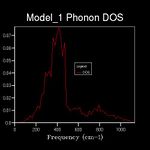
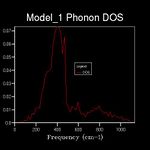
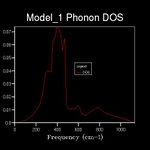
The energy of a vibration depends only on its frequency. Thus in order to estimate the free energy of a crystal a sum over all of the lattice vibrations is made. [3] This is computationally achieved by summing over a finite number of points on a grid. The density of the grid is controlled by a shrinking factor along each cell vector.[7] Examination of figures 2-9 reveals that as the grid size increases, the number of peaks that make up the density of states (DOS) increases drastically. For example doubling the grid size from 2x2x2 (Figure 3) to 4x4x4 (Figure 5) results in an almost 3 fold increase in the number of distinct peaks. Further increase in grid size leads to a continuous function that eventually becomes smoother at very high grid sizes e.g. 60x60x60 (Figure 9). The larger the grid the larger the number of k-points sampled per frequency hence the large the density per state. For a 1x1x1 the only k point sampled is (0.5,0.5,0.5).
A grid size of 14x14x14 gives a reasonably precise approximation owing to the fact that it produces a function that strongly resembles the result of a DOS calculation using a grid size of 60x60x60(Figure 9). This suggests that grid sizes higher than 14x14x14 do not cause significant changes in the accuracy of the approximation. This was further evident from the graphs obtained for grid sizes of 16x16x16, 20x20x20 etc. The DOS computed with grid sizes lower than 14x14x14 is discontinuous and fluctuates more (i.e. 6x6x6 (Figure 6) and 12x12x12 (Figure 7) respectively). Hence these approximations are less likely to be accurate. The density of states uses the list of frequency values from the dispersion curve and converts it into a frequency distribution over a grid of k-points.
Comparison to other crystal systems
The crystal structure of calcium oxide is virtually identical to that of MgO. However with Ca atoms being larger, the lattice constant of the CaO unit cell is double that of MgO. Doubling the real lattice halves the reciprocal space, therefore CaO may require a slightly smaller grid size for a reasonable DOS approximation. Zeolites are crystalline aluminosilicates, made up of corner-sharing AlO4 and SiO4 tetrahedra. Faujasite, like MgO, crystallizes in a cubic structure, with a lattice constant as high as 25.1Å. [9] The number of atoms in the unit cell and the size of the unit cell are both considerably larger than for MgO. The former presumably affects phonon characteristics of the Faujasite crystal and results in there being more branches in the dispersion diagram. This in turn may impose the requirement of a higher optimal grid size. The optimal grid size elucidated for MgO may not be appropriate for metallic crystal lattices such as Lithium because of the high symmetry [10] of these systems. More degenerate modes may be observed in the frequency dispersion. Therefore the grid size may have to increase or decrease to account for this.
Calculation of the free energy
The free energy is computed by summing over a finite grid of k-points. Thus the accuracy of this calculation is dependent on this grid size. Consequently, the free energy was computed at increasing grid sizes in order to find the optimal grid size. Figure 10 demonstrates the outcome of these optimizations. Initially as the grid size increases the free energy spikes to a maximum, decreases a little and then plateaus at a constant vale of -40.9765 meV (to 4.d.p). For calculations accurate to 1 meV per cell a 1x1x1 grid will suffice. For 0.5 meV a grid size of 2x2x2 is appropriate. For 0.1 meV 3x3x3 is suitable. Fluctuations in the sixth decimal place of the free energy stopped when the grid size reached 18x18x18. Consequently this was selected as the optimal grid size for succeeding thermal expansion investigations. The CPU time required for large grid sizes was surprising fairly short so maximizing accuracy was prioritized.

Comparison to other crystal systems
The free energy of CaO, Faujasite and Li crystals will all be different. Though the free energy of CaO will be most similar to that computed for MgO. It is assumed that the magnitude of the optimal grid size will be independent of the system. In other words how quickly the free energy levels off is a factor that shouldn’t be linked to intrinsic properties of a crystal. However, some crystals may have more vibrational modes than others e.g. Faujasite vs MgO. The computed Free energy is a sum over the vibrational modes of the infinite crystal. Hence it is arguable that the free energy of systems like Faujasite may take longer to level off as the grid size increases.
Thermal expansion using Lattice dynamics

The equilibrium structure at any temperature is always that with the lowest free energy. So temperature dependence of a crystal structure can be modeled by calculating the minimum of the free energy. This is achieved using a GULP optimization calculation. The final lattice parameters and total energy, of the system at different temperatures, were extracted from the log files and used to probe the thermal expansion of MgO. From figure 11 it is clear that as temperature increases quadratic decay is exhibited by the free energy. Hence the magnitude of the free energy increases. This is behavior is expected given that A=U-TS. Where A= Helmholtz free energy, U=internal energy, T= temperature and S=entropy. Thus the higher the energy the more negative A becomes. The gradient of the curve significantly increases as the temperature approaches the melting point of MgO (see Figure 11).
The graph of temperature against lattice constant (Figure 12) illustrates quadratic growth over the temperature range investigated. This result coincides with typical macroscopic behavior of solids. Increased temperatures result in occupation of higher vibrational energies and thus, on average, larger separation between the atoms in the lattice.

The thermal expansion coefficient was calculated as 1.67x10⁻⁵ K-1 (using Equation 1) for a temperature of 300K. The literature value for the same temperature is 31.2x10⁻⁶ K-1 [11] This is almost 2 times larger than that computed which hints at inefficiencies in the approximations incorporated into the optimization performed. The quasi-harmonic approximation is one of the key approximations made. It assumes that anharmonicity is restricted to thermal expansion.Thermal expansion is not a harmonic effect. Hence why the quasi-harmonic model is needed. It essentially incorporates anharmonic interactions explicitly into calculations of structure and lattice dynamics via so-called ‘renormalization’ of the vibrational frequencies. [12]

For a diatomic molecule with an exactly harmonic potential the bond length would not increase with temperature because the interatomic potential is completely symmetric. Therefore the average value of interatomic separation does not change. Contrastingly when the quasi-harmonic approximation is adopted the interatomic potential looses its symmetry [13]. Thermal expansion arises from the asymmetry or anharmonicity of interatomic force fields. Increasing the temperature increases the average amplitude of phonons. For an anharmonic potential, higher amplitudes also mean increased average values of interatomic separation i.e. thermal expansion.
As the temperature increases, the phonon frequencies decrease since the atoms are getting further apart and interatomic interactions weaken. In light of this, as the temperature approaches the melting point, the phonons become increasingly poor representations of the motions of the individual ions. This is because at these high temperatures the rigid lattice structure has almost entirely broken down. A solid crystal lattice is inherent in defining a phonon. If that lattice no longer exists the phonon modes are rendered inept.
Thermal expansion using molecular dynamics
Molecular dynamics simulations were run using a Isothermal-isobaric ensemble, time step of 0.6 femtoseconds and 500 Equilibration steps. An average cell volume was identified at different temperatures. Given that MD calculations use a conventional cell, the computed average cell volume was converted into cell volume per primitive unit cell. The thermal expansion model using the quasi-harmonic approximation (QHA) was then compared to MD simulations (Figure 13).

The clearest difference between the two techniques is that MD predicts a linear thermal expansion whereas QHA predicts a quadratic thermal expansion. However within the temperature range of 500-1000K, differences between QHA and MD estimations are small. Significant discrepancies are seen at very low and very high temperatures. In addition MD consistently predicts a smaller thermal expansion than QHA.
Below 300K the cell volume from quasi-harmonic calculations levels off as temperature decreases to 0K. On the contrary Molecular dynamics calculations illustrate a constant linear decay as the temperature approaches 0K. What’s more, MD calculations cannot be computed at 0K. This is because at 0K the system has zero kinetic energy, thus no trajectories can be projected. However in the QHA a quantum mechanical outcome of restricting a diatomic to a parabolic motion is the zero point energy. Therefore at low temperatures the QHA makes more accurate predictions than MD. At high temperatures however, the quasi-harmonic model is insufficient, as it cannot accurately model phase transitions.
In the MD model, at high temperatures one would expect a dramatic increase in volume over a very short temperature range due to a phase transition. Conversely this spike in volume is likely not to be observed in the quasi-harmonic model.
Conclusions
The calculations performed in this experiment were initially focused at extracting information about the phonons of the MgO lattice e.g. density of states computations. They later involved optimizations that effectively modeled the thermal expansion of MgO. The key findings from the optimizations were that free energy decreases with increasing temperature and the cell volume increases with temperature. Both of these conclusions are hugely predictable. But the natures of the MD thermal expansion and QHA thermal expansion are very different and the exact difference between them is less foreseeable. Molecular dynamics doesn’t apply restrictions to the motion of atoms therefore the estimations of thermal of expansion that it makes are accurate at high temperatures. At low temperatures MD cannot take into account quantum mechanical properties of the system. The opposite is true for the quasi-harmonic model. The fact that it constrains interatomic interactions to a particular force field becomes a burden at high temperatures. Hence the QHA predictions of thermal expansion are less reliable at high temperatures. But at low temperatures its “harmonic roots” help validate its approximation of thermal expansion.
References
- ↑ Crystal tutorial project, date accessed December 2015 [1]
- ↑ D.A Evans, P.T Landsberg et al. Solid state theory, methods and application, Wiley, 1969, p327.
- ↑ 3.00 3.01 3.02 3.03 3.04 3.05 3.06 3.07 3.08 3.09 M. T. Dove, Introduction to Lattice Dynamics, Cambridge University Press, 2010.1-17.DOI:10.1017/CBO9780511619885.003
- ↑ C. Chang, W. Chen, and M. K. Gilson, J. Chem. Theory Comput. 2005, 1, 1017-1028. DOI:10.1021/ct0500904
- ↑ The Quasiharmonic Approximation, date accessed December 2015 [2]
- ↑ Molecular Dynamics, date accessed December 2015 [3]
- ↑ 7.0 7.1 J. D. Gale, J. Chem. Soc., Faraday T rans., 1997, Vol. 93 DOI:10.1039/A606455H
- ↑ B.G. Searle, Computer Physics Communications Vol 137, Issue 1, June 2001, 25-32 DOI:10.1016/S0010-4655(01)00170-9
- ↑ J. A. Kaduk and J. Faber, The Rigaku Journal, 1995, Vol. 12, No. 2, p14
- ↑ M. T. Dove, Introduction to Lattice Dynamics, Cambridge University Press, 2010, 18-35. DOI:10.1017/CBO9780511619885.004
- ↑ O.L. Anderson, J. Phys. Chem. Ref. Data, Vol 19, No. 1, 1990
- ↑ M. T. Dove, Introduction to Lattice Dynamics, Cambridge University Press, 2010, 101-131. DOI:10.1017/CBO9780511619885.010 10.1017/CBO9780511619885.010
- ↑ Thermal properties, Date accessed December 2015, [4]
