Rep:Mod:XJB36170329
Conformational Analysis using Molecular Mechanics
The Hydrogenation of Cyclopentadiene Dimer
A cyclopentadiene dimer forms due to the cyclodimerisation between two cyclopentadiene. Only one endo dimer 2 is specially produced out of two expected dimers (endo 2 and exo 1). The cyclopentadiene dimer is further treated with short-time hydrogenation to give one of the dihydro derivatives 3 or 4 which after a prolonged hydrogenation the final tetrahydro derivative forms.
With the knowledge of favour towards the endo dimer, we can then evaluate the relative stabilities of two dimers in form of energy in order to decide whether the reaction is under thermodyamic or kinetic control. In similar way, 3/4 can be compared thus deciding the less strained one in a thermodynamic sense.

Procedure The ChemBio3D suite enables drawing of molecules in better 2D view and then automatically generated the 3D geometries which allows further analysis in Avogadro but it is not excellent for directly optimizing due to longer time and sometimes crashing of structures. Avogadro on the other hand as a 3D molecular modelling program, allows us here optimize the geometry using MMFF94s force field (suitable for most organic molecules) and analyze the relative contributions of energy in terms of total bond stretching energy, total angle bending energy, total stretch-bending energy, total torsitional energy, total van der Waals energy and total electrostatic energy.
Results
Dimer 1
Dimer_1 |
Dimer 2
Dimer_2 |
Dimer 3
Dimer_3 |
Dimer 4
Dimer_4 |
| Property | Dimer 1 (kcal/mol) | Dimer 2 (kcal/mol) | Dimer 3 (kcal/mol) | Dimer 4(kcal/mol) |
|---|---|---|---|---|
| Total Bond Stretching Energy | 3.54276 | 3.46959 | 3.30835 | 2.82268 |
| Total Angle Bending Energy | 30.77267 | 33.15574 | 30.86465 | 24.68612 |
| Total Stretch-bending Energy | -0.8361 | -2.07990 | -1.92667 | -1.65686 |
| Total Out-of-plane Bending Energy | 0.014904 | 0.20184 | 0.012340 | 0.00019 |
| Total Torsional energy | -2.72949 | -2.97281 | 0.05894 | -0.37702 |
| Total VAN DER WAALS Energy | 12.80021 | 12.39890 | 13.28121 | 10.63528 |
| Total Electrostatic energy | 13.01369 | 14.21518 | 5.12099 | 5.14703 |
| Total energy | 55.37348 | 58.20978 | 50.72283 | 41.25751 |
Discussion From the table we can see that the exo dimer 1 has lower energy than the actual preferred endo dimer 2 thus decideing the fact that the dimerisation is under kinetics control. It can be seen clearly from the table that the major energy difference exists in angle-bending energy between dimer 1 and 2. The greater angle bending energy for 2 indicates the more bending structure of it because of the positions of hydrogen. Similarly the dihydro derivative 4 with lower energy indicates the relative high stability thermodynamically. The main contribution of higher energy in 3 comes from the total bending energy and the total VAN DER WAALS energy.
Atropisomers are stereoisomers due to restricted rotation about single bonds where the high steric demand involves. In the synthesis of an important ovarian cancer drug - Taxol, the carbonyl group can point either up or down in the key intermediate as 9 or 10. Our job is to assess the stabilities of the two atropisomers thus to decide the stereochemistry of the intermediate.

Procedure As above
Results
9
9 |
10
Dimer_2 |
| Property | Intermediate 9 (kcal/mol) | Intermediate 10 (kcal/mol) |
|---|---|---|
| Total Bond Stretching energy | 7.66002 | 7.66332 |
| Total Angle Bending energy | 28.28087 | 19.27628 |
| Total Stretch-bending energy | -0.08421 | -0.14576 |
| Total Out-of-plane bending energy | 0.85227 | 0.83234 |
| Total Torsional energy | 0.27595 | 2.73232 |
| Total VAN DER WAALS energy | 33.13805 | 35.26373 |
| Total Electrostatic energy | 0.30098 | -0.26399 |
| Total energy | 70.54402 | 66.17233 |
Discussion

As the result, the atropisomer 9 is less stable than atropisomer 10 in terms of product energy in thermodynamic control. The formation is investigated to be made specificly through the endo-chair transition state (see four possible transition states in figure 3) with complete stereoinduction to produce stereochemically homogeneous bridgehead olefinic ketones[1]. The subsequent fuctionalisation of alkene reacts very slowly, mainly because of the olefinic strain which can be calculated by force field programs. There is large strain existed in bridgehead olefins due to the twisting around double bond which decreases the HOMO-LUMO difference thus these kinds of alkenes should be highly thermodynamically stable and unreactive[2].
Spectroscopic Simulation using Quantum Mechanics
A practice molecule: Spectroscopy of an intermediate relayed to the synthesis of Taxol
The two derivatives of 9 and 10 are molecules 17 and 18 which are shown below. These two are the products of a tandem [3.3] sigmatropic shift-methylation sequence. 17 is completely transformed into its more thermodynamically favored conformational isomer 18 after being heated in tetrahydrofuran for several days[3]. Their spectroscopic information has already been analysed in literature reports, our aim is to simulate the 1H and 13C spectra for these two to verify the validity of the assignment of literature spectra.

Procedure The ChemBio3D suite again can be used to draw molecule 17 and then it is analysed using Avogadro to minimize the energy by optimizing the structure. The position of atoms can be manually altered in order to correct the orientations. The NMR of such molecule can be generated using Avogadro by setting correct theory, basis, solvation model, frequency, etc. The following involves submitting to the HPC system, which is a powerful system for Gaussian calculations and generates corresponding DOI reference. After loading into GaussView with setting the appropriate nucleus and TMS reference value, NMR can be generated. Thermodynamic values can also be given by downloading the log file.
Results
Molecule 17
17 |
| Property | Derivative 17 (kcal/mol) |
|---|---|
| Total Bond Stretching energy | 15.49150 |
| Total Angle Bending energy | 32.54348 |
| Total Stretch-bending energy | 0.01666 |
| Total Out -of-plane Bending energy | 1.21223 |
| Total Torsional energy | 11.28734 |
| Total VAN DER WAALS | 51.63773 |
| Total Electrostatic energy | -7.54637 |
| Total energy | 104.46170 |
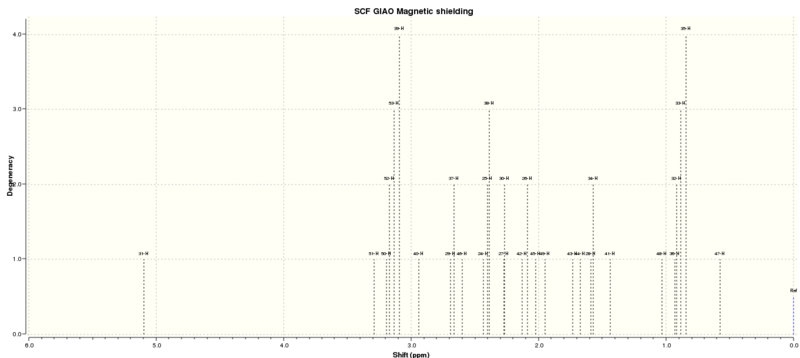
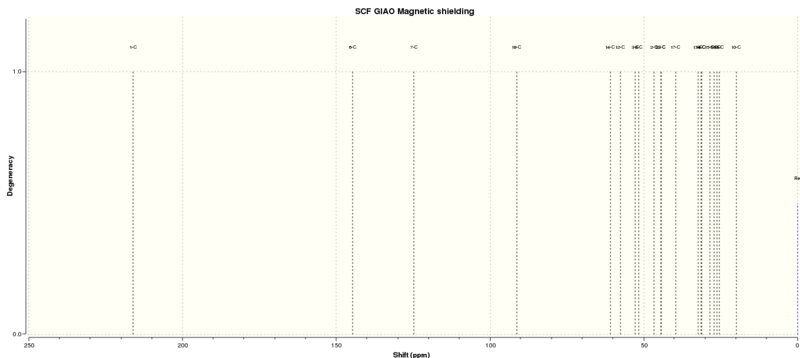
| Shift (ppm) | Degeneracy | Atoms |
|---|---|---|
| 5.6498472601 | 1.0000 | 24 |
| 3.4113292364 | 1.0000 | 40 |
| 2.7909488173 | 1.0000 | 37 |
| 2.7408334888 | 1.0000 | 39 |
| 2.6666433829 | 1.0000 | 38 |
| 2.6046646468 | 1.0000 | 36 |
| 2.5150020227 | 3.0000 | 51,33,29 |
| 2.1612673897 | 1.0000 | 27 |
| 2.0948517863 | 1.0000 | 53 |
| 2.0158715258 | 1.0000 | 25 |
| 1.9638852643 | 1.0000 | 30 |
| 1.8573933012 | 2.0000 | 34,24 |
| 1.7418806801 | 1.0000 | 26 |
| 1.6094444118 | 3.0000 | 40,41,42 |
| 1.2557013030 | 3.0000 | 43,44,45 |
| 1.0898032240 | 3.0000 | 37,38,39 |
| Shift (ppm) | Degeneracy | Atoms |
|---|---|---|
| 217.0103164970 | 1.0000 | 5 |
| 144.9261459465 | 1.0000 | 20 |
| 126.3502941015 | 1.0000 | 1 |
| 89.3987609555 | 1.0000 | 8 |
| 59.8871687192 | 1.0000 | 3 |
| 54.7843515100 | 1.0000 | 4 |
| 54.4024622649 | 1.0000 | 17 |
| 52.3356913042 | 1.0000 | 21 |
| 49.1626548825 | 1.0000 | 9 |
| 45.3849147228 | 1.0000 | 16 |
| 43.7459305267 | 1.0000 | 22 |
| 40.0753748699 | 1.0000 | 13 |
| 37.3677794227 | 1.0000 | 12 |
| 33.9422863194 | 1.0000 | 2 |
| 29.8859157277 | 1.0000 | 10 |
| 28.2114918679 | 1.0000 | 18 |
| 27.9950561772 | 1.0000 | 7 |
| 26.5464667301 | 1.0000 | 22 |
| 23.0725425500 | 1.0000 | 19 |
| 21.7038311635 | 1.0000 | 6 |
| Property | Hartree (=2625.5KJ/mol) | |
|---|---|---|
| Zero-point correction | 0.467587 | |
| Thermal correction to Energy | 0.489290 | |
| Thermal correction to Enthalpy | 0.419799 | |
| Thermal correction to Gibbs Free Energy | 13.28734 | |
| Sum of electronic and zero-point Energies | -1651.419969 | E0 = Eelec + ZPE |
| Sum of electronic and thermal Energies | -1651.398267 | E = E0 + Erot + Etrans |
| Sum of electronic and thermal Enthalpies | -1651.397323 | H = E + RT |
| Sum of electronic and thermal Free Energies | -1651.467758 | G = H - TS |
| 1H NMR shift (ppm) | Atom number | 13C NMR shift (ppm) |
|---|---|---|
| 5.21 | 1 | 221.49 |
| 3.00-2.70 | 6 | 148.72 |
| 2.70-2.35 | 4 | 120.90 |
| 2.20-1.70 | 6 | 74.61 |
| 1.58 | 1 | 60.53 |
| 1.50-1.20 | 3 | 51.30 |
| 1.10 | 3 | 50.94 |
| 1.07 | 3 | 45.53 |
| 1.03 | 3 | 43.28 |
| 40.82 | ||
| 38.73 | ||
| 36.78 | ||
| 35.47 | ||
| 30.84 | ||
| 30.00 | ||
| 25.56 | ||
| 25.35 | ||
| 22.21 | ||
| 21.39 | ||
| 19.89 |
Discussion The comparison of the computational NMR and the literature assigned NMR is fairly good but there is a general larger chemical shift in both the hydrogen and carbon NMR. Different chemical shift can be caused by different solvents, different conformations, chemical shift corrections etc.
Analysis of the properties of the synthesised alkene epoxides
The asymmetric synthesis can prepare chiral compounds in an enantiomerically pure form which is very important in drug synthesis. The synthetic progress of alkene epoxidation involves two chiral catalysts, the Shi and the Jacobsen catalyst.

The crystal structures of the two catalysts above
Procedure The Conquest program is used to either sketch or enter the chemical formula to search the Cambridge crystal database (CCDC) for the pre-catalysts 21 and 23. The subsequent results can be analysed in Mercury where possible angle, distance, tortion, etc. can be measured conveniently.
Result
Shi Catalyst
9 |
Jacobsen Catalyst
9 |
The Shi catalyst is a ketone catalyst derived from fructose which is introduced by Yian Shi and coworkers at Colorado State University[4].
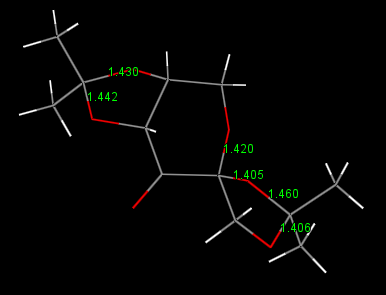
Discussion The bond lengths of the Shi catalyst are shown in above figure 8, the two anomeric centres has one C-O bond shorter and one longer than the normal bond length (the sum of covalent radii) which is about 143 pm. They are, reading from the graph, 146.0, 140.6, 143.0, 144.2 pm respectively. The inductive withdrawing effect of the carbonyl bond shorten the C-O bond where the donation of electrons from oxygen to the C-O anti-bonding orbital enlongate the bond length.
Jacobsen’s catalyst is a transition metal oxidation catalyst with a valent metal center and nitrogen and oxygen dononation to the center. The ligand binds to the center metal with four bonds which makes it tetradentate. To examine the catalyst from a side view, we can see that the molecule is almost planar (dihedral angle between aromatic rings about 170o). In this way the axial chlorine and the ortho-position t-butyl groups can be clearly examined that the steric effect is more pronounced [5].
The calculated NMR properties of your products
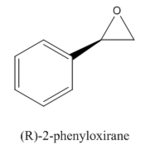
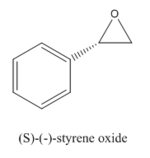
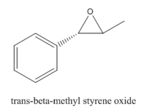
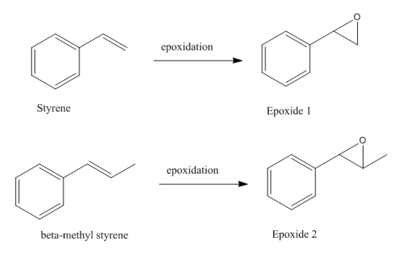
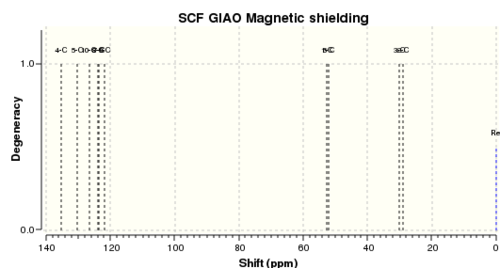
Styrene and β-methyl styrene, two alkenes are chosen out of four. Their epoxidation products are monitored by their NMRs using GaussView to check the integrity of them.
Results
Epoxide 1
1 |
Epoxide 2
2 |

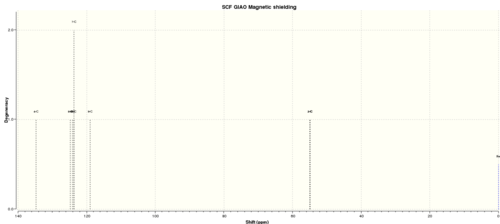
| Shift (ppm) | Degeneracy | Atoms |
|---|---|---|
| 134.7139527718 | 1.0000 | 4 |
| 124.8117539229 | 1.0000 | 8 |
| 124.0891234461 | 1.0000 | 6 |
| 123.6824374418 | 2.0000 | 5,7 |
| 119.0114744421 | 1.0000 | 9 |
| 54.9822658473 | 1.0000 | 2 |
| 54.8505447181 | 1.0000 | 1 |
| Shift (ppm) | Degeneracy | Atoms |
|---|---|---|
| 134.7139527718 | 1.0000 | 16,14,13,15 |
| 6.6067003260 | 1.0000 | 17 |
| 3.1841266572 | 1.0000 | 10 |
| 2.6461845145 | 2.0000 | 11 |
| 2.1223716068 | 1.0000 | 12 |

| Shift (ppm) | Degeneracy | Atoms |
|---|---|---|
| 6.8520619791 | 4.0000 | 19,17,16,18 |
| 6.6183560179 | 1.0000 | 20 |
| 2.9610261158 | 1.0000 | 11 |
| 2.3973330383 | 1.0000 | 12 |
| 1.2135656278 | 1.0000 | 14 |
| 1.1203497361 | 1.0000 | 13 |
| 0.2985045672 | 1.0000 | 15 |
| Shift (ppm) | Degeneracy | Atoms |
|---|---|---|
| 134.5769728051 | 1.0000 | 5 |
| 124.7553016300 | 1.0000 | 9 |
| 124.0049015147 | 1.0000 | 7 |
| 123.5456535466 | 1.0000 | 6 |
| 123.4401128953 | 1.0000 | 8 |
| 119.2291872352 | 1.0000 | 10 |
| 63.1815663967 | 1.0000 | 2 |
| 61.3649395888 | 1.0000 | 1 |
| 20.8578387954 | 1.0000 | 4 |
Assigning the absolute configuration of the product
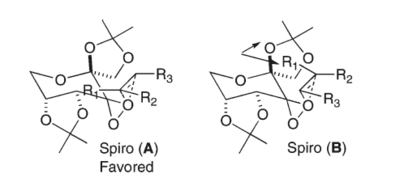
The ketone Shi catalyst is a very effective catalyst for the epoxidation of trans and trisubstituted olefins. The main reason for the enantioselectivity is steric effect. As the figure below showing the proposed transition states of the epoxidation, spiro A is supposed to be the major transition state whereas spiro B is the minor one due to the steric repulsion between the dimethyl ketal group and the substituent on the reacting alkene[6].
Procedure The assignment of the absolute configuration of the two epoxides can be done in three different ways. The first one involves searching in the Reaxys which is a powerful tool to find rotation values of enantiomers in literature. The second method involves computation of chiroptical properties which are the optical rotation at a specified wavelength of light thus comparing with that in the literature. The third methodology is to compute the electronic circular dichroism (ECD) and the vibrational circular dichroism (VCD).
Results
| Epoxide 1(R,R) | Epoxide 1(S,S) | Epoxide 2(R,R) | Epoxide 2(S,S) | |
|---|---|---|---|---|
| Optical rotation at 589nm | -29.17o | 15.23o | -321.21o | 238.21o |
Discussion The two enationmers are generated again to predict the optical rotation of an asymmetric molecule using the Cambridge variation on the B3LYP density functional method. The wavelength of the incident light is at 589nm and reading [ALPHA](5890.0A) gives the estimated optical rotation for the built enantiomer. These values can be compared to the literature values.
The properties of the data which we concern should be both the sign of the angle and the order of magnitude. Both of the signs are correct and the magnitude though not completely numerically accurate, gives a generally good results compared to the literature values. The experimental data shall be compared further after the synthesis lab.
Results
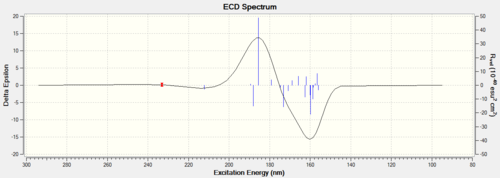
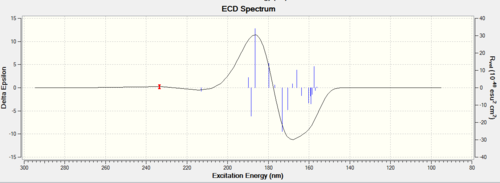
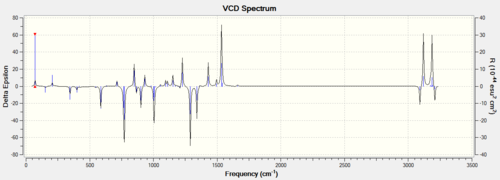
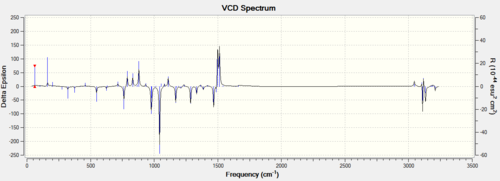
Discussion Both of the ECD and the VCD can be computed nowadays but they are not currently available in the complementary synthesis lab. The ECD is derived from the UV/Vis spectrum recorded with polarised light, which is in fact not useful for those epoxides because no appropriate chromophore exists but it is an useful way to practice in order to apply this technique in future analysis. VCD is an excellent technique instead derived from IR but also not available in the department. Those enantiomers should be in mirror image of each other in those spetra so only one of them is computed.
Results The relative computed free energies of the transition states can also be used to check the enantiomeric assignment. The eight Shi catalyst epoxidation for β-methyl syrene transition states are chosen to be computed using the log file. The total free energy for each system is given and after converting unit from Hartree to KJ/mol (1 Hartree = 2625.5 KJ). the difference in free energies can be calculated to get the corresponding k value (G = RT - lnk). The results are given in the below table.
| RR | SS | |
|---|---|---|
| Free energy of TS1 | -1343.02297 | -1343.017942 |
| Free energy of TS2 | -1343.019233 | -1343.015603 |
| Free energy of TS3 | -1343.029272 | -1343.023766 |
| Free energy of TS4 | -1343.032443 | -1343.024742 |
| Average G | -1343.02598 | -1343.020513 |
| Difference in G (in Hartree) | -0.00546625 | |
| Difference in G (KJ/mol) | -14351.6373 | |
| Value of k | 326.917 |
Discussion
In general, free energies of RR transition states are larger (-ve) than that of SS thus more energetically stable. The value of constant k reveals the excess RR enantiomer compared to SS.
Investigating the non-covalent interactions (NCI) in the active-site of the reaction transition state
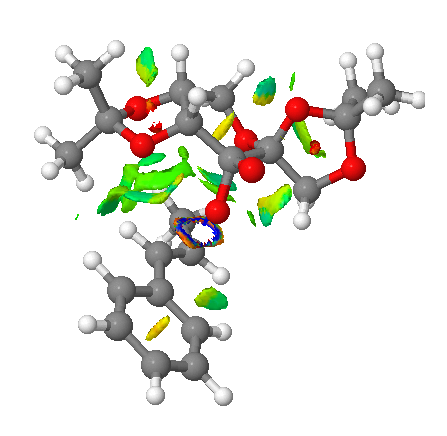
Non-covalent interactions (NCI) involves analysis of the properties of electron density. The colors indicates the interaction where blue = attractive, green = mildly attractive, yellow = mildly repulsive and red = strongly repulsive. Such interactions enables identification and characterisation of both stablization (hydrogen bonding in blue and dispersion in green) and destablization (steric repulsion in red)[7].
Investigating the Electronic topology (QTAIM) in the active-site of the reaction transition state

The QTAIM is a complementary technique to the NCI. The NCI deals with weak interactions where the QTAIM focuses on much stronger bonding interations in the covalent regions of molecule.
Suggesting new candidates for investigations
The above techniques can be applied to numerous of molecules. Reaxys is used here again for another epoxide with optical rotary power >500 or <-500. By selecting one of the qualified epoxides, the below synthesis route can be also given by Reaxys where 1 is the reacting alkene and 2 and 3 are S and R enatiomers respectively. The alkene is shown available for lab use thus providing an alternative way to do the comparison of computational and experimental.

| R | S | |
|---|---|---|
| Concentration | 0.03 | N/A |
| Solvent | ethanol | N/A |
| ORP | 853.9 deg | 50 deg |
| Wavelength | 324nm | 589nm |
| Temperature | 25o | N/A |
References
- ↑ 1.0 1.1 W. F. Maier, P. Von Rague Schleyer, J. Am. Chem. Soc., 1981, 103, 1891.DOI:10.1021/ja00398a003
- ↑ J. Am. Chem. Soc., 1981, 103, 1891.DOI:10.1021/ja00157a043
- ↑ 3.0 3.1 Spectroscopic data: L. Paquette, N. A. Pegg, D. Toops, G. D. Maynard, R. D. Rogers, J. Am. Chem. Soc.,, 1990, 112, 277-283. DOI:10.1021/ja00157a043
- ↑ J. Hanson,J. Chem. Educ., 2001, 78, 1266; DOI:10.1021/ed078p1266
- ↑ Caputo, CA; Jones, ND, Developments in Asymmetric Catalysis by Chiral Chelating Nitrogen-Donor Ligands, Dalton Transactions 41 (41): 1563–1602.DOI:10.1039/b709283k
- ↑ O. A. Wong , B. Wang , M-X Zhao and Y. Shi J. Org. Chem., 2009, 74, 335–6338; DOI:10.1021/jo900739q
- ↑ J. L. Arbour, H. S. Rzepa, J. Contreras-García, L. A. Adrio, E. M. Barreiro,K. K. Hii, Chem.Euro. J., 2012, 18, 11317–11324, DOI:10.1002/chem.201200547

