Rep:Mod:WongTimeNoSee
Computational Chemistry Laboratory: Module 2
by Eugene Wong
The use of computational chemistry extends from making calorimetric predictions, to predictions involving electronic structure. This computational chemistry laboratory module sees Gaussian being used as a calculation tool for investigating structural properties in inorganic chemistry, where bonding and structure is not just limited to 2-centre-2-electron bonds. A fair amount of emphasis is placed on symmetry and molecular orbital theory, with standard computational techniques such as IR frequency prediction. These will culminate in a mini-project which applies these computational techniques, in order to understand the effects of electron delocalisation with respect to structure, especially for a main group system such as S2N2.
Density Functional Theory (DFT) will be the main mode of calculation for the most part of this module. This semi-empirical[1] method is based on already-parameterised Hartree-Fock constants, and simplifies most of the calculation. The more thorough, ab initio MP2 calculation method will be used in the mini-project, as it is more specific for conjugated systems.
BH3
This section discusses BH3, with spectroscopic, and structural analysis of the molecule. The atoms involved in this case are relatively light, and minimal basis sets can be used with little or no error.
BH3 Optimisation Calculations
Optimisation of BH3[2] (via a DFT/RB3LYP method with a 3-21G basis set) yielded a trigonal planar molecule with H-B-H bond angles of 120o and all three B-H bonds having lengths of 1.19Å. The dipole moment of the molecule is shown to be zero, and the point group is determined to be D3h, which confirms its trigonal planar geometry. This was carried out following a perturbation where the bond lengths were set to an initial value of 1.5Å.
The details of this computational process, carried out by Gaussian, can be summarised by the following lines from the output files:
Filename = //icfs18.cc.ic.ac.uk/ew109/Desktop/Computational Chemistry/Module 2/BH3/EW109_BH3_OPTIMISE.LOG

OPTIMISE
File Name = EW109_BH3_OPTIMISE
File Type = .log
Calculation Type = FOPT
Calculation Method = RB3LYP
Basis Set = 3-21G
Charge = 0
Spin = Singlet
E(RB3LYP) = -26.46226433 a.u.
RMS Gradient Norm = 0.00004507 a.u.
Imaginary Freq =
Dipole Moment = 0.0000 Debye
Point Group = D3H
Job cpu time:  0 days  0 hours  0 minutes  5.0 seconds.
         Item               Value     Threshold  Converged?
 Maximum Force            0.000413     0.000450     YES
 RMS     Force            0.000271     0.000300     YES
 Maximum Displacement     0.001610     0.001800     YES
 RMS     Displacement     0.001054     0.001200     YES
 Predicted change in Energy=-1.071764D-06
 Optimization completed.
    -- Stationary point found.
                           ----------------------------
                           !   Optimized Parameters   !
                           ! (Angstroms and Degrees)  !
 --------------------------                            --------------------------
 ! Name  Definition              Value          Derivative Info.                !
 --------------------------------------------------------------------------------
 ! R1    R(1,2)                  1.1935         -DE/DX =    0.0004              !
 ! R2    R(1,3)                  1.1935         -DE/DX =    0.0004              !
 ! R3    R(1,4)                  1.1935         -DE/DX =    0.0004              !
 ! A1    A(2,1,3)              120.0            -DE/DX =    0.0                 !
 ! A2    A(2,1,4)              120.0            -DE/DX =    0.0                 !
 ! A3    A(3,1,4)              120.0            -DE/DX =    0.0                 !
 ! D1    D(2,1,4,3)            180.0            -DE/DX =    0.0                 !
 --------------------------------------------------------------------------------

The optimisation results show that by the fourth iteration, the RMS gradient has a value of zero, and thus energy minimisation of the molecular geometry was successful.
BH3 Frequency Calculations
The previously optimised BH3 molecule was subjected to frequency calculations[3] under the same method and basis set used previously. The results are as follows:
Filename = \\icfs18.cc.ic.ac.uk\ew109\Desktop\Computational Chemistry\Module 2\BH3\ew109_bh3_FREQUENCY.log

BH3 FREQ
File Name = ew109_bh3_FREQUENCY
File Type = .log
Calculation Type = FREQ
Calculation Method = RB3LYP
Basis Set = 3-21G
Charge = 0
Spin = Singlet
E(RB3LYP) = -26.46226433 a.u.
RMS Gradient Norm = 0.00004507 a.u.
Imaginary Freq = 0
Dipole Moment = 0.0000 Debye
Point Group = D3H
Job cpu time:  0 days  0 hours  0 minutes  3.0 seconds.
 Full mass-weighted force constant matrix:
 Low frequencies ---   -0.3716   -0.0098   -0.0018   37.2444   37.9574   37.9592
 Low frequencies --- 1146.0292 1204.8631 1204.8641
 Harmonic frequencies (cm**-1), IR intensities (KM/Mole), Raman scattering
 activities (A**4/AMU), depolarization ratios for plane and unpolarized
 incident light, reduced masses (AMU), force constants (mDyne/A),
 and normal coordinates:
                     1                      2                      3
                    A2"                    E'                     E'
 Frequencies --  1146.0292              1204.8631              1204.8641
 Red. masses --     1.2531                 1.1085                 1.1085
 Frc consts  --     0.9697                 0.9481                 0.9481
 IR Inten    --    92.6653                12.3919                12.3944
  Atom  AN      X      Y      Z        X      Y      Z        X      Y      Z
     1   5     0.00   0.00   0.16     0.00   0.10   0.00    -0.10   0.00   0.00
     2   1     0.00   0.00  -0.57     0.00   0.08   0.00     0.81   0.00   0.00
     3   1     0.00   0.00  -0.57    -0.38  -0.59   0.00     0.14   0.38   0.00
     4   1     0.00   0.00  -0.57     0.38  -0.59   0.00     0.14  -0.38   0.00
                     4                      5                      6
                    A1'                    E'                     E'
 Frequencies --  2591.6540              2730.0723              2730.0730
 Red. masses --     1.0078                 1.1260                 1.1260
 Frc consts  --     3.9883                 4.9447                 4.9447
 IR Inten    --     0.0000               103.8565               103.8497
  Atom  AN      X      Y      Z        X      Y      Z        X      Y      Z
     1   5     0.00   0.00   0.00     0.11   0.00   0.00     0.00   0.11   0.00
     2   1     0.00   0.58   0.00     0.02   0.00   0.00     0.00  -0.81   0.00
     3   1     0.50  -0.29   0.00    -0.60   0.36   0.00     0.36  -0.19   0.00
     4   1    -0.50  -0.29   0.00    -0.60  -0.36   0.00    -0.36  -0.19   0.00
The 6 "low" frequencies (-0.3716, -0.0098, -0.0018, 37.2444, 37.9574, 37.9592) should ideally be equal to zero. These are due to motion involving the centre of mass of the molecule, and can be reduced to +/- 10 cm-1 with use of a higher level method.
The predicted IR spectral data are shown in the Table 1 below:
| Vibrational Mode | Symmetry Label | Absorption Intensity | Bond Frequency (cm-1) | Literature Value* (cm-1)[4] | Percentage Error (%) | Diagram |
|---|---|---|---|---|---|---|
| Umbrella deformation | A2 " | 93 | 1144 | 1225 | 7 | 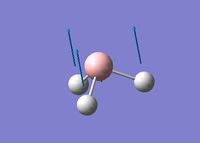 |
| Symmetric B-H scissoring | E' | 12 | 1204 | 1305 | 8 |  |
| Asymmetric B-H rocking | E' | 12 | 1204 | 1305 | 8 |  |
| Symmetric B-H stretch | A1' | 0 | 2598 | - | - |  |
| Asymmetric B-H stretch (1) | E' | 104 | 2737 | 2693 | 2 | 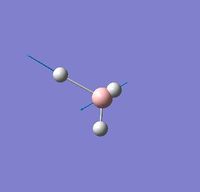 |
| Asymmetric B-H stretch (2) | E' | 104 | 2737 | 2813 | 3 | 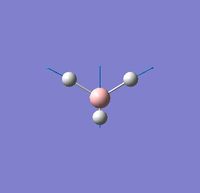 |
- Literature values obtained via ab initio calculations, using a HF method with a 6.31G* basis set.
The IR data obtained via this method are consistent with the literature values. While there are 6 vibrational modes for the BH3 molecule, only 3 are IR active. This is evident from their wavenumbers and relative intensities. The symmetric B-H stretching does not lead to an overall dipole moment and hence does not appear in the IR spectrum. Of the remaining 5 modes, two pairs are degenerate: The symmetric B-H scissoring and asymmetric B-H rocking at 1204 cm-1; and the asymmetric B-H stretches (1) and (2) at 2737 cm-1. These pairs of absorptions overlap to produce two of the three peaks observed in the IR spectrum.
BH3 Molecular Orbitals
The natural bonding orbitals (NBOs) and MOs[5] for BH3 were computed using Gaussian (same method and basis set as previously used). The MOs obtained by this method are listed in the following Figure 2, alongside their estimated counterparts, obtained using a Linear Combination of Atomic Orbitals (LCAO) method. This estimation considers the fact that hydrogen is more electronegative than boron, and thus the tri-hydrogen fragment orbitals are placed lower than their corresponding boron atomic orbitals.

It can be seen that in terms of symmetry the MOs calculated by Gaussian are in good agreement with their (LCAO) counterparts. This is particularly so for the HOMO-3, which represents the non-bonding 1s AO of the B atom. As seen in the other Gaussian calculated MOs, the bonding interactions excluded by the LCAO method are present, in the form of overlapping orbitals. The exact order of the LUMO+1, LUMO+2, LUMO+3 are not easy to predict based on qualitative arguments, and it can be seen from assignment of the two degenerate orbitals at +0.189 Hartrees that the two 2e" antibonding orbitals are slightly lower than the 3a1" anti-bonding orbital (assigned with the LUMO+3 at +0.192 Hartrees).
It can be said that qualitative MO theory, which is based on the nature of orbital overlap (s-s > s-p > p-p; σ > π) as well as qualitative energy difference between atomic orbitals involved in bonding, is useful in obtaining a rough estimate of the ordering of MOs. However, the unavoidable ambiguity that arises from MOs which are close in energy must be dealt with using a more relatively precise method, such as the one employed.
BH3 Natural Bond Orbitals
Estimation of the NBOs gives the 2c-2e bond order between the B and H atoms. The data present in the log file[5] shows that the B-H bonds have ~33% s-orbital and ~66% p-orbital character, confirming the complete sp2 nature of the bond.
       (Occupancy)   Bond orbital/ Coefficients/ Hybrids
 ---------------------------------------------------------------------------------
     1. (1.99853) BD ( 1) B   1 - H   2
                ( 44.48%)   0.6669* B   1 s( 33.33%)p 2.00( 66.67%)
                                            0.0000  0.5774  0.0000  0.0000  0.0000
                                            0.8165  0.0000  0.0000  0.0000
                ( 55.52%)   0.7451* H   2 s(100.00%)
                                            1.0000  0.0000
     2. (1.99853) BD ( 1) B   1 - H   3
                ( 44.48%)   0.6669* B   1 s( 33.33%)p 2.00( 66.67%)
                                            0.0000  0.5774  0.0000  0.7071  0.0000
                                           -0.4082  0.0000  0.0000  0.0000
                ( 55.52%)   0.7451* H   3 s(100.00%)
                                            1.0000  0.0000
     3. (1.99853) BD ( 1) B   1 - H   4
                ( 44.48%)   0.6669* B   1 s( 33.33%)p 2.00( 66.67%)
                                            0.0000  0.5774  0.0000 -0.7071  0.0000
                                           -0.4082  0.0000  0.0000  0.0000
                ( 55.52%)   0.7451* H   4 s(100.00%)
                                            1.0000  0.0000

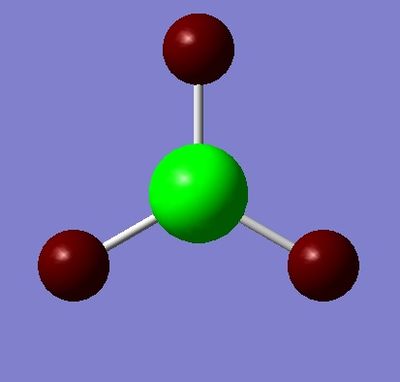
Figures 3 and 4 depict the electron density differences between the atoms. The higher electronegativity of H (charge = -0.11, red, electron rich) with respect to the B atom (+0.33, green, electron poor) is accounted for in these results. These are representative of the polar nature of the B-H bond.
Chemical Bonds: A Definition
Based on the results obtained from these calculations, the definition of a chemical bond thus has both classical and quantum mechanical origins. The classical interpretation involves a Hookean model, where the bonding electrons act as a "spring" of sorts connecting two positively charged nuclei. Quantum mechanical effects (which involve statistical treatment) are based on overlap of the atomic orbitals of the two atoms, and account for the occasional non-uniformity of these electron distributions between the two nuclei. Considering both the quantum mechanical interpretation (formation of two new molecular orbitals, one of which is bonding; from two atomic orbitals) as well as the classical interpretation (attraction between a nucleus and the valence electron of the other atom), it is possible to think of the chemical bond as a region of electron density largely localised between two atoms, which acts as the centre of attraction between these two atoms. This electron density region may behave classically as an elastic, spring-like tether.
TlBr3
As with the previous section, the same calculations will now be applied to a heavier molecule, TlBr3. With this molecule, special adjustments are made to accommodate the higher mass and larger electronic structure of these atoms.
TlBr3 Optimisation
TlBr3 was optimised[6] using a DFT/RB3LYP method, with a a LANL2DZ basis set. This basis set is larger than 3-21G, and possesses pseudo-potentials which were required for calculations involving heavy atoms such as Tl. On overall this yields a more accurate calculation result. The following excerpts from the log file, as well as Figure 5 show that the molecule's energy was minimised in three iterations.
The annotated Jmol file shows that the optimised geometry is trigonal planar for TlBr3, with a Br-Tl-Br bond angle of 120o and a Tl-Br bond distance of 2.65Å (lit value[7] 2.52Å, in aqueous solution).
Filename = //icfs18.cc.ic.ac.uk/ew109/Desktop/Computational Chemistry/Module 2/TlBr3/TLBR3_OPT.LOG

TlBr3 optimisation
File Name = TLBR3_OPT
File Type = .log
Calculation Type = FOPT
Calculation Method = RB3LYP
Basis Set = LANL2DZ
Charge = 0
Spin = Singlet
E(RB3LYP) = -91.21812851 a.u.
RMS Gradient Norm = 0.00000090 a.u.
Imaginary Freq =
Dipole Moment = 0.0000 Debye
Point Group = D3H
Job cpu time:  0 days  0 hours  0 minutes 13.0 seconds.
         Item               Value     Threshold  Converged?
 Maximum Force            0.000002     0.000450     YES
 RMS     Force            0.000001     0.000300     YES
 Maximum Displacement     0.000022     0.001800     YES
 RMS     Displacement     0.000014     0.001200     YES
 Predicted change in Energy=-6.083913D-11
 Optimization completed.
    -- Stationary point found.
                           ----------------------------
                           !   Optimized Parameters   !
                           ! (Angstroms and Degrees)  !
 --------------------------                            --------------------------
 ! Name  Definition              Value          Derivative Info.                !
 --------------------------------------------------------------------------------
 ! R1    R(1,2)                  2.651          -DE/DX =    0.0                 !
 ! R2    R(1,3)                  2.651          -DE/DX =    0.0                 !
 ! R3    R(1,4)                  2.651          -DE/DX =    0.0                 !
 ! A1    A(2,1,3)              120.0            -DE/DX =    0.0                 !
 ! A2    A(2,1,4)              120.0            -DE/DX =    0.0                 !
 ! A3    A(3,1,4)              120.0            -DE/DX =    0.0                 !
 ! D1    D(2,1,4,3)            180.0            -DE/DX =    0.0                 !
 --------------------------------------------------------------------------------

TlBr3 Frequency Calculations
The IR frequencies of TlBr3 were calculated[8] in a similar manner to BH3, albeit with a LANL2DZ basis set, for the same reasons stated earlier. The results are summarised in the excerpts from the log files below.
Filename = //icfs18.cc.ic.ac.uk/ew109/Desktop/Computational Chemistry/Module 2/TlBr3/ew109_tlbr3_freq.log

TlBr3 frequency
File Name = ew109_tlbr3_freq
File Type = .log
Calculation Type = FREQ
Calculation Method = RB3LYP
Basis Set = LANL2DZ
Charge = 0
Spin = Singlet
E(RB3LYP) = -91.21812851 a.u.
RMS Gradient Norm = 0.00000088 a.u.
Imaginary Freq = 0
Dipole Moment = 0.0000 Debye
Point Group = D3H
Job cpu time:  0 days  0 hours  0 minutes 14.0 seconds.
 Full mass-weighted force constant matrix:
 Low frequencies ---   -3.4213   -0.0026   -0.0004    0.0015    3.9367    3.9367
 Low frequencies ---   46.4289   46.4292   52.1449
 Harmonic frequencies (cm**-1), IR intensities (KM/Mole), Raman scattering
 activities (A**4/AMU), depolarization ratios for plane and unpolarized
 incident light, reduced masses (AMU), force constants (mDyne/A),
 and normal coordinates:
                     1                      2                      3
                    E'                     E'                     A2"
 Frequencies --    46.4289                46.4292                52.1449
 Red. masses --    88.4613                88.4613               117.7209
 Frc consts  --     0.1124                 0.1124                 0.1886
 IR Inten    --     3.6867                 3.6867                 5.8466
  Atom  AN      X      Y      Z        X      Y      Z        X      Y      Z
     1  81     0.00   0.28   0.00    -0.28   0.00   0.00     0.00   0.00   0.55
     2  35     0.00   0.26   0.00     0.74   0.00   0.00     0.00   0.00  -0.48
     3  35     0.43  -0.49   0.00    -0.01  -0.43   0.00     0.00   0.00  -0.48
     4  35    -0.43  -0.49   0.00    -0.01   0.43   0.00     0.00   0.00  -0.48
                     4                      5                      6
                    A1'                    E'                     E'
 Frequencies --   165.2685               210.6948               210.6948
 Red. masses --    78.9183               101.4032               101.4032
 Frc consts  --     1.2700                 2.6522                 2.6522
 IR Inten    --     0.0000                25.4830                25.4797
  Atom  AN      X      Y      Z        X      Y      Z        X      Y      Z
     1  81     0.00   0.00   0.00     0.42   0.00   0.00     0.00   0.42   0.00
     2  35     0.00  -0.58   0.00     0.01   0.00   0.00     0.00  -0.74   0.00
     3  35     0.50   0.29   0.00    -0.55  -0.32   0.00    -0.32  -0.18   0.00
     4  35    -0.50   0.29   0.00    -0.55   0.32   0.00     0.32  -0.18   0.00
The higher accuracy afforded by the LANL2DZ basis set is evident in the low frequencies, which are within 10 cm-1 of zero.
| Vibrational Mode | Symmetry Label | Absorption Intensity | Bond Frequency (cm-1) | Literature Value* (cm-1)[7] | Percentage Error (%) | Diagram |
|---|---|---|---|---|---|---|
| Umbrella deformation | A2 " | 6 | 52 | - | - |  |
| Symmetric B-H scissoring | E' | 4 | 46 | - | - | 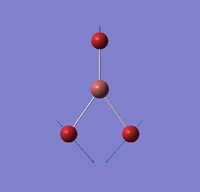 |
| Asymmetric B-H rocking | E' | 4 | 46 | - | - |  |
| Symmetric B-H stretch | A1' | 0 | 165 | - | - | 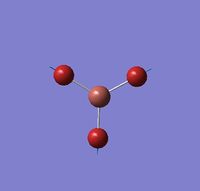 |
| Asymmetric B-H stretch (1) | E' | 25 | 211 | 220 | 4 | 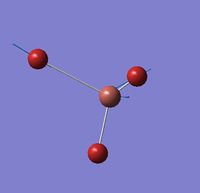 |
| Asymmetric B-H stretch (2) | E' | 25 | 211 | 220 | 4 | 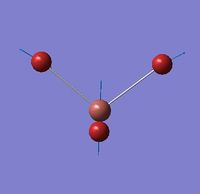 |
- Literature values obtained only for TlBr3 in aqueous solution.
The simulated vibrational modes are similar to those obtained for BH3. The calculated IR frequency for the Asymmetric B-H stretches (1) and (2) are in good agreement with the IR peak reported for aqueous TlBr3 in the literature. It is suspected that the low wavenumber scissoring and rocking, and umbrella deformation motions are not observed (in the literature) due to their low intensity. As with before, the symmetric stretch is not IR active. A high resolution (for example, FTIR) gas-phase IR spectrum would be expected to produce three bands: One due to degenerate symmetric and asymmetric B-H stretches, as previously mentioned (211 cm-1); one for the degenerate scissoring and rocking (46 cm-1), and one for the umbrella deformation (52 cm-1).
Stereoisomers of (Cl3P)2Mo(CO)4
Transition metal complexes are an integral part of inorganic chemistry. In this section, the same heavy atrom techniques will be applied in order to effectively describe the structural and spectroscopic nature of both stereoisomers of a Mo complex.
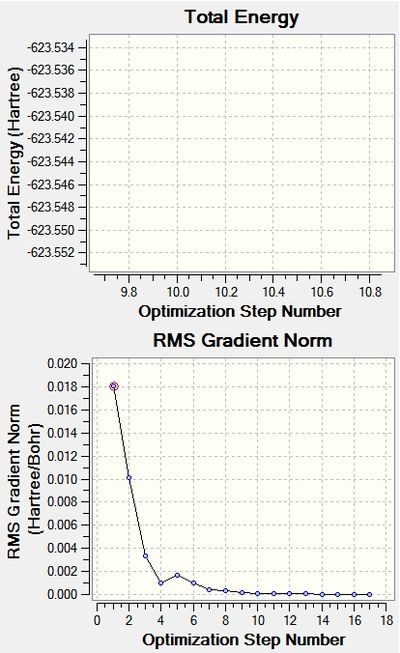
The cis- and trans- stereoisomers of (Cl3P)2Mo(CO)4 were subjected to a series of optimisations: LANL2MB, LANL2DZ and a LANL2DZ variant with an extra basis set to account for d-orbital interactions. As shown by the following optimisation data and Jmol files, the optimised geometries with Cl-P-Mo-C torsion angles of 0o are best obtained via calculations involving LANL2DZ with extra basis sets.
cis-(Cl3P)2Mo(CO)4
Optimisation: LanL2MB
Log[9] file excerpts:
Filename = //icfs18.cc.ic.ac.uk/ew109/Desktop/Computational Chemistry/Module 2/Mo cis- and trans-/log_56735_cis_Mo_LanL2MB.out

cis Mo lanl2mb
File Name = log_56735_cis_Mo_LanL2MB
File Type = .log
Calculation Type = FOPT
Calculation Method = RB3LYP
Basis Set = LANL2MB
Charge = 0
Spin = Singlet
E(RB3LYP) = -617.52501693 a.u.
RMS Gradient Norm = 0.00011114 a.u.
Imaginary Freq =
Dipole Moment = 8.4617 Debye
Point Group = C1
Job cpu time:  0 days  0 hours 12 minutes 32.7 seconds.
         Item               Value     Threshold  Converged?
 Maximum Force            0.000282     0.002500     YES
 RMS     Force            0.000083     0.001667     YES
 Maximum Displacement     0.005699     0.010000     YES
 RMS     Displacement     0.001408     0.006667     YES
 Predicted change in Energy=-1.577948D-06
 Optimization completed.
    -- Stationary point found.
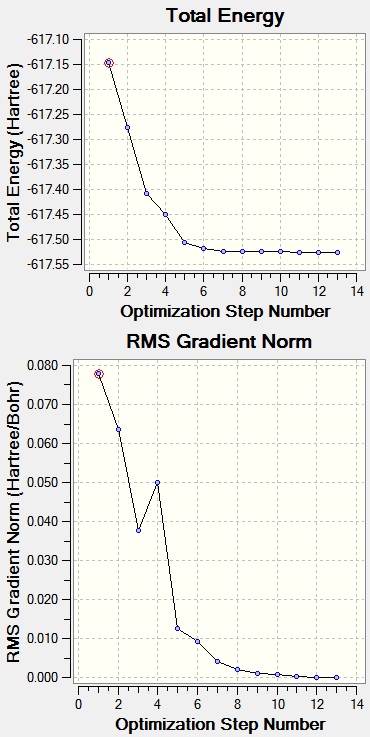
Optimisation: LanL2DZ
Log[10] file excerpts:
Filename = //icfs18.cc.ic.ac.uk/ew109/Desktop/Computational Chemistry/Module 2/Mo cis- and trans-/log_56747_cis_Mo_LanL2DZ.out

cis Mo lanl2dz
File Name = log_56747_cis_Mo_LanL2DZ
File Type = .log
Calculation Type = FOPT
Calculation Method = RB3LYP
Basis Set = LANL2DZ
Charge = 0
Spin = Singlet
E(RB3LYP) = -623.57707195 a.u.
RMS Gradient Norm = 0.00000344 a.u.
Imaginary Freq =
Dipole Moment = 1.3107 Debye
Point Group = C1
Job cpu time:  0 days  1 hours 15 minutes 14.6 seconds.
         Item               Value     Threshold  Converged?
 Maximum Force            0.000012     0.000450     YES
 RMS     Force            0.000003     0.000300     YES
 Maximum Displacement     0.001454     0.001800     YES
 RMS     Displacement     0.000343     0.001200     YES
 Predicted change in Energy=-3.696041D-09
 Optimization completed.
    -- Stationary point found.
Optimisation: LanL2DZ with an Additional Basis Set
Log[11] file excerpts:
Filename = //icfs18.cc.ic.ac.uk/ew109/Desktop/Computational Chemistry/Module 2/Mo cis- and trans-/ew109_cis_MO_opt_LanL2DZ_EXTRA_log_56764.out

cis Mo lanl2dz
File Name = ew109_cis_MO_opt_LanL2DZ_EXTRA_log_56764
File Type = .log
Calculation Type = FOPT
Calculation Method = RB3LYP
Basis Set = Gen
Charge = 0
Spin = Singlet
E(RB3LYP) = -623.69291232 a.u.
RMS Gradient Norm = 0.00000906 a.u.
Imaginary Freq =
Dipole Moment = 0.0748 Debye
Point Group = C1
Job cpu time:  0 days  1 hours 27 minutes 48.8 seconds.
         Item               Value     Threshold  Converged?
 Maximum Force            0.000019     0.000450     YES
 RMS     Force            0.000006     0.000300     YES
 Maximum Displacement     0.000884     0.001800     YES
 RMS     Displacement     0.000211     0.001200     YES
 Predicted change in Energy=-6.366525D-09
 Optimization completed.
    -- Stationary point found.

trans-(Cl3P)2Mo(CO)4
Optimisation: LanL2MB
Log[12] file excerpts:
Filename = //icfs18.cc.ic.ac.uk/ew109/Desktop/Computational Chemistry/Module 2/Mo cis- and trans-/log_56738_trans_Mo_LanL2MB.out

Trans-Mo optimisation lanl2mb
File Name = log_56738_trans_Mo_LanL2MB
File Type = .log
Calculation Type = FOPT
Calculation Method = RB3LYP
Basis Set = LANL2MB
Charge = 0
Spin = Singlet
E(RB3LYP) = -617.52216801 a.u.
RMS Gradient Norm = 0.00008689 a.u.
Imaginary Freq =
Dipole Moment = 0.2800 Debye
Point Group = C1
Job cpu time:  0 days  0 hours  8 minutes 32.7 seconds.
         Item               Value     Threshold  Converged?
 Maximum Force            0.000257     0.002500     YES
 RMS     Force            0.000075     0.001667     YES
 Maximum Displacement     0.006665     0.010000     YES
 RMS     Displacement     0.001745     0.006667     YES
 Predicted change in Energy=-1.456906D-06
 Optimization completed.
    -- Stationary point found.

[[File:Ew109 log 56738 trans Mo LanL2MB opt chart.jpg|thumb|400px|centre|'''''Figure 9:''''' Optimisation results for the trans-complex LanL2MB optimisation. '']]
Optimisation: LanL2DZ
Log[13] file excerpts:
Filename = //icfs18.cc.ic.ac.uk/ew109/Desktop/Computational Chemistry/Module 2/Mo cis- and trans-/log_56748_trans_Mo_LanL2DZ.out

Trans-Mo optimisation lanl2mb
File Name = log_56748_trans_Mo_LanL2DZ
File Type = .log
Calculation Type = FOPT
Calculation Method = RB3LYP
Basis Set = LANL2DZ
Charge = 0
Spin = Singlet
E(RB3LYP) = -623.57603089 a.u.
RMS Gradient Norm = 0.00003288 a.u.
Imaginary Freq =
Dipole Moment = 0.3046 Debye
Point Group = C1
Job cpu time:  0 days  0 hours 49 minutes 44.7 seconds.
         Item               Value     Threshold  Converged?
 Maximum Force            0.000083     0.000450     YES
 RMS     Force            0.000018     0.000300     YES
 Maximum Displacement     0.000772     0.001800     YES
 RMS     Displacement     0.000223     0.001200     YES
 Predicted change in Energy=-3.662381D-08
 Optimization completed.
    -- Stationary point found.

Optimisation: LanL2DZ with an Additional Basis Set
Log[14] file excerpts:
Filename = //icfs18.cc.ic.ac.uk/ew109/Desktop/Computational Chemistry/Module 2/Mo cis- and trans-/Trans/ew109_trans_MO_opt_LanL2DZ_EXTRA_log_56765.out

Trans-Mo optimisation lanl2mb
File Name = ew109_trans_MO_opt_LanL2DZ_EXTRA_log_56765
File Type = .log
Calculation Type = FOPT
Calculation Method = RB3LYP
Basis Set = Gen
Charge = 0
Spin = Singlet
E(RB3LYP) = -623.69415607 a.u.
RMS Gradient Norm = 0.00000491 a.u.
Imaginary Freq =
Dipole Moment = 0.2295 Debye
Point Group = C1
Job cpu time:  0 days  1 hours  0 minutes 11.3 seconds.
         Item               Value     Threshold  Converged?
 Maximum Force            0.000014     0.000450     YES
 RMS     Force            0.000004     0.000300     YES
 Maximum Displacement     0.000618     0.001800     YES
 RMS     Displacement     0.000180     0.001200     YES
 Predicted change in Energy=-7.115664D-09
 Optimization completed.
    -- Stationary point found.

Summary of Geometry Optimisation Calculations
The bond lengths obtained via the basis sets employed are displayed in the table below:
| Isomer | Bond Type | LANL2MB | LANL2DZ | LANL2DZ (extra basis set) | Literature Value[15][16] |
|---|---|---|---|---|---|
| cis-(Cl3P)2Mo(CO)4 | Mo-P | 2.53 | 2.51 | 2.48 | 2.58 |
| Mo-C | 2.11 | 2.06 | 2.05 | 2.01 | |
| P-Cl | 2.39 | 2.24 | 2.12 | - | |
| C=O | 1.19 | 1.18 | 1.18 | 1.15 | |
| trans-(Cl3P)2Mo(CO)4 | Mo-P | 2.48 | 2.44 | 2.42 | 2.37 |
| Mo-C | 2.11 | 2.06 | 2.06 | 1.87 | |
| P-Cl | 2.40 | 2.24 | 2.12 | - | |
| C=O | 1.19 | 1.17 | 1.17 | 1.15 |
As seen in the Table 3, the bond lengths obtained are generally in good agreement with the complexes found in the literature (for the cis-isomer, this phosphine ligand in the literature is PPh3, and for the trans-isomer, a Cr compound is used for comparison). It should be noted that use of the larger basis set with modifications made to allow for d-orbital involvement result in lower P-Cl bond distances. This shows that for the heavier elements, d-orbital overlap effects must be taken into consideration.
With regard to relative stability of these isomers, it can be seen that the trans-isomer (-623.694 Hartrees) has a lower energy minimum than the cis-isomer (-623.692 Hartrees) by about 0.002 Hartrees, or 5 kJ mol-1. That the trans-isomer is more stable is also reflected experimentally, as thermal isomerisation (an equilibrium process) leads to production of the more thermodynamically stable isomer[17]. It should be noted that this energy difference is not large (bond breaking processes typically involve energies of the order of 100 kJ mol-1). The fact that the cis-isomer can be isolated despite being higher in energy leads to the notion that a substantial barrier to interconversion of these isomers exists.
A typical method for the preparation of solely cis isomers is to tether both phosphines together, resulting in a bi-dentate ligand. One example is the BINAP ligand[18] which was developed by the 2001 Nobel laureate Ryoji Noyori and his co-workers. Another method of promoting the formation of cis-isomers is to incorporate groups which allow for attractive interactions between the phosphine ligands, such as hydrogen bonding interactions. These can be achieved by using ligands such as (H2NCH2)3P, which would involve H-bonds between the amine functionalities.
Predicted IR Spectra of Both Isomers
The IR spectra were computed using the optimised complexes (LANL2DZ; extra basis set) from the previous section. The lowest two frequencies of the complexes are shown to be positive, which proves that the optimisation and frequency calculations were successful.
| Vibrational Mode | Symmetry Label | Absorption Intensity | Bond Frequency (cm-1) | Literature Value* (cm-1)[17] | Percentage Error (%) | Diagram |
|---|---|---|---|---|---|---|
| Phosphine rotation (1) | - | 0 | 11 | - | - |  |
| Phosphine rotation (2) | - | 0 | 20 | - | - | 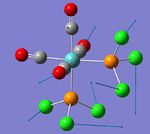 |
| Asymmetric C=O stretch (1); involving the trans-related CO ligands | B1 | 1595 | 1939 | 1869 | 4 |  |
| Asymmetric C=O stretch (2); involving the CO ligands trans- to the PCl3 groups | B2 | 823 | 1942 | 1896 | 2 | 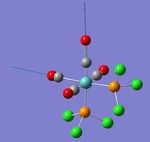 |
| Symmetric C=O stretch (1); 2 pairs of trans-carbonyls | A1 | 593 | 1953 | 1924 | 2 | 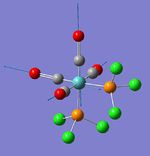 |
| Symmetric C=O stretch (2); all 4 carbonyls | A1 | 541 | 2020 | 2026 | 0 | 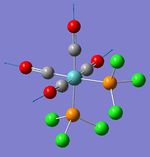 |
- Literature values obtained were obtained using PPh3 in the place of PCl3.
From Table 4 and Figure 12 it can be seen that there are 4 IR active vibrational modes with respect to the cis-complex. However, both B1 (1939 cm-1) and B2 (1942 cm-1) stretches are very close to each other, and in a typical IR spectrum, will appear as one peak. This, and the remaining two A1 absorptions a(t 1953 and 2020 cm-1) lead to the presence of three bands in Figure 12.

| Vibrational Mode | Symmetry Label | Absorption Intensity | Bond Frequency (cm-1) | Literature Value* (cm-1)[17] | Percentage Error (%) | Diagram |
|---|---|---|---|---|---|---|
| Phosphine rotation (1) | - | 0 | 5 | - | - | 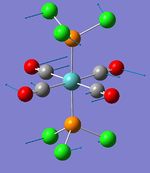 |
| Phosphine rotation (2) | - | 0 | 7 | - | - | 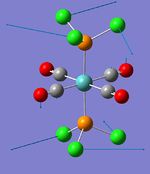 |
| Asymmetric C=O stretch (1); involving one pair of trans-related CO ligands | Eu | 1606 | 1939 | 1890 | 3 | 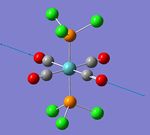 |
| Asymmetric C=O stretch (2); involving the second pair of trans-related CO ligands | Eu | 1606 | 1940 | 1890 | 3 |  |
| Symmetric C=O stretch (1); 2 pairs of trans-carbonyls (one pair out of phase w.r.t. the other) | B1g | 6 | 1967 | - | - | 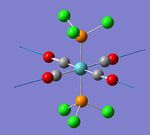 |
| Symmetric C=O stretch (2); all 4 carbonyls (fully symmetric) | A1g | 5 | 2026 | - | - | 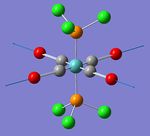 |
- Literature values obtained were obtained using PPh3 in the place of PCl3.
From Table 5 and Figure 13, it can be seen that the reason for a single C=O band in the IR spectrum of the trans-complex is that the B1g (1967 cm-1) and A1g (2026 cm-1) modes lead to no overall dipole moment, and thus are IR inactive, as seen in their relatively insignificant intensity with respect to the two Eu stretches (1939 cm-1).

Summary of Computed IR Data
The calculated data are in good agreement with the literature values, with less than 10% error. It is also shown that IR spectroscopy may be used to differentiate between these isomers, as there are more IR active carbonyl vibrational modes (and hence more carbonyl stretching bands) for the cis-isomer than the trans-isomer.
Mini Project: Linear and Cyclic S2N2
S2N2 is an eleven valence-electron molecule, best known in its aromatic four-membered ring form, with alternating S and N atoms. The S atoms in this molecule have large, diffuse orbitals, which help ease any steric constraints posed by ring formation. This section involves the use of the previously explored DFT/B3LYP method as well as an MP2 method to conduct MO, NBO and IR frequency analyses of the following isomeric forms of S2N2:
i) Linear S-N=N-S
ii) Aromatic S2N2 (4 S-N bonds)
iii) Non-Aromatic Cyclic S2N2 (SNNS type, with 2 S-N bonds, 1 S-S bond and 1 N=N bond; referred to as the 'non-aromatic isomer')
The MP2 (Møller-Plesset Perturbation, 2nd order) method[21] is a post Hartree-Fock ab initio technique which has been shown to accurately compute properties of conjugate systems by considering the effects of electron delocalisation. The B3LYP method will also be used to provide comparison. A 6-311+G(d) basis set was used in both cases, to accommodate d-electron involvement.
Some of the experiments conducted by Warren, Zhao and Gimarc in their report[22] (which forms the basis for this study) will be closely followed in an attempt to reproduce the results.
Linear SNNS Geometry Optimisation
For all optimisations, the log files were all checked for the following lines of text to ensure convergence:
         Item               Value     Threshold  Converged?
 Maximum Force            0.000216     0.000450     YES
 RMS     Force            0.000110     0.000300     YES
 Maximum Displacement     0.000417     0.001800     YES
 RMS     Displacement     0.000252     0.001200     YES
 Predicted change in Energy=-8.163405D-08
 Optimization completed.
    -- Stationary point found.
B3LYP
Log file for B3LYP optimisation[23]
Log file excerpt:
Filename = //icfs18.cc.ic.ac.uk/ew109/Desktop/Computational Chemistry/Module 2/S2N2/Linear/ew109_s2n2_linear_b3lyp_opt_log_57161.out

s2n2 open b3lyp opt
File Name = ew109_s2n2_linear_b3lyp_opt_log_57161
File Type = .log
Calculation Type = FOPT
Calculation Method = RB3LYP
Basis Set = 6-311+G(d)
Charge = 0
Spin = Singlet
E(RB3LYP) = -905.88817742 a.u.
RMS Gradient Norm = 0.00007447 a.u.
Imaginary Freq =
Dipole Moment = 0.0015 Debye
Point Group = C*V
Job cpu time:  0 days  0 hours  2 minutes 35.4 seconds.
MP2
Log file for MP2 optimisation[24]
Filename = //icfs18.cc.ic.ac.uk/ew109/Desktop/Computational Chemistry/Module 2/S2N2/Linear/MP2/ew109_s2n2_linear_MP2_FULLopt_log_57306.out

s2n2 open MP2 opt
File Name = ew109_s2n2_linear_MP2_FULLopt_log_57306
File Type = .log
Calculation Type = FOPT
Calculation Method = RMP2-Full
Basis Set = 6-311+G(d)
Charge = 0
Spin = Singlet
E(MP2) = -904.79001880 a.u.
RMS Gradient Norm = 0.00009302 a.u.
Imaginary Freq =
Dipole Moment = 0.0002 Debye
Point Group = C*V
Job cpu time:  0 days  0 hours  1 minutes  8.2 seconds.
Summary of Geometry Optimisations
Compared with the literature value[22] of -904.674 Eh for the linear isomer (which was obtained by using MP2/6-311++G(3df)), MP2 calculations yielded an optimisation energy of -904.790 Eh, which is in good agreement. The energy obtained via B3LYP was more a more negative value of -905.888 Eh. The difference of 1 Eh is equivalent to approximately 600 kcal mol-1, which is a substantial difference.
| Bond type | B3LYP | MP2 | Lit. Value[22] |
|---|---|---|---|
| S-N | 1.59 | 1.57 | 1.54 - 1.65 (partial double bond) |
| N-N | 1.14 | 1.19 | 1.167 (double bond) |
The calculated bond lengths for the linear isomer (see also the annotated Jmol files) show that for the MP2 minimisations, the S-N bonds are stronger, and the N-N bonds are weaker. This difference is not significant, but leads one to suspect that the MP2's higher sensitivity towards π-interactions are responsible for the weakening of the N-N bond (and strengthening of S-N), by donation of non-bonding p-orbital electrons from the S atom into the N-N π* anti-bonding orbital.
Aromatic S2N2 Geometry Optimisation
B3LYP
Log file for B3LYP optimisation[25]
Filename = //icfs18.cc.ic.ac.uk/ew109/Desktop/Computational Chemistry/Module 2/S2N2/Aromatic/ew109_s2n2_arom_opt_log_57151.out

S2N2 aromatic DFT b3lyp 6-311+g(d) opt
File Name = ew109_s2n2_arom_opt_log_57151
File Type = .log
Calculation Type = FOPT
Calculation Method = RB3LYP
Basis Set = 6-311+G(d)
Charge = 0
Spin = Singlet
E(RB3LYP) = -905.84853085 a.u.
RMS Gradient Norm = 0.00021682 a.u.
Imaginary Freq =
Dipole Moment = 0.0028 Debye
Point Group = CS
Job cpu time:  0 days  0 hours  2 minutes  5.1 seconds.
MP2
Log file for MP2 optimisation[26]
Filename = //icfs18.cc.ic.ac.uk/ew109/Desktop/Computational Chemistry/Module 2/S2N2/Aromatic/ew109_s2n2_arom_MP2_FULLopt_log_57284.out

S2N2 aromatic 6-311+g(d) MP2
File Name = ew109_s2n2_arom_MP2_FULLopt_log_57284
File Type = .log
Calculation Type = FOPT
Calculation Method = RMP2-Full
Basis Set = 6-311+G(d)
Charge = 0
Spin = Singlet
E(MP2) = -904.76993548 a.u.
RMS Gradient Norm = 0.00026077 a.u.
Imaginary Freq =
Dipole Moment = 0.0011 Debye
Point Group = CS
Job cpu time:  0 days  0 hours  0 minutes 38.4 seconds.
Summary of Geometry Optimisations
Again, by comparison with the literature value[22] of -904.675 Eh (MP2/6-311++G(3df)), the MP2 optimisation energy (-904.769 Eh) for the aromatic isomer gives better agreement than the B3LYP optimisation energy (-905.849 Eh).
| Bond type | B3LYP | MP2 | Lit. Value[27] |
|---|---|---|---|
| S-N | 1.67 | 1.68 | 1.65 - 1.66 (partial double bond) |
The calculated S-N bond lengths are in good agreement with the literature, as seen in Table 5. This shows that both B3LYP and MP2 are adept at modelling the geometry of the aromatic ring system.
Non-Aromatic Cyclic S2N2 Geometry Optimisation
B3LYP
Log file for B3LYP optimisation[28]
Filename = //icfs18.cc.ic.ac.uk/ew109/Desktop/Computational Chemistry/Module 2/S2N2/Alternate ring/ew109_s2n2_altring_b3lyp_opt_log_57158.out

s2n2 alt ring b3lyp opt
File Name = ew109_s2n2_altring_b3lyp_opt_log_57158
File Type = .log
Calculation Type = FOPT
Calculation Method = RB3LYP
Basis Set = 6-311+G(d)
Charge = 0
Spin = Singlet
E(RB3LYP) = -905.86070915 a.u.
RMS Gradient Norm = 0.02553314 a.u.
Imaginary Freq =
Dipole Moment = 2.4964 Debye
Point Group = CS
Job cpu time:  0 days  0 hours  2 minutes 16.3 seconds.
MP2
Log file for MP2 optimisation[29]
Filename = //icfs18.cc.ic.ac.uk/ew109/Desktop/Computational Chemistry/Module 2/S2N2/Alternate ring/ew109_s2n2_altring_MP2_FULLopt_log_57285.out

s2n2 alt ring MP2 opt
File Name = ew109_s2n2_altring_MP2_FULLopt_log_57285
File Type = .log
Calculation Type = FOPT
Calculation Method = RMP2-Full
Basis Set = 6-311+G(d)
Charge = 0
Spin = Singlet
E(MP2) = -904.76181750 a.u.
RMS Gradient Norm = 0.00019719 a.u.
Imaginary Freq =
Dipole Moment = 2.5610 Debye
Point Group = CS
Job cpu time:  0 days  0 hours  1 minutes 15.5 seconds.
Summary of Geometry Optimisations
The results show that the MP2 optimisation energy (-904.762 Eh) for the non-aromatic isomer is closer to the literature value[22] of -904.656 Eh (MP2/6-311++G(3df)) than the B3LYP optimisation energy (-905.861 Eh).
| Bond type | B3LYP | MP2 | Lit. Value[22] |
|---|---|---|---|
| S-N | 1.76 | 1.72 | 1.705 - 1.719 (single bond) |
| N-N | 1.25 | 1.29 | 1.167 (double bond) |
| S-S | 2.16 | 2.12 | 2.02 - 2.179 (single bond) |
Again, with reference to Table 6 and the annotated Jmol files, the same discrepancy in bond lengths can be observed for the B3LYP and MP2 methods, with MP2 displaying a weakening of the N-N bond and a strengthening of S-S and S-N bonds. This effect will be investigated further in depth in the later sections, via MO and NBO analysis.
MO and NBO Analyses of the Isomers
The previous section highlighted the effect of using different computational methods on bond length and optimisation energy of the compounds studied. To further explore the difference between these methods, orbital analysis will be employed. A selection of the bonding MOs generated by B3LYP and MP2 methods (particularly those relevant to π-interactions) will be compared, and the differences between them evaluated. These MOs (Tables 7, 8 and 9), as well as the log file excerpts for each method pertaining to NBOs, are listed below:
Linear S2N2
| B3LYP[30] | MP2[31] | ||
|---|---|---|---|
| Molecular Orbitals (with relevant Hartree energy in parentheses) |
Orbital Depiction | Molecular Orbitals (with relevant Hartree energy in parentheses) |
Orbital Depiction |
| HOMO-2 (-0.344) |  |
HOMO-2 (-0.472) |  |
| HOMO-3 (-0.344) |  |
HOMO-3 (-0.472) |  |
| HOMO-5 (-0.546) |  |
HOMO-5 (-0.725) |  |
| HOMO-6 (-0.546) |  |
HOMO-6 (-0.725) |  |
With respect to the z-axis (which is aligned with the bonds in this molecule), it can be seen that the p-orbitals in the x- and y- directions are aligned, leading to bonding interactions similar to that of butadiene, in each respective plane:
i) The HOMO-6 and HOMO-5 for both methods are degenerate, and represent the completely in phase overlap of the S and N p-orbitals in the linear isomer.
ii) Another pair of degenerate orbitals are the HOMO-3 and HOMO-2; these possess one node, have less bonding character than the previously discussed pair of orbitals.
These bonding orbital interactions are responsible for the partial double bond character of the S-N bond (as shown by the optimised geometries earlier).
NBO excerpt from B3LYP log file[30]
 Second Order Perturbation Theory Analysis of Fock Matrix in NBO Basis

     Threshold for printing:   0.50 kcal/mol
                                                                              E(2)  E(j)-E(i) F(i,j)
         Donor NBO (i)                     Acceptor NBO (j)                 kcal/mol   a.u.    a.u.
 ===================================================================================================

 within unit  1
   1. BD (   1) N   1 - N   2        / 60. RY*(   3) S   3                    1.04    1.77    0.038
   1. BD (   1) N   1 - N   2        / 81. RY*(   3) S   4                    1.04    1.77    0.038
   1. BD (   1) N   1 - N   2        /103. BD*(   1) N   1 - S   4            1.09    1.45    0.036

...

  19. LP (   2) S   3                /101. BD*(   2) N   1 - N   2           59.91    0.15    0.092
  20. LP (   3) S   3                / 42. RY*(   2) N   2                    0.82    1.21    0.031
  20. LP (   3) S   3                / 46. RY*(   6) N   2                    1.01    2.11    0.045
  20. LP (   3) S   3                / 59. RY*(   2) S   3                    1.31    0.87    0.033
  20. LP (   3) S   3                /102. BD*(   3) N   1 - N   2           59.91    0.15    0.092

...

  22. LP (   2) S   4                /101. BD*(   2) N   1 - N   2           59.86    0.15    0.092
  23. LP (   3) S   4                / 25. RY*(   2) N   1                    0.81    1.21    0.031
  23. LP (   3) S   4                / 29. RY*(   6) N   1                    1.01    2.11    0.045
  23. LP (   3) S   4                / 80. RY*(   2) S   4                    1.30    0.87    0.033
  23. LP (   3) S   4                /102. BD*(   3) N   1 - N   2           59.86    0.15    0.092
 101. BD*(   2) N   1 - N   2        / 24. RY*(   1) N   1                    9.70    1.06    0.158
 101. BD*(   2) N   1 - N   2        / 28. RY*(   5) N   1                    0.83    1.96    0.063

...
NBO excerpt from MP2 log file[31]
 Second Order Perturbation Theory Analysis of Fock Matrix in NBO Basis

     Threshold for printing:   0.50 kcal/mol
                                                                              E(2)  E(j)-E(i) F(i,j)
         Donor NBO (i)                     Acceptor NBO (j)                 kcal/mol   a.u.    a.u.
 ===================================================================================================

 within unit  1
   1. BD (   1) N   1 - N   2        / 60. RY*(   3) S   3                    1.44    2.19    0.050
   1. BD (   1) N   1 - N   2        / 81. RY*(   3) S   4                    1.44    2.19    0.050
   1. BD (   1) N   1 - N   2        /103. BD*(   1) N   1 - S   4            1.46    1.99    0.048

...

  18. LP (   1) S   3                / 43. RY*(   3) N   2                    1.78    2.07    0.054
  18. LP (   1) S   3                /100. BD*(   1) N   1 - N   2           20.28    1.83    0.173
  19. LP (   2) S   3                / 41. RY*(   1) N   2                    1.39    1.61    0.046
  19. LP (   2) S   3                / 44. RY*(   4) N   2                    1.71    2.35    0.061
  19. LP (   2) S   3                / 58. RY*(   1) S   3                    1.47    1.12    0.039
  19. LP (   2) S   3                /101. BD*(   2) N   1 - N   2          100.61    0.31    0.169
  20. LP (   3) S   3                / 42. RY*(   2) N   2                    1.39    1.61    0.046
  20. LP (   3) S   3                / 45. RY*(   5) N   2                    1.71    2.35    0.061
  20. LP (   3) S   3                / 59. RY*(   2) S   3                    1.47    1.12    0.039
  20. LP (   3) S   3                /102. BD*(   3) N   1 - N   2          100.61    0.31    0.169
  21. LP (   1) S   4                / 26. RY*(   3) N   1                    1.78    2.07    0.054
  21. LP (   1) S   4                /100. BD*(   1) N   1 - N   2           20.28    1.83    0.173
  22. LP (   2) S   4                / 24. RY*(   1) N   1                    1.39    1.61    0.046
  22. LP (   2) S   4                / 27. RY*(   4) N   1                    1.71    2.35    0.061
  22. LP (   2) S   4                / 79. RY*(   1) S   4                    1.47    1.12    0.039
  22. LP (   2) S   4                /101. BD*(   2) N   1 - N   2          100.60    0.31    0.169
  23. LP (   3) S   4                / 25. RY*(   2) N   1                    1.39    1.61    0.046
  23. LP (   3) S   4                / 28. RY*(   5) N   1                    1.71    2.35    0.061
  23. LP (   3) S   4                / 80. RY*(   2) S   4                    1.47    1.12    0.039
  23. LP (   3) S   4                /102. BD*(   3) N   1 - N   2          100.60    0.31    0.169
 101. BD*(   2) N   1 - N   2        / 24. RY*(   1) N   1                   12.31    1.30    0.211
 101. BD*(   2) N   1 - N   2        / 27. RY*(   4) N   1                    0.65    2.04    0.061

...
NBO analysis of this linear isomer shows that S lone pair donation into the N-N π* anti-bonding orbital is responsible for the additional stabilisation of the S-N bond, giving it a partial double bond character.
Aromatic S2N2
| B3LYP[32] | MP2[33] | ||
|---|---|---|---|
| Molecular Orbitals (with relevant Hartree energy in parentheses) |
Orbital Depiction | Molecular Orbitals (with relevant Hartree energy in parentheses) |
Orbital Depiction |
| HOMO (-0.293) |  |
HOMO (-0.394) |  |
| HOMO-1 (-0.303) |  |
HOMO-1 (-0.397) |  |
| HOMO-5 (-0.469) |  |
HOMO-4 (-0.621) |  |
The orbitals for the aromatic isomer are similar to those for a standard aromatic compound:
i) Lowest π-bonding orbital with complete in-phase p-orbital overlap, c.f. HOMO-5 (B3LYP) and HOMO-4(MP2) ii) The next two π-bonding orbitals possess one nodal plane, c.f. HOMO-1 and HOMO (both methods)
An interesting result from this is the location of the nodal plane in the HOMO-1 and HOMO, which is either aligned with the two S atoms (HOMO), or the two N atoms (HOMO-1). This results in the degeneracy between these orbitals being broken, and the NBO log file confirms this.
NBO excerpt from B3LYP log file[32]
 Second Order Perturbation Theory Analysis of Fock Matrix in NBO Basis

     Threshold for printing:   0.50 kcal/mol
                                                                              E(2)  E(j)-E(i) F(i,j)
         Donor NBO (i)                     Acceptor NBO (j)                 kcal/mol   a.u.    a.u.
 ===================================================================================================

 within unit  1
   1. BD (   1) S   1 - N   2        / 79. RY*(   1) S   4                    2.12    1.51    0.051
   1. BD (   1) S   1 - N   2        /101. BD*(   1) S   1 - N   3            1.74    0.89    0.035
   1. BD (   1) S   1 - N   2        /104. BD*(   1) N   3 - S   4            0.96    0.89    0.026

...

  19. LP (   2) S   1                /102. BD (   1) N   2 - N   3          468.26    0.04    0.134

...

  23. LP (   2) S   4                /102. BD (   1) N   2 - N   3          471.53    0.04    0.135
 102. BD (   1) N   2 - N   3        / 26. RY*(   3) S   1                    4.67    0.79    0.079
 102. BD (   1) N   2 - N   3        / 81. RY*(   3) S   4                    4.69    0.79    0.079
NBO excerpt from MP2 log file[33]
  Second Order Perturbation Theory Analysis of Fock Matrix in NBO Basis

     Threshold for printing:   0.50 kcal/mol
                                                                              E(2)  E(j)-E(i) F(i,j)
         Donor NBO (i)                     Acceptor NBO (j)                 kcal/mol   a.u.    a.u.
 ===================================================================================================

 within unit  1
   1. BD (   1) S   1 - N   2        / 80. RY*(   2) S   4                    1.84    1.84    0.052
   1. BD (   1) S   1 - N   2        /101. BD*(   1) S   1 - N   3            3.23    1.30    0.058
   1. BD (   1) S   1 - N   2        /104. BD*(   1) N   3 - S   4            1.59    1.30    0.041

...

  19. LP (   2) S   1                /102. BD (   1) N   2 - N   3          615.62    0.08    0.229

...

  23. LP (   2) S   4                /102. BD (   1) N   2 - N   3          617.27    0.08    0.229
 102. BD (   1) N   2 - N   3        / 26. RY*(   3) S   1                    5.23    0.89    0.088
 102. BD (   1) N   2 - N   3        / 81. RY*(   3) S   4                    5.23    0.89    0.088
The NBO log file a strong stabilising interaction from the donation of the S lone pair electrons into an N-N π* anti-bonding orbital, in addition to the already observed conjugation within the ring. This results in the extra stabilisation displayed by the HOMO-1, explains the loss of degeneracy between the HOMO & HOMO-1.
Non-Aromatic S2N2
| B3LYP[34] | MP2[35] | ||
|---|---|---|---|
| Molecular Orbitals (with relevant Hartree energy in parentheses) |
Orbital Depiction | Molecular Orbitals (with relevant Hartree energy in parentheses) |
Orbital Depiction |
| HOMO-1 (-0.293) |  |
HOMO (-0.402) |  |
| HOMO-2 (-0.313) |  |
HOMO-1 (-0.417) |  |
| HOMO-5 (-0.470) |  |
HOMO-4 (-0.619) |  |
The MOs produced in this case, particularly those possessing a nodal plane possess a more striking lack of degeneracy (the difference between HOMO and HOMO-1 in MP2 calculations here is 0.015 Eh, whereas in the aromatic case the difference is 0.003 Eh). The orbitals are also non-symmetric with regards to the nodal plane, and this thus confirms the non-aromaticity of the molecule.
NBO excerpt from B3LYP log file[34]
 Second Order Perturbation Theory Analysis of Fock Matrix in NBO Basis

     Threshold for printing:   0.50 kcal/mol
                                                                              E(2)  E(j)-E(i) F(i,j)
         Donor NBO (i)                     Acceptor NBO (j)                 kcal/mol   a.u.    a.u.
 ===================================================================================================

 within unit  1
   2. BD (   2) N   1 - N   2        / 59. RY*(   2) S   3                    1.29    1.14    0.034
   2. BD (   2) N   1 - N   2        / 60. RY*(   3) S   3                    0.52    1.04    0.021
   2. BD (   2) N   1 - N   2        / 80. RY*(   2) S   4                    1.29    1.14    0.034

...

  21. LP (   2) S   3                /101. BD*(   2) N   1 - N   2           18.57    0.22    0.060
  22. LP (   1) S   4                /102. BD*(   1) N   1 - S   3            0.75    0.81    0.022
  23. LP (   2) S   4                / 45. RY*(   5) N   2                    0.58    1.53    0.028
  23. LP (   2) S   4                / 60. RY*(   3) S   3                    1.66    0.91    0.036
  23. LP (   2) S   4                /101. BD*(   2) N   1 - N   2           18.55    0.22    0.060
 101. BD*(   2) N   1 - N   2        / 26. RY*(   3) N   1                    2.36    1.16    0.116
 101. BD*(   2) N   1 - N   2        / 43. RY*(   3) N   2                    2.36    1.16    0.116
NBO excerpt from MP2 log file[35]
 Second Order Perturbation Theory Analysis of Fock Matrix in NBO Basis

     Threshold for printing:   0.50 kcal/mol
                                                                              E(2)  E(j)-E(i) F(i,j)
         Donor NBO (i)                     Acceptor NBO (j)                 kcal/mol   a.u.    a.u.
 ===================================================================================================

 within unit  1
   1. BD (   1) N   1 - N   2        / 58. RY*(   1) S   3                    0.53    2.01    0.029

...

  21. LP (   2) S   3                / 81. RY*(   3) S   4                    2.36    1.25    0.050
  21. LP (   2) S   3                /101. BD*(   2) N   1 - N   2           32.64    0.48    0.115
  22. LP (   1) S   4                /102. BD*(   1) N   1 - S   3            0.87    1.22    0.029
  23. LP (   2) S   4                / 45. RY*(   5) N   2                    0.93    1.90    0.039
  23. LP (   2) S   4                / 60. RY*(   3) S   3                    2.36    1.25    0.050
  23. LP (   2) S   4                /101. BD*(   2) N   1 - N   2           32.65    0.48    0.115

...
NBO analysis also shows that this molecule is non-aromatic. This can be deduced from the lack of resonance stabilisation energy from the S lone pair to N-N п* orbital donation (33 kcal mol-1, as compared to 615kcal mol-1 for the aromatic isomer).
Summary of MO and NBO Analyses
A consistent trend becomes clear upon comparison of the energy values of these π-bonding MOs - the MO energy calculated using the MP2 method yields higher bonding energies in total with regards to п-electron resonance. In the context of the aromatic isomer (Table 8), the total calculated MP2 resonance energy is 2{(-0.394) + (-0.397) + (-0.621)} = -2.82 Eh (2 electrons in each orbital; stabilisation defined by negative energies), while the B3LYP resonance energy is 2{(-0.293) + (-0.303) + (-0.469)} = -2.13 Eh.
The extra stability of 0.69 Eh (or 432 kcal mol-1) is significant, and shows that the B3LYP method, which is semi-empirical[1], is limited when compared to the ab initio MP2 method, expecially in describing conjugated and delocalised electron systems.
NBO analysis is carried out by using the portion of the log file titled "Second Order Perturbation Theory Analysis of Fock Matrix in NBO Basis". This complements the MO analysis by giving a description of stabilisation energies from the donation of electrons in non-bonding orbitals into unoccupied (anti-bonding) orbitals. These also demonstrate that MP2 calculations produce higher resonance stabilisation, relative to the B3LYP method. With reference to the aromatic isomer's NBO stabilisation energy (ca. 615 kcal mol-1 for each S p-orbital lone pair to N-N anti-bonding orbital donation) from the MP2 calculations (see Mod:WongTimeNoSee#NBO_excerpt_from_MP2_log_file.5B33.5D; click the "back" button to return to this paragraph), the same S lone pair to N-N antibonding orbital donation is less pronounced for the linear isomer (ca. 100 kcal mol-1; Mod:WongTimeNoSee#NBO_excerpt_from_MP2_log_file.5B31.5D), with the least stabilisation of the S-N bond via this effect coming from the non-aromatic ring form (ca. 32 kcal mol-1; Mod:WongTimeNoSee#NBO_excerpt_from_MP2_log_file.5B35.5D).
The S-N bond orders, as can be deduced from these results, are arranged in terms of strength as follows for each of the isomers:
S-N (non-aromatic ring) < S-N (linear) < S-N (aromatic)
Additionally, the extent of S p-orbital lone pair donation into the N-N π* anti-bonding orbital can be used to determine how much the N-N bond has been weakened, and this is related to the IR analysis, which will be discussed next.
IR Analysis
Non-Aromatic Isomer
In their report[22], Warren, Zhao and Gimarc deduced that the new S2N2 species (Ar matrix IR stretch at 1167.5 cm-1, reported previously[36] by Hassanzadeh and Andrews) was that of the non-aromatic isomer, which was discussed earlier alongside the aromatic and linear forms. IR frequency calculations will be carried out on this isomer in an attempt to reproduce their findings.
| Symmetry Label |
B3LYP[37] | % error for B3LYP |
MP2[38] | % error for MP2 |
Lit. |
|---|---|---|---|---|---|
| a2 | 415 (15) | 17 | 448 (0) | 10 | 499 (0) |
| b2 | 460 (5) | 1 | 467 (8) | 7 | 500 (0.4) |
| a1 | 475 (0) | 8 | 470 (6) | 9 | 516 (9.9) |
| a1 | 629 (29) | 18 | 706 (37) | 8 | 771 (18.7) |
| b2 | 824 (22) | 4 | 827 (18) | 4 | 859 (34.8) |
| a1 | 1460 (87) | 31 | 1231 (71) | 10 | 1116 (39.6) |
- Literature values were obtained using MP4/6-311++G(3df) method and basis set.
Table 10 shows that IR frequencies obtained via the B3LYP method give far higher error percentages with respect to the literature value. This is unsurprising, due to B3LYP not fully accounting for electron delocalisation (which leads to weakening of some bonds and strengthening of others). MP2 calculated frequencies were within 10% error, as shown above.
The NBO analysis from the previous section can be applied here as well. Given that the VSEPR structure of the linear form involves an NΞN (triple) bond, and that the VSEPR structure of the non-aromatic form involves an N=N double bond, one is led to suspect that it is the non-aromatic form is responsible for the experimental literature value of 1167.5 cm-1, an N-N stretching motion. However, a typical N=N bond has a stretching frequency of about 1500 cm-1[39]. It can be concluded that the S lone-pair to N-N π* anti-bonding orbital donation is responsible for the weakening of the N=N bond within this newly discovered isomer, which then displays a lower stretching frequency.
Linear Isomer
The same approach was applied to the linear isomer in order to determine the IR frequencies. However, this produced two degenerate negative low frequencies of -448 cm-1 with the MP2 method[40], which shows that MP2 was not able to produce a fully converged optimised geometry for this isomer, even under 'tight' convergence settings. The B3LYP method[41], on the other hand, produced only one IR active frequency: an asymmetric S-N stretch of 926 cm-1. To summarise, there is insufficient evidence for this isomer being the one present in the experimental literature.
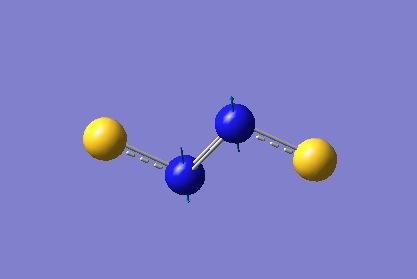
Figure 14 depicts a bending motion at -448 cm-1 (the other degenerate bending motion is identical, but in a direction orthogonal to the one displayed). The maximum deformation of this vibrational mode resembles a possible transition state leading to formation of the aromatic isomer. With this it can be said that the MP2 method does not recognise the linear isomer as a completely optimised S2N2 species (defined by a global minimum along the potential energy surface). One possible interpretation of this negative frequency is that the linear isomer is a short lived intermediate which then spontaneously goes on to form the more stable aromatic isomer.
Further Discussion
MP2 has been shown, as an ab initio method, apt at describing the electron delocalisation of conjugated systems. However, the stark differences in п-overlap energies as seen and discussed imply that there must be a noticeable difference in bond lengths as calculated by both methods. This is, however unfortunately, not the case, as the biggest corresponding difference in bond lengths between both methods is only 0.05Å. Thus, it follows that MP2 as its own shortcomings, in the form of reduced accuracy when describing optimised bond lengths.
Conclusions
DFT/B3LYP was shown to be a sufficient method for the calculation of physical and structural properties in compounds involving mostly localised 2c-2e bonds. However, in terms of describing the electronic structure of conjugated systems, the semi-empirical parameters involved here result in inaccurate evaluation of the bonding contributions of delocalised electrons. The MP2 method was used instead, which provided useful for analysis of orbital effects, but less than adequate in relating these more accurately calculated energies in terms of shorter bond lengths, when compared to the B3LYP geometries.
References
- ↑ 1.0 1.1 A. D. Becke, J. Chem. Phys., 1993, 98, 1372 DOI:10.1063/1.464304
- ↑ https://wiki.ch.ic.ac.uk/wiki/images/3/39/EW109_BH3_OPTIMISE.LOG
- ↑ https://wiki.ch.ic.ac.uk/wiki/images/1/1d/EW109_BH3_FREQUENCY.LOG
- ↑ K. Kawaguchi, J. E. Butler, C. Yamada, S. H. Bauer, T. Minowa, H. Kanamori, E. Hirota, J. Chem. Phys., 1987, 87, 2438. DOI:10.1063/1.453135
- ↑ 5.0 5.1 http://hdl.handle.net/10042/to-12952
- ↑ https://wiki.ch.ic.ac.uk/wiki/images/3/30/Ew109_TLBR3_OPT.LOG
- ↑ 7.0 7.1 J. Blixt, J. Glaser, J. Mink, I. Persson, P. Persson, M. Sandstrom., J. Am. Chem. Soc., 1995, 117, 5089 - 5104 DOI:10.1021/ja00123a011
- ↑ https://wiki.ch.ic.ac.uk/wiki/images/d/da/EW109_TLBR3_FREQ.LOG
- ↑
http://hdl.handle.net/10042/to-12956 - ↑
http://hdl.handle.net/10042/to-12957 - ↑
http://hdl.handle.net/10042/to-12958 - ↑
http://hdl.handle.net/10042/to-12959 - ↑
http://hdl.handle.net/10042/to-12960 - ↑
http://hdl.handle.net/10042/to-12961 - ↑ F. A. Cotton, D. J. Darensbourg, S. Klein, B. W. S. Kolthammer, Inorg. Chem., 1982, 21, 294–299DOI:10.1021/ic00131a055
- ↑ D. W. Bennett, T. A. Siddiquee, D. T. Haworth, S. E. Kabir, F. K. Camellia, J. Chem. Crys., 2004, 34, 353-359DOI:10.1023/B:JOCC.0000028667.12964.28
- ↑ 17.0 17.1 17.2 M. Ardon, P. D. Hayes, G. Hogarth, J. Chem. Educ., 2002, 79, 1249 - 1251. DOI:10.1021/ed079p1249
- ↑ M. Kitamura, M. Tokunaga, T. Ohkuma, R. Noyori, Organic Syntheses, Coll., 1988, 9, 589
- ↑
http://hdl.handle.net/10042/to-12970 - ↑
http://hdl.handle.net/10042/to-12971 - ↑ C. Møller, M. S. Plesset, Chem. Phys. Lett., 1934, 46, 618-622 DOI:10.1103/PhysRev.46.618
- ↑ 22.0 22.1 22.2 22.3 22.4 22.5 22.6 D. S. Warren, M. Zhao, B. M. Gimarc, J. Am. Chem. Soc., 1995, 117, 10345 - 10352DOI:10.1021/ja00146a019 Cite error: Invalid
<ref>tag; name "S2N2" defined multiple times with different content - ↑ http://hdl.handle.net/10042/to-12994
- ↑ http://hdl.handle.net/10042/to-13010
- ↑ http://hdl.handle.net/10042/to-12995
- ↑ http://hdl.handle.net/10042/to-13008
- ↑ P.D. Lickiss, 2nd Year Main Group Chemistry, Imperial College London, 2010
- ↑ http://hdl.handle.net/10042/to-12996
- ↑ http://hdl.handle.net/10042/to-13009
- ↑ 30.0 30.1 http://hdl.handle.net/10042/to-13113
- ↑ 31.0 31.1 http://hdl.handle.net/10042/to-13111
- ↑ 32.0 32.1 http://hdl.handle.net/10042/to-13114
- ↑ 33.0 33.1 http://hdl.handle.net/10042/to-13115
- ↑ 34.0 34.1 http://hdl.handle.net/10042/to-13116
- ↑ 35.0 35.1 http://hdl.handle.net/10042/to-13117
- ↑ P. Hassanzadeh, L. Andrews, J. Am. Chem. Soc., 1992, 114, 83–91DOI:10.1021/ja00027a012
- ↑ http://hdl.handle.net/10042/to-13126
- ↑ http://hdl.handle.net/10042/to-13127
- ↑ F. Zimmermann, T. Lippert, C. Beyer, J. Stebani, O. Nuyken, and A. Wokaun, Applied Spectroscopy, 1993, 47, 986 - 993
- ↑ http://hdl.handle.net/10042/to-13188
- ↑ http://hdl.handle.net/10042/to-13198
