
Rep:Mod:WDLBJ
Day 1
Optimisation of BH3 Using 3-21G Basis Set
BH3 was initially optimised using a simple basis set and the optimised geometry can be viewed here. The bond lengths are:
| Bond length | Bond angle |
|---|---|
| 1.19445 | 120.016 |
| 1.19467 | 119.986 |
| 1.19480 | 120.016 |
It is expected that the bond angles and lengths will be identical; however this is not the case. A simple basis set has been used and the full energy minimum has not been achieved, the molecule is residing in local low energy minimum along where the gradient of the force is zero but not necessarily at the lowest energy. These distortions are exaggerated by using a small basis set.
Summary Table:

Item Table Showing Converged Forces:

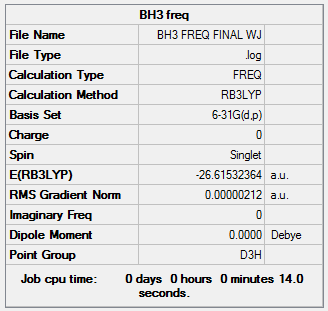
Second Optimisation of BH3 Using 6-31G(d,p) Basis Set
The BH3 geometry was optimised using a higher level basis set and the results can be viewed here: here.
The BH3 Output Summary is given below:

The BH3 item table is given below:

| Bond length | Bond angle |
|---|---|
| 1.18 | 120.0 |
The energy for the 3-21G basis set is -26.46226433 au, whereas for the 6-31G(d,p) basis set is -26.61511227. Using a more precise basis set for the calculation gives a lower minimum energy.
Day 2
Optimisation of GaBr3 Using LanL2DZ Basis Set
Gallium (III) Bromide was optimised using a LanL2DZ basis set and the results can be viewed here: DOI:10042/26085

Item Value Threshold Converged?
Maximum Force 0.000000 0.000450 YES
RMS Force 0.000000 0.000300 YES
Maximum Displacement 0.000003 0.001800 YES
RMS Displacement 0.000002 0.001200 YES
| Bond length/ Angstroms | Bond angle/ degrees |
|---|---|
| 2.35018 | 120.00 |
Theses bond differences can be compared with the literature values: c.f. lit. 2.239 Angstroms +- 0.007.[1]. The computational value is slightly lower than the literature, however still in the same ballpark. It is important to compare the value with an experimentally determined bond length opposed to one generated computationally as we are trying to model what will be observed in nature.
BBr3 Optimisation

Item Value Threshold Converged?
Maximum Force 0.000008 0.000450 YES
RMS Force 0.000005 0.000300 YES
Maximum Displacement 0.000036 0.001800 YES
RMS Displacement 0.000023 0.001200 YES
| Bond Distance/ Angstroms | Bond Angle/ degrees |
|---|---|
| 1.93396 | 120 |
Comparison of Bond Lengths
| Bond length GaBr3/ Angstroms | Bond length BBr3/ Angstroms | Bond length BH3/ Angstroms |
|---|---|---|
| 2.350 | 1.93396 | 1.194 |
| c.f. lit. 2.239 [2] | c.f. lit. 1.87 [3] | c.f. lit. 1.19 [4] |
Gaussian is assuming that all structures are monomeric however this is not the case in nature. Whereas BH3 exists as a dimer, BBr3 as a monomer with Lewis acidic character and GaBr3 as a mixture [5]. It is thus ideal to be able to model these structures computationally in the same trigonal four atom motif to generate comparisons.
GaBr3 has the longest bond, these are the largest combination of atoms, the bonding MO is most diffuse as it is made up of high energy orbitals that are distant from the nucleus, stabilisation is lower so this bond distance is the largest. This trend is observed for BBr3 as this is the second largest molecule and the smallest bond belongs to BH3. The constituent atomic orbitals on BH3 are low in energy and close to the nucleus (from the radial distribution function).
The electronegativity difference for BH3 is the lowest for all three molecules and thus the electron density is closer to the centre of the interatomic region. This allows stabilisation by both nuclei and thus a shorter bond.
The trend follows that of the Van Der Waals radii of the atoms, and they reside in the minimum of the Lennard-Jones potential. This is the most attractive region for 2 bonded atoms at there equilibrium bond length. This follows the order as shown in the table: Sum of Van Der Waals radii greater for GaBr3> BBr3> BH3.
For example GaBr3 and BBr3 have the same ligand but the radius of Ga is larger than B so a larger bond distance is observed. This is also the same when changing the ligand as for BBr3 and BH3.
It is not appropriate to explain the results from a Lewis acidic perspective invoking hyperconjugation in Valence Bond Theory as this piece of coursework is describing MOs and not individual empty p-orbitals on the central atom. They would have been engulfed in an MO somewhere, not existing alone.
Questions:
In some structures Gaussview does not draw bonds where we expect, does this mean there is no bond? Why?
Gaussian does not always include bonds that are represented in Lewis structures. The quantum mechanical approach used by the program calculates the molecular orbitals, of which are bonding non-bonding and anti-bonding. It is not appropriate to pinpoint which two electrons are involved in a covalent bond c.f. organic chemistry reaction mechanisms. Gaussian defines a bond by distance and includes them for operator convenience. If the distance is longer than that specified then a bond may not appear in the structure in Gaussview.
What is a bond?
A Chemical bond is an attraction between atoms that influences the structure of the compound. Heisenberg's wave-particle duality theorem means that the electron density will occupy a much greater volume than the much heavier nuclei. This phonomenon means that there is space occupied by electrons between atoms. For example the most attractive distance between two atoms is the sum of Van der Waals radii of these atoms. This is represented by a minimum in the Lennard-Jones potential.
From this potential it is evident that when the distance is shorter than the sum of the Van der Waals radii, the energy rises sharply to infinity when distance is zero. This represents the electron repulsion. In the same way, when the distance the rises the energy increase this time to a plateau, this represents two atoms that are not bonded.
The vibrational modes from the harmonic oscillator represent the energy that the bond can contain without dissociating. This energy is associated with a distance at the top of the potential well.
Day 3
Frequency Analysis BH3
The frequency calculation for BH3 can be viewed here

Low frequencies --- -0.9432 -0.8611 -0.0055 5.7455 11.7246 11.7625
Low frequencies --- 1162.9963 1213.1826 1213.1853
| number | form of vibration | Description | frequency | intensity | symmetry D2h point group |
|---|---|---|---|---|---|
| 1 |  |
Concerted bending of all B-H bonds. The B atom moves in the opposite direction to the H atoms. | 1163.00 | 92.5482 | A2" |
| 2 |  |
Bending of two B-H bonds whilst 1 B-H bond remains rigid. This motion is all in the same plane, the motion of the 2 B-H bends is concerted | 1213.18 | 14.0551 | E' |
| 3 |  |
2 B-H vectors are the same whereas the other in larger, All three H atoms are bending in the molecular plane and a smallest B-H vectors is in the opposite direction to the larger B-H vector | 1213.19 | 14.0587 | E' |
| 4 |  |
Stretching of all B-H bonds. Concerted stretching of all B-H atoms with equal vector sizes. The B is effectively stationary | 2582.28 | 0.0000 | A1' |
| 5 |  |
Stretching of 2 B-H bonds, a bending is observed for the other B-H bond. Whilst one bond contracts the other relaxes, the bending is synchronised with the contracting B-H bond | 2715.45 | 126.3302 | E' |
| 6 |  |
2715.45 | 126.3206 | stretching motion concerted for 2 B-H bonds and and out of time with the other B-H bond | E' |

Why are there Less than six peaks in the spectrum?
For a molecular vibration to be observable in the IR spectrum, there must be a change in the dipole moment of the molecule, this is not the case for number 4 as the vectors cancel out. It is therefore not observed in the spectrum. Similarly the numbers 5 & 6 and 2 & 3 are degenerate shown by the same symmetry label. The Jahn Teller effect is barely noticeable, in this way these absorptions with the same symmetry label are viewed as 1 peak in the IR spectrum. Only three peaks are observed.
Frequency Analysis GaBr3
The frequency calculation was carried out in Gaussian as the HPC was not used. The results can be viewed here

Low frequencies --- -0.5252 -0.5247 -0.0024 -0.0010 0.0235 1.2010
Low frequencies --- 76.3744 76.3753 99.6982
| number | form of vibration | frequency | description | intensity | symmetry D2h point group |
|---|---|---|---|---|---|
| 1 |  |
Bending of a B-H bond in tandem with a rigid BH2 unit in concerted motion | 76.37 | 3.3447 | E' |
| 2 |  |
Bending of 2 B-H bonds in tandem with the other rigid B-H bond - concerted motion | 76.38 | 3.3447 | E' |
| 3 |  |
concerted stretching of 2 B-H bonds and bending of the other | 99.70 | 9.2161 | A2" |
| 4 |  |
stretching of all 3 B-H bonds in concerted in and out movement | 197.34 | 0.0000 | A1' |
| 5 |  |
This motion is essentially the same as for number 3 however it is more pronounced, giving greater displacement from the equilibrium position. It is concerted motion. | 316.18 | 57.0704 | E' |
| 6 |  |
stretching of 1 B-H bending of the other 2. Pronounced motion and large displacement from equilibrium so higher in energy. The motion is concerted. | 316.19 | 57.0746 | E' |

It is possible to confirm that the structure resides at a minimum energy because all the frequencies are positive. This is indicative of a trough as the only direction out of the turning point is upwards. These positive values were obtained from the second derivative of the energy surface.
Comparison of IR data for BH3 and GaBr3
| Mode | BH3 Frequencies | Symmetry from D3H Point Group | GaBr3 Frequencies | Symmetry from D3H Point Group | Motion the same |
|---|---|---|---|---|---|
| 1 | 1163.00 | A2" | 76.37 | E' | NO |
| 2 | 1213.18 | E' | 76.38 | E' | YES |
| 3 | 1213.19 | E' | 99.70 | A2" | NO |
| 4 | 2582.28 | A1' | 197.34 | A1' | YES |
| 5 | 2715.45 | E' | 316.18 | E' | YES |
| 6 | 1263.06 | E' | 316.19 | E' | NO |
- The same basis set is used so that all the molecules can be reliably compared.
- The type of motion is the same for three of the modes and not for the other three.
- Frequency of the vibration is proportional √k where k is the force constant and inversely proportional to √µ where µ is the reduced mass. The reduced mass corresponding to each Ga-Br bond (37.234 Kg) is larger than for each B-H bond (0.9220 Kg).
- The energy and symmetry labels of the modes needs to be analysed to see if a reordering has occurred. From the above table it is clear that modes 2 & 3 are degenerate for BH3 whereas modes 1 & 2 are degenerate for GaBr3, there has been a swapping in the order of the symmetries of the first three modes when comparing the two molecules.
- The spectra are similar in respect to the fact that they have the same number of peaks.
- It is noted that for both spectra, two out of the three peaks lie closely together. The actual mode needs to be considered and it can be seen that the close peaks both correspond two bending modes exhibited by the molecules. The other peak accounts for a stretching mode which is higher in energy (with a higher wavenumber on the spectrum).
- The point of performing a frequency analysis is to ensure that the structure is a minimum shown by all positive frequencies on the second row of 'low frequencies'
- The first row of low frequencies represents the vectors of the centre of mass, these are much lower in energy than the second row which depicts the bond vibrations. It is important to ensure that the spread of the first row is between 15 wavenumbers to prove that the optimisation was rigorous and a success.
Molecular Orbitals of BH3
The chk. file for the population analysis can be viewed here and the log. file here. The HPC was not used so the link to D-space cannot be included.
The summary table is given below:

An MO diagram can be generated from the relative energies of the orbitals and this is shown below.

The very bottom MO is not a valence MO as it is too low in energy and just depicts the 1s orbital on boron. It is included for completion.
Are there any significant differences between the real and LCAO MOs?
- The LCAOs are distinct in form whereas the MOs are spread across the whole molecule. The LCAOs do not appear to touch however when they form an MO the eletron density is spread across the whole molecule. The nodes are also much clearer in the MOs and whereas at the point of the change in sign of the wavefunction in the LCAOs, the out of phase densities touch.
What does this say about the accuracy and usefulness of qualitative MO theory? The constituent atomic orbitals can be seen and one can rationalise how they interact to form MOs. Certain propeties of the molecule can be rationalised for example example will the molecule be more or less stable in its anionic form by looking at the HOMO. Reactivity can be assessed by looking at the shape of the HOMO and this can be assessed with attacking species. For example the Burgi-Dunitz angle of attack on a carbonyl can be rationalised using qualitative MO theory. Photoelectric propeties can be rationalised by looking at the HOMO-LUMO gap and as we will see later aromatic propeties from the basis atomic p-orbitals.
Ammonia Optimisation
The level of optimisation was:
# opt=tight b3lyp/6-31g(d,p) nosymm geom=connectivity int=ultrafine scf=conver=9
It is important to keep this above line consistent in the next three calculations as a comparison is being made and the energies needs to be optimised at the same level. It should also be noted that the inclusion of 'nosymm' means that the symmetry will be ignored and thus the point group in the Summary table below is C1. In nature it is C3v.
The log file for the optimisation is given here
and the Summary Table is given below:
Item               Value     Threshold  Converged?
 Maximum Force            0.000002     0.000015     YES
 RMS     Force            0.000001     0.000010     YES
 Maximum Displacement     0.000005     0.000060     YES
 RMS     Displacement     0.000003     0.000040     YES

Frequency
The log file for the frequency analysis can be viewed here
Low frequencies --- -6.5478 -4.7624 0.0010 0.0017 0.0018 1.3376
Low frequencies --- 1089.3505 1693.9257 1693.9298

A population analysis was performed and the log. file can be viewed here and the chk. file here and the summary is given below:
The top line should read 'NH3_population_analysis' as the file was mistakenly titled 'NH3_Optimisation'.

The charge distribution can be viewed below where the red nitrogen has the largest amount of negative charge and the green hydrogens have a large amount of positive charge corresponding to their relative electronegativities.

The range is specified from -1.000 to 1.000 The charge distribution for Nitrogen is -1.125 and for hydrogen is 0.375 and overall cancelling out giving a neutral molecule.
NH3BH3 Optimisation
The level of optimisation was:
# opt=tight b3lyp/6-31g(d,p) nosymm geom=connectivity int=ultrafine scf=conver=9
The NH3BH3 optimisation log file is given here here and the summary and item tables below:
Item Value Threshold Converged?
Maximum Force 0.000002 0.000015 YES
RMS Force 0.000001 0.000010 YES
Maximum Displacement 0.000024 0.000060 YES
RMS Displacement 0.000010 0.000040 YES

Frequency analysis is given here
Low frequencies are given below:
Low frequencies --- -3.4954 -2.7994 -0.0010 -0.0004 -0.0003 3.7087
Low frequencies --- 263.3369 632.9604 638.4385
Although BH3 had previously been optimised the extra integration constraints were not implemented on the molecule so for good practise (even though this will not make much difference as the molecule is so small) the molecule was re-optimised with a more precise coding. The identical method to NH3 and NH3BH3 is used:
# opt=tight b3lyp/6-31g(d,p) nosymm geom=connectivity int=ultrafine scf=conver=9
The log. file and is given here.

Item               Value     Threshold  Converged?
 Maximum Force            0.000004     0.000015     YES
 RMS     Force            0.000003     0.000010     YES
 Maximum Displacement     0.000017     0.000060     YES
 RMS     Displacement     0.000011     0.000040     YES
The frequency analysis is given here
 Low frequencies ---  -16.0448  -13.0317   -5.3536   -0.0006   -0.0006   -0.0006
 Low frequencies --- 1162.9728 1213.1393 1213.1564
It is now possible to determine the energy of the dative bond by considering the energy difference between NH3BH3 and its components NH3 and BH3.
| Molecule | Energy/ a.u. |
|---|---|
| BH3 | -26.61532364 |
| NH3 | -56.55776856 |
| BH3NH3 | -83.22468911 |
In this way the energy difference can be calculated using Hess' Law: (Energy of Products) - (Energy of Reactants) = - 0.4859691 a.u.(H) and - 127.5911687 kJ/mol. In turn this gives a dissociation energy of + 127.5911687 kJ/mol c.f. lit. 109 kJ/ mol [6]. The computational value is slightly higher than the literature value, as Gaussian is measuring a greater electron density present in the dative bond, leading to greater stabilisation and a higher dissociation energy.
WEEK 2
Mini-Project Aromaticity
All the calculatrions were run using the B3LYP forcefield and and the 6-basis set. Special constraints were implemented on the molecules to ensure a tight integration and a tight convergence. The top line of the calculation is given below:
# opt=tight b3lyp/6-31g(d,p) nosymm geom=connectivity int=ultrafine scf=conver=9
All the calculations were carried out in Gaussian and the HPC was not used. The molecules are small so the calculation did not take long in Gaussian.
Benzene
The log file for Benzene optimisation is given here
The Summary is given below. It is noted that in the calculation the symmetry was ignored by the 'nosymm' constraint so the point group of the molecule appears as C1: it is really D6h.

The item table shows convergence.
Item Value Threshold Converged?
Maximum Force 0.000011 0.000015 YES
RMS Force 0.000004 0.000010 YES
Maximum Displacement 0.000042 0.000060 YES
RMS Displacement 0.000015 0.000040 YES
The log file for the benzene frequency analysis is given here and the top line of the low frequencies are all within 15 wavenumbers. In this way the centre of mass of the molecule is well constrained. the summary table is included to check that the lowest energy is the same for both optimisation and the frequency analysis. There are also no negative frequencies present meaning the molecule was well optimised as a negative value for the second line would indicate a transition state.

 Low frequencies --- -8.0762 -3.7975 -3.4295 -0.0004 -0.0002 0.0007
Low frequencies --- 414.5375 414.5434 621.0492
The population analysis was carried out using the checkpoint file from the first optimisation and the MOs were obtained as displayed in the diagram below.
The NBO analysis was performed


All carbons and hydrogens are in the same environment so all charges are the same. Where the specific charge on carbon and hydrogens are given in the diagram below. The charge range was from -1.000 to 1.000.
The benzene MO diagram is given below.


The symmetry was removed in the calculations so the symmetry labels were worked out manually by using the irreducible represntations to work out the symmetry labels of the constituent orbitals. The centre part of the MO diagram is considered to be above orbital 7 as the orbitals below this are significantly lower in energy and are considered as core. The valence orbitals are cited in Hartree in the MO diagram, the HOMO is #21 and the LUMO #22. The molecule exists as a singlet as the doubly degenerate HOMO is fully occupied.
| Orbital Number(s) | Symmetry Label |
|---|---|
| 7 | a1g |
| 8,9 | e1u |
| 10,11 | e2g |
| 12 | a1g |
| 13 | b1u |
| 14 | b2u |
| 15,16 | e1u |
| 17 | a 2u |
| 18,19 | e2g |
| 20,21 | e1g |
| 22,23 | e2u |
| 24 | a1g |
| 25,26 | e1u |
| 27 | b2g |
An interesting point which is raised is where does the aromaticity arise from?
The LCAO approach states that planar compounds with a contiguous cyclic array of p-orbitals perpendicular to the plane of the ring, display a special stability which is aromaticity. They are aromatic when they have 4n+2 pi electrons within these orbitals and anti-aromatic when they contain only 4n electrons. This is Huckel's rule of Aromaticity. The simplified MO diagram for the 6 pi electrons in benzene is shown below.

The lowest orbital corresponds to MO #17 in the diagram the other two degenerate MOs correspond to orbitals #20 and #21. The antibonding orbitals correspond to the degenrate pair #22 & #23 and the highest energy #27 at the top of the diagram. These orbitals are derived directly from LCAOs from p-orbitals. As expected MO #17 contains no interatomic nodes, #20 & 21 contain 1 interatomic node, the antibonding #22 & #23 contains 2 interatomic nodes and #27 contains 3 interatomic nodes. The other MOs are derived from a mixture of s and p orbitals on both carbon and hydrogen.
It is important to note that a nodal plane through the plane of the carbon atoms in the benzene ring is less important than a nodal plane in the internuclear distance between the C-C bonds as observed in MOs #20 & #21.
Boratabenzene
The Optimisation was ran using the same basis set and integration level and the log file can be view here. The charge was changed to -1 so that it is isoelectronic with benzene.
The summary table is given below:

The item table showed good convergence:
 Item Value Threshold Converged?
Maximum Force 0.000006 0.000015 YES
RMS Force 0.000003 0.000010 YES
Maximum Displacement 0.000043 0.000060 YES
RMS Displacement 0.000015 0.000040 YES
A frequency analysis was ran to ensure no transition states were present and the log file can be viewed here
The top line of low frequencies are in a narrow range and the bottom line does not contain any negative values.
 Low frequencies --- -5.5238 -3.3620 0.0006 0.0007 0.0008 4.1279
Low frequencies --- 371.2048 404.4370 565.0811
A population analysis was performed and the chk. file can be viewed here
The log. file can be viewed for NBO analysis here
The image below shows the charge distribution with a range of -1.000 to 1.000.

It is important to note that the symmetry of the molecule is reduced when the B replaced the H, the D6H symmetry has been replaced with C2V and the atoms no longer posses a degenerate charge distribution equally amongst the Hs and Cs. The para carbon is more negatively charged than the meta carbon this highlights the point that the NBO charge distribution is controlled by resonance and this outweighs any inductive effects. This is further discussed when the charge distribution between molecules is compared later in the project.

pyridinium
The log. file for the optimisation is given here.
The corresponding Summary and Item tables are given below:

 Item Value Threshold Converged?
Maximum Force 0.000004 0.000015 YES
RMS Force 0.000001 0.000010 YES
Maximum Displacement 0.000014 0.000060 YES
RMS Displacement 0.000004 0.000040 YES
The log. file for the frequency analysis is given here

The point group is the same as the previous molecule and is: C2v
and the low frequencies:
 Low frequencies --- -9.3850 -2.9574 -0.0009 -0.0008 -0.0007 0.8986
Low frequencies --- 391.9003 404.3428 620.1994
The population analysis was performed and the checkpoint file is given here
the log. file Log file here
This gave the charge distribution: the charge range is given as -1.000 to 1.000


Borazine
The log file for the borazine analysis is given here
The Summary and item tables below:
 Item Value Threshold Converged?
Maximum Force 0.000010 0.000015 YES
RMS Force 0.000005 0.000010 YES
Maximum Displacement 0.000056 0.000060 YES
RMS Displacement 0.000019 0.000040 YES

The true point group of the molecule is D3h.
A frequency analysis was performed and the log. file can be viewed here
With low frequency data given below:
 Low frequencies --- -4.1701 -3.4721 0.0009 0.0010 0.0010 4.3853
Low frequencies --- 289.7154 289.7986 404.5250
The population analysis was performed and the chk. file can be view here
and the log. file here
The charge distribution from the NBO analysis can be viewed below. The range used was from -1.000 to 1.000

The specific charges are given here and the symmetric nature of the molecule meant that the charge was distributed in a degenerate fashion for B and N and H as shown below:

Comparison of Charges
| Comparison Molecule | Benzene | Boratabenzene | Pyridinium | Borazine |
|---|---|---|---|---|
 |
|
|
|
|
| Atom Number | Benzene Charge | Boratabenzene ion Charge | Pyridinium Ion charge | Borazine Charge |
|---|---|---|---|---|
| 1 | 0.239 | -0.097 | 0.483 | -0.077 |
| 2 | 0.239 | 0.184 | 0.285 | 0.432 |
| 3 | 0.239 | 0.179 | 0.297 | -0.077 |
| 4 | 0.239 | 0.186 | 0.297 | 0.432 |
| 5 | 0.239 | 0.179 | 0.297 | -0.077 |
| 6 | 0.239 | 0.184 | 0.285 | 0.432 |
| 7 | -0.239 | 0.202 | -0.476 | 0.747 |
| 8 | -0.239 | -0.588 | 0.071 | -1.102 |
| 9 | -0.239 | -0.250 | -0.241 | 0.747 |
| 10 | -0.239 | -0.340 | -0.122 | -1.102 |
| 11 | -0.239 | -0.250 | -0.241 | 0.747 |
| 12 | -0.239 | -0.588 | 0.071 | -1.102 |
| Boron | Carbon | Nitrogen | Hydrogen |
|---|---|---|---|
| 2.04 | 2.55 | 3.04 | 2.20 |
The distribution of charge in the molecule can be explained by both induction and resonance, if present the effects of resonance are expected to outweigh induction. Similarly information from the point group will dictate whether the charge distribution is uniform or not. Benzene: D6h Pyridinium: C2v, Boratabenzene: C2v, Borazine: D3h. Benzene and Borazine have more than 1 C2 axis of rotation whereas Pyridinium and Boratabenzene only have 1 C2 rotational axis. The uniform spread of charges arises along a C2 axis. In benzene there are 6 C2 axes along the plane of the molecule. so all 6 carbon and hydrogen atoms have the same charge. In Borazine there are 3 C2 axes along the plane of the molecule so all three Nitrogens (and attached hydrogens) have the same charge; the same being true for the 3 B-H charges. The other 2 molecules have 1 C2 along the molecular plane so the corresponding ortho meta and para positions(and hydrogens) have the same charge. This can be ratified from the above charge distribution information.
However Inductive and resonance effects need to be employed to determine what sort of charge these positions will bear. This information is given below:
Pyridinium Resonance Forms:

It is confirmed that carbon atoms ortho and para to the nitrogen will be more positively charged than the meta position. It is striking that the para position is actually negatively charged (-0.122) though. The Hydrogens are all positively charged even though carbon is more electronegative than hydrogen. The nitrogen is more electronegative element and bears the brunt of the negative charge (-0.476) even though it is assigned a positive charge in the structure. The molecule is positively charged so the overall constituent charges add to +1.
Boratabenzene Resonance Forms:

The carbon atoms ortho and para to the Boron are more negatively charged than the meta position, The Boron is positively charged even though it is assigned a negative charge in the molecule. The molecule is negatively charges so the overall constituent charges add to -1.
Benzene:

It is expected that the Carbon will have slightly more electron density due to it being more electronegative than Hydrogen. The charge is spread evenly across the molecule otherwise. The resonance structures of Benzene are uniform and do not show any build up of charge in the molecule. The molecule is negatively charges so the overall constituent charges add to 0.
Borazine:

Similarly the resonance structures give no indication as to the distribution of electron density in the molecule so induction has to be considered to determine the distribution. It is expected that the Nitrogens will bear the most electron density, Hydrogen is slightly more electronegative than Boron so there will be more electron density on the hydrogen to the Boron. The molecule is negatively charges so the overall constituent charges add to 0.
| Atom Number | Molecules | Comment |
|---|---|---|
| 7 | Boratabenzene & Borazine | The B (0.202) in boratabenzene has a smaller positive charge than in borazine (0.747) this is due to the greater electronegaive influence of the N than the C atoms. |
| 8&12 and 10 | Boratabenzene | The ortho position (-0.588) is more negatively charged than the para position (-0.340): this is due to the inductive consequence of C being more electronegative than B and the closer proximity of the ortho C than the para C to the B. |
| 8&12 and 10 | (Pyridinium | The ortho position (0.071) is more positively charged than the para position (-0.241): this is due to the inductive consequence of N being more electronegative than C and the closer proximity of the ortho C than the para C to the N. |
| 7&1 | Pyridinium | The largest charge difference between any adjacent atoms is between the N -0.476 and H 0.483 on pyridinium as this represents the greatest difference in electronegativity of any adjacent atoms in the four molecules. This is greater than the B-H difference in Borazine even with the influence of the two electron withdrawing adjacent nitrogens. |
Comparison of MOs.
It was decided that the MOs should be represented as solid surfaces and the 'see-through' option in Gaussian was not envoked. In this way it is easier to see the undulations on the surface.
The MOs where chosen so an MO derived from an LCAO of all s-orbitals would be considered (#7) and MO dervided from an LCAO of both s and p-orbitals (#12) and an MO derived from an LCAO of just p-orbitals (#17).
| MO number | Benzene | Boratabenzene | Pyridinium | Borazine |
|---|---|---|---|---|
| 7 |  |
 |
 |
 |
| 12 |  |
 |
 |
 |
| 17 |  |
 |
 |
 |
MO Number 7 Comparison
This MO is from an LCAO of s-orbitals and is lowest energy valence molecular orbital for all four molecules. From highest to lowest energy the ordering is boratabenzene (-0.60437 H)> benzene (-0.84671 H) > borazine (-0.88856 H) > pyridine (-1.21399).
Non of these orbitals are degenerate as their constituents are all in phase s-orbitals and there is no other way of arranging these or generating a smaller basis set to describe this MO with the same energy. There are no nodes present (which would raise the energy) and they are all bonding in character.
The distribution of electron density is different in the molecules. It is very symmetric for benzene covering all atoms isoelectrically and is made up of all H(1s) and C(2s) atomic orbitals. In boratabenzene the density does not cover the B-H, this is due to the energy difference between the B-H atomic orbital fragment and the other s-orbital fragment, consequently the B-H fragment does not appear in the LCAO. This MO just consists of C(2s) and H(1s) orbitals. It is higher in energy than benzene due to a smaller number of orbitals in the basis set. In pyridinium, the N(2s) is involved, this is particularly low in energy due to the high electronegativity of nitrogen. The MO is skewed across the molecule and is particularly pronounced over the Nitrogen region, again this is due to the electronegativity of nitrogen and the electron density being drawn into the region of large effective nuclear charge, the hydrogens attached to the meta and para carbons are neglected and so not have any electron density covering them, it is not clear if they belong to the basis set or whether the overwhelming electronegativity of the nitrogen withdraws all the density away from them. The distribution of density in borazine is symmetric however it does not cover all atoms. The B-H units are not covered and this borazine MO is made up of the 3 N-H fragments. These fragments are low in energy however there are not enough atomic orbitals in the basis set to make this the lowest energy so it sits in second place.
MO Number 12 Comparison
These MOs are higher in energy than MO number 7 and altogether very different in form. The ordering of energy from highest to lowest is boratabenzene (-0.28949 H) > benzene (-0.51787 H) > borazine (-0.52456 H) > pyridine (-0.79009 H). This is the same as above however it is not as clear cut. The benzene and borazine orbitals are particularly close together in energy. The constituent LCAO make up is a combination of s and p atomic orbitals for all MOs.
It is important to note that borazine has a degenerate orbital, however the other molecules do not. This down to borazine having a different point group to the other molecules.
These molecular orbitals are completely different in form and they do not contain the same LCAO basis sets. There is one concentric ring node in benzene which exists on the carbon atoms due to the node in the p-orbitals on the carbon atoms.
The area of antibonding in MO 17 is the smallest on pyridinium, this is why it is lowest in energy. It appears that the nodal area of antibonding on the benzene is the largest however this is made up for by the large bonding region around the ring framework.
The lowest energy MO for pyridine contains more of an equal contribution from each phase in the MO. The outer ring of density does not spread all the way around the ring and does not include the p-orbital on the nitrogen. p-orbitals have a greater splitting energy than s-orbitals so the energy difference is expected to be larger for the p-orbitals: this is perhaps why there is no interaction with the C(p-orbital) and N(p-orbital) from the LCAO set.
The highest energy MO of boratabenzene does not have a continuation of electron density of the same phase around the ring, it is not clear why this is the case. It is not clear whether this is the same basis set as that used for benzene.
The nodes exist on the atoms for benzene and boratabenzene, the borazine is the only MO that actually has a region of the same phase which reaches across the molecule. It should be noted that nodes between atoms have a greater destabilising effect than the nodes on atoms.
There are bonding and antibonding regions in all the molecules separated by nodes. but of course the overall character of all MOs is bonding. The nodes are all between atoms and do not exist on atoms.
MO Number 17 Comparison
These MOs contribute to the aromaticity of the molecule. They are the lowest energy contiguous LCAO p-orbitals in the cyclic ring. Unanimously all p-orbitals interact and they all contain a nodal plane along the framework of the atoms. The energy ordering of the orbitals is boratabenzene (-0.13209 H) > benzene (-0.35994 H)> borazine (-0.36134 H) > pyridine(-0.64062 H). Again this energy ordering is not clear cut as the MO energies of benzene and borazine are very similar.
None of the MOs have a degenerate counterpart. This is ratified using a Muslin-frost diagram where the lowest energy aromatic orbital is non-degenerate.
The form of these MOs is very similar, this is because they are made up of just p-orbitals perpendicular to the plane of the ring. It is interesting to note that 3(N)2p + 3(B)2p orbitals in borazine is a slightly lower energy combination than 6(C)2p orbitals in benzene. They all contain a nodal plane running through the framework of the ring.
In the same way it is also interesting to note that raising the energy of one constituent p-orbital (B in boratabenzene) has such a significant energy difference between the converse: lowering the energy of a p-orbital (N in pyridine). Similarly the electron density just stretches over the Hs in benzene and borazine however it does not strech over then B-H or N-H in boratazine or pyridine. This signifies the overlap difference of the heteroatom p-orbital and the carbon p-orbitals.
The effects of these substitutions on the whole MO diagram
A muslin frost diagram can be used as a simplified MO diagram depiction to show how lowering the symmetry from benzene instigates as lack of degeneracy.
More electronegative atoms lower the energy of the atomic orbitals and making them less diffuse. The radial distribution functions show that the electron is more likely to appear near the nucleus and thus be stabilised by the positive charge.
The total electronegativity of the constituent atoms in:
Benzene is: C(2.55 x 6) + H(2.20 x 6) = 28.5
Pyridinium is C(2.55 x 5) + H(2.20 x 6) + N(3.04 x 1) = 28.99
Boratabenzene is C(2.55 x 5) + H(2.20 x 6) + B((2.04 x 1) = 27.99
Borazine is B(2.04 x 3) + (3.04 x 3) + H(2.20 x 6) = 28.44
In this way it is expected that the lowest energy MO sequence will be pyridinium and the highest energy being boratabenzene. Although the total electronegativity is slightly greater for benzene than borazine this was reversed in the MO calculation results, this is perhaps because the MOs are more diffuse for and spread out over the whole molecule in benzene. In borazine they are contracted and less diffuse for example in MO number 7 the MO seems to be held together by the nitrogens.
The sequence of HOMO energies which dictates the stability of the molecule shows that the pyridinium is the most thermodynamically stable; followed by borazine, benzene and boratabenzene in this order.
Something I found Interesting
Earlier MO number 7 was investigated. This is the lowest energy valence MO, it would be interesting to measure the energy difference between the HOMO and the lowest energy valence MO, this would generate an understanding of how good the overlap of the atomic orbitals making up the MOs were.
| Boratabenzene | Benzene | Borazine | Pyridinium |
|---|---|---|---|
| 0.01095 H (non-degenerate) | -0.24690 H (non-degenerate) | -0.27593 H (degenerate) | -0.47886 H (non-degenerate) |
| Benzene | Boratabenzene | Borazine | Pyridinium ion |
|---|---|---|---|
| -0.84671 H (non-degenerate) | -0.60437 H (non-degenerate) | -1.21399 H (non-degenerate) | -0.88856 H (non-degenerate) |
| Benzene | Boratabenzene anion | Borazine | Pyridinium ion |
|---|---|---|---|
| 0.83576 H | 0.35747 H | 0.93806 H | 0.40960 H |
The lowest energy difference is for benzene< Pyridinium< Boratabenzene< Borazine.
The MOs in benzene covered the whole molecule whereas in borazine they were skewed towards the either the nitrogens or the borons. The basis set for the MOs in benzene often included all 12 atomic orbitals in the MOs, this was not the case for the other molecules. This is represented by the abover energy spread. In the same way the degeneracy of MOs was lost when the symmetry was reduced, this contributed to the larger spread for the other 3 molecules as shown above.
References
- ↑ B. Réffya, M. Kolonitsb, M Hargittai. Journal Molecular structure, Vol. 445, 1-3, 1998, p. 139-148
- ↑ B. Réffya, M. Kolonitsb, M Hargittai. Journal Molecular structure, Vol. 445, 1-3, 1998, p. 139-148
- ↑ C. E. Housecroft, A. G. Sharpe, Inorganic Chemistry, 2005, 2nd ed., ch. 12, p. 308.
- ↑ Kawaguchi, Kentarou (1992). "Fourier transform infrared spectroscopy of the BH3 ν3 band". The Journal of Chemical Physics 96 (5): 3411. DOI:10.1063/1.461942
- ↑ A. Cotton, G. Wilkinson, C. Murillo, M. Bochmann; Advanced Inorganic Chemistry; 1999, 6th ed, 225-227
- ↑ Klooster, et. al. JACS, 1999, 121, 6337
- ↑ (1932). "The Nature of the Chemical Bond. IV. The Energy of Single Bonds and the Relative Electronegativity of Atoms". Journal of the American Chemical Society 54 (9): 3570–3582. doi:10.1021/ja01348a011