Rep:Mod:VFC2398
BH3
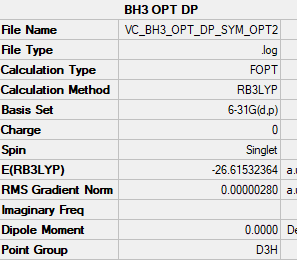
B6-31G(d,p) Level
       Item               Value     Threshold  Converged?
 Maximum Force            0.000006     0.000450     YES
 RMS     Force            0.000004     0.000300     YES
 Maximum Displacement     0.000022     0.001800     YES
 RMS     Displacement     0.000015     0.001200     YES
 Predicted change in Energy=-1.861815D-10
Frequency analysis log file Media:VC BH3 FREQ.LOG
 Low frequencies ---  ---   -2.2126   -1.0751   -0.0055    2.2359   10.2633   10.3194
 Low frequencies --- 1162.9860 1213.1757 1213.1784
Optimised BH3 ( D3h) |
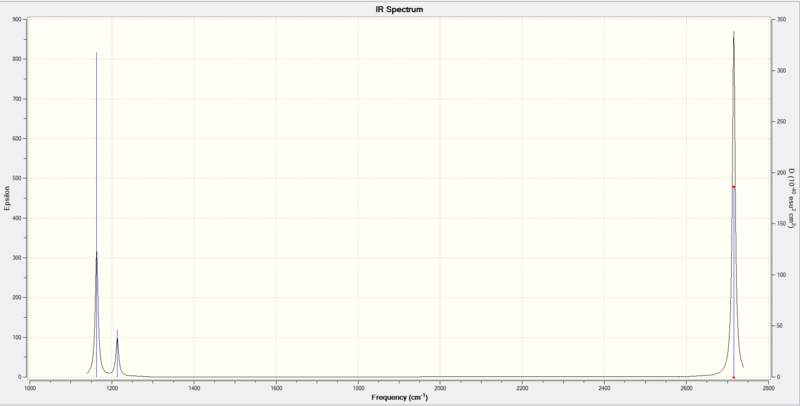
Vibrational Spectrum for BH3
| Wavenumber (cm-1 | Intensity (au) | symmetry | IR active? | type |
| 1163 | 92 | A2" | yes | out-of-plane bend |
| 1213 | 14 | E' | slight | bend |
| 1213 | 14 | E' | slight | bend |
| 2582 | 0 | A1' | no | symmetric stretch |
| 2715 | 126 | E' | yes | asymmetric stretch |
| 2715 | 126 | E' | yes | asymmetric stretch |
Only three peaks are observed in the IR spectrum due to the fact that there are 2 degenerate sets of vibrations and the symmetric stretch does not result in a change in dipole therefore is not IR active
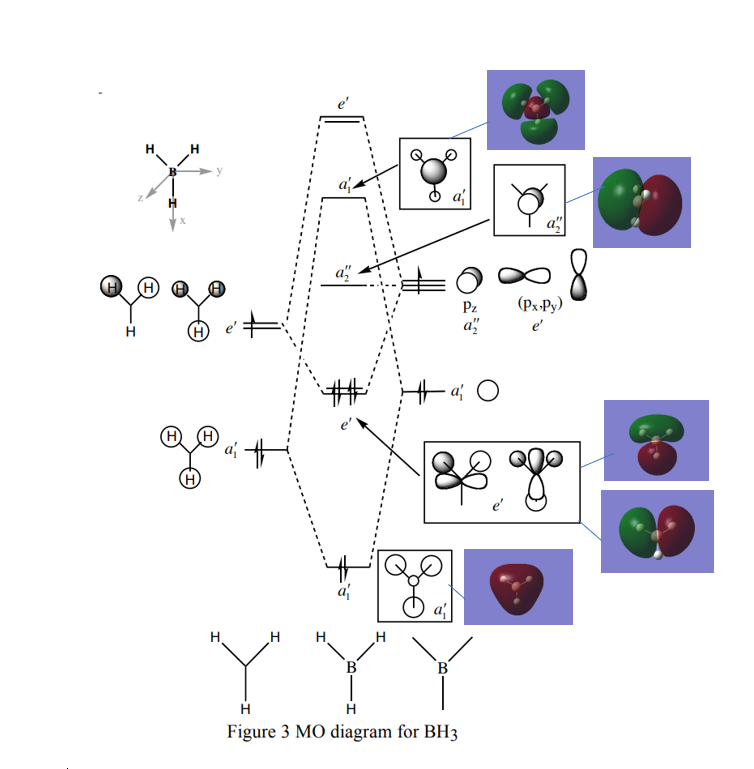
Molecular Orbital Diagram of BH3
Figure 1. Molecular Orbital Diagram of BH3 (D3H Point Group) by Dr. Tricia Hunt with computed MOs (Problem Class 1 Answers).
There are no significant differences between the real and LCAO MOs for the bonding orbitals however there is a slight deviation between the antibonding real and LCAO MOs as the real MOs are larger and more diffuse. Overall qualitative MO theory is very useful as it provides a significantly accurate representation of the real molecular orbitals.
Nice inclusion of the lower energy MOs on to the diagram but sadly, you are missing both the LCAO and calculated MOs for the top two 2e' MOs. Your comment is good in trying to examine the differences but isn't quite correct, it is the difference in the relative orbital contributions to the MO e.g. larger contribution from the H s-orbitals in the 3a1' MO compared to the LCAO prediction, rather than the diffuse nature of the whole MO. Smf115 (talk) 22:24, 18 May 2019 (BST)
Association Energies: Ammonia - Borane
NH3
B6-31G(d,p) Level
         Item               Value     Threshold  Converged?
 Maximum Force            0.000006     0.000450     YES
 RMS     Force            0.000004     0.000300     YES
 Maximum Displacement     0.000012     0.001800     YES
 RMS     Displacement     0.000008     0.001200     YES
 Predicted change in Energy=-9.843879D-11
Low frequencies ---   -8.5646   -8.5588   -0.0047    0.0454    0.1784   26.4183
Low frequencies --- 1089.7603 1694.1865 1694.1865
Optimised NH3 Molecule (C3v) |
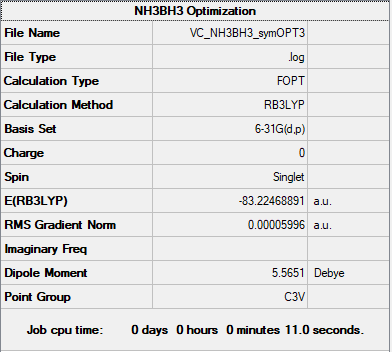
NH3BH3
B6-31G(d,p) Level
         Item               Value     Threshold  Converged?
 Maximum Force            0.000122     0.000450     YES
 RMS     Force            0.000058     0.000300     YES
 Maximum Displacement     0.000531     0.001800     YES
 RMS     Displacement     0.000296     0.001200     YES
 Predicted change in Energy=-1.655077D-07
File:VC NH3BH3 SYMOPT3 FREQUENCY.LOG
Low frequencies ---   -0.0251   -0.0032    0.0007   17.1236   17.1259   37.1326
Low frequencies ---  265.7816  632.2034  639.3483
Optimised NH3BH3 Molecule (C3v) |
Energy Calculations
E(NH3)= -56.55776873 AU
E(BH3)= -26.61532364 AU
E(NH3BH3)= -83.22468891 AU
Association energy: ΔE=E(NH3BH3)-[E(NH3)+E(BH3)]
ΔE= -0.05159654 AU
ΔE= -129 kJ/mol
Good presentation of the energies and the values are correct, however, your final calculated values is a bit out from the correct value. You were also meant to evaluate the bond strength by comparison to known bond dissociation energies which is missing here. Smf115 (talk) 22:29, 18 May 2019 (BST)
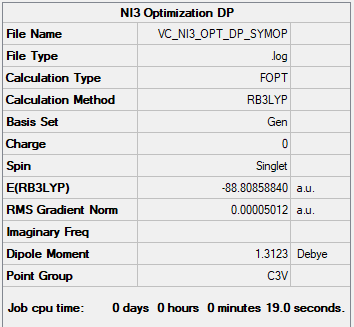
NI3
Gaussian Optimization: B3LYP/6-31G(d,p)LANL2DZ
         Item               Value     Threshold  Converged?
 Maximum Force            0.000140     0.000450     YES
 RMS     Force            0.000092     0.000300     YES
 Maximum Displacement     0.001123     0.001800     YES
 RMS     Displacement     0.000804     0.001200     YES
 Predicted change in Energy=-1.725143D-07
Low frequencies ---  -57.5982  -57.5982  -54.4001   -0.0138   -0.0053   -0.0037
Low frequencies ---  125.3731  125.3764  182.0113
Optimised NI3 Molecule (C3v) |
Optimised Bond length = 2.18369 ± 0.001 Å
Good structure information throughout, you've added the pseudopotential correctly and nice attention to the symmetry of the molecules. Just note that the summary tables should have come from your submitted frequency calculations and not the optimisations. Smf115 (talk) 22:27, 18 May 2019 (BST)
Ionic Liquids: Designer Solvents
[N(CH3)4]+
B6-31G(d,p) Level
                Item               Value     Threshold  Converged?
 Maximum Force            0.000072     0.000450     YES
 RMS     Force                 0.000036     0.000300     YES
 Maximum Displacement     0.000695     0.001800     YES
 RMS     Displacement     0.000393     0.001200     YES
 Predicted change in Energy=-2.854238D-07
Low frequencies ---    0.0007    0.0007    0.0012   34.6615   34.6615   34.6615
Low frequencies ---  216.7275  316.0595  316.0595
Optimised Structure Molecule (Td) |
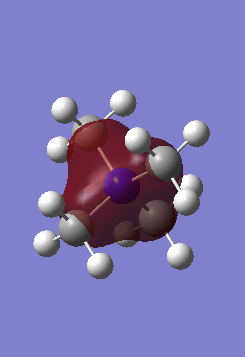
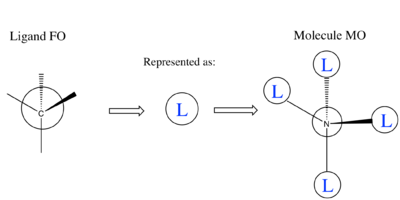
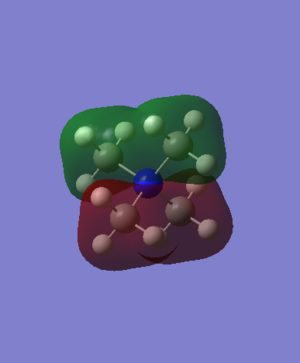
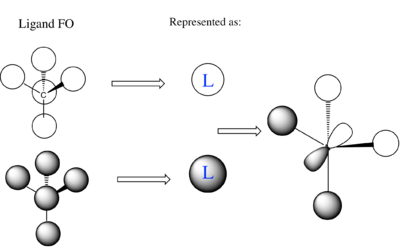
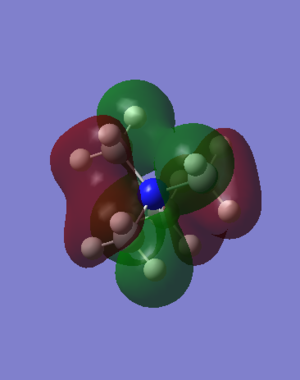
[N(CH3)4]+ MO Analysis
| Computed MO | LCAO Diagram |
|---|---|
 |
|
 |
|
 |
 ] ]
|
Correct FOs and LCAOs, however, the MOs studied should have been labelled. To improve, it would have been good to consider the overall character of the MOs or some of the key interactions so that you were then selecting a more complex range of MOs. Smf115 (talk) 22:43, 21 May 2019 (BST)
[P(CH3)4]+
B6-31G(d,p) Level
         Item               Value     Threshold  Converged?
 Maximum Force            0.000220     0.000450     YES
 RMS     Force            0.000125     0.000300     YES
 Maximum Displacement     0.001482     0.001800     YES
 RMS     Displacement     0.000877     0.001200     YES
 Predicted change in Energy=-1.724462D-06
Low frequencies ---    0.0015    0.0021    0.0024   50.6420   50.6420   50.6420
Low frequencies ---  186.8233  211.6753  211.6753
Optimised Structure (Td) |
Charge Distribution
[N(CH3)4]+ NBO Charge Distribution

| Atom | Charge |
|---|---|
| N | -0.295 |
| C | -0.483 |
| H | 0.269 |
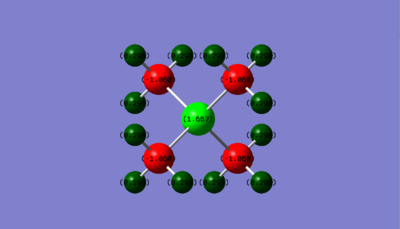
[P(CH3)4]+ NBO Charge Distribution
| Atom | Charge |
|---|---|
| P | 1.667 |
| C | -1.060 |
| H | 0.298 |
The [P(CH3)4]+ cation has the most positive charge residing on the phosphorus atom (+1.667) this differs from the [N(CH3)4]+ cation where the central Nitrogen atom has a slightly negative charge (-0.295). This suggests that the models used to represent [NR4]+ (R=alkyl) which are often depicted with the positive charge placed on the nitrogen centre are not significantly valid as although the molecule has a formal positive charge due to the nitrogen atom being 1 electron deficient, in reality the distribution of electrons and hence the charge does not reflect this. The charge distribution will be affected by additional intrinsic factors of the atoms such as electronegativity. Nitrogen is more electronegative than phosphorus therefore it is more polarising, this results in the nitrogen ionic complex having an electron-withdrawing effect on its ligands resulting in the most positive charge within the molecule being located on its hydrogen atoms.
Correct charges but you should have used an equal colour range on both molecules to compare the charge distributions. While the comparison of the N to P electronegativities is right, you haven't really analysed the charge distributions much and your answer could be developed a lot more, particularly if you consider other effects such as symmetry. Smf115 (talk) 21:45, 20 May 2019 (BST)
You are lacking a proper explanation as to why the +1 charge arises in the traditional picture and you do not highlight where the positive is actually sat (consider your NBO charges). Smf115 (talk) 21:45, 20 May 2019 (BST)
Overall, a good report and well presented. Smf115 (talk) 22:44, 21 May 2019 (BST)

