Rep:Mod:VEP2706
Simulation of a simple liquid
Modeling the behaviour of a classical harmonic oscillator
Two methods of finding the positions x at time t were compared. First, the position was determined by velocity Verlet algorithm and second, for the same times, position x was determined analytically:

The difference between the two methods was evaluated and analyzed as a function of time. The error values fluctuate but also the maximum increases over time. From the results it was visible that there is a linear increase in maximum error over time period. This linear trend was described by equation: y = 0.0004x - 7*10-5. The growth results from the fact that the simulation output of previous calculation was used for determining next value so with every time-step, the input value was less exact.
Velocity Verlet algorithm uses certain approximations and as other numerical models results in certain inaccuracy giving differing physical properties to the ones measured. In this case, it is visible on total energy. The results show changes in total energy but, in reality, the total energy remains the same in every time. To minimize the inaccuracy of the simulation, an appropriate time-step had to be chosen. The shorter the time-step, the less the total Energy varied over time. To ensure that the total Energy does not change more than 1% over the course of the simulation, the time-step value must be smaller than 0.3.
Lennard-Jones potential
Lennard-Jones interaction is used to describe an interaction between two uncharged particles and the results can be implied to bulk liquid. In close proximity, the potential is negative. As the the distance between two particle grows, it reaches r0 at which .
Finding r0 was done in following steps:
Therefore which corresponds with the definiton of σ as distance at which the potential is zero. Force at seperation is equal to at zero.
- As ;
Separation equilibrium req is the distance at which the interaction reaches its maximum. req can be calculated from first derivative of Lennard-Jones interaction.
To obtain the well depth, the distance r is substituted by the previous expression for Lennard-Jones potential.
Finally, integrals of Lennard-Jones potentail were evaluated for , , and . For the calculations
Same process was followed For the other integrals:
Preparing for the simulations
To run the simulations in this experiment, an imaginary box with defined properties and set number of particles enclosed had to be defined. A simulation box has set boundaries. If an atom within a box moves towards the boundaries, periodic boundary conditions are applied. Therefore there is same number of atoms throughout the course of a simulation. Example of these condition can be shown on an atom at position (0.5, 0.5, 0.5) in a cubic simulation box which runs from (0, 0, 0) to (1, 1, 1). In a single timestep, it moves along the vector (0.7, 0.6, 0.2). After this step the atom has a position of (0.2, 0.1, 0.7).
The number of atoms used in simulations does not represent realistic volumes. Under standard conditions, there is 3.4*1022 molecules of water (), whereas 10000 molecules of water take volume of 3.0*10-20 mL.
Before running the simulations, all used values were converted into reduced units which are usually used with Lennard-Jones potential.
For example
- ; If LJ cutoff value is set as r* = 3.2 and for Argon, the actual cutoff is equal to 1.088nm.
- ; if T* is set as 1.5, the actual temperature is set to 180K.
- ; well depth =
Defined number of atoms was created and placed in the simulation box by generating simple cubic crystal structure and placing the atoms on its lattice points. When generating a lattice, its type and density must be defined. The output file of a simulation gives line with calculated lattice spacing. The lattice spacing, x, can be also determined from a number density and vice versa.
In this case simple cubic structure was used and mass of an atom is set to 1. Therefore, density can be calculated using this equation:
If face centered cubic lattice of density 1.2 was used instead of simple cubic, the length of the unit cell, x, would be 0.67 as because face centered cubic lattice consists 4 lattice points compared to simple cubic lattice which contains only 1 lattice point.
When creating a simulation box, its size was defined by writing how many times, a single lattice unit repeats in x,y,z directions. In next command, the box was filled with atoms.
region box block 0 10 0 10 0 10
The box was filled with atoms by applying next command. As a result 1000 atoms was created. If a face centered cubic lattice which was considered before was used instead, 4000 atoms would be generated.
Use of the crystal structure was preferred to giving atoms random starting coordinates as it may lead te and in reality atoms would not reach such smallo generating pairs of atoms with distance r in between smaller than which would mean that the interaction is negative and in reality two atoms would not get into such proximity.
Apart from the box, the properties of atoms were also set. That was done by these commands:
mass 1 1.0
pair_style lj/cut 3.0
pair_coeff * * 1.0 1.0
The first line sit the mass of atom type 1 to a value of 1.0. In this simulation only 1 type of atoms was used. The next two lines are to specify pairwise interactions: the first one specifies that Lennard-Jones interactions are calculated for values of r smaller than 3.0, the second line gives interaction coefficients between types of atoms. Because only one type is used, the coefficients are set to 1.0 for interactions between all atoms in the simulation.
The simulation uses velocity-Verlet algorhitm which requires not only set initial position xi(0) but also initial velocity vi(0). Therefore, for each atom velocity had to be specified as well.
Running the equilibartion
The equilibration was done for different values of timesteps and the simulation was run 100000 times. These commands were written in the input file:
### SPECIFY TIMESTEP ###
variable timestep equal 0.001
variable n_steps equal floor(100/${timestep})
variable n_steps equal floor(100/0.001)
timestep ${timestep}
timestep 0.001

### RUN SIMULATION ###
run ${n_steps}
run 100000
This command was written to link the value of timestep to number of runs. Therefore, if timestep was changed, the number uf runs would change as well and it would not have to be changed manually.
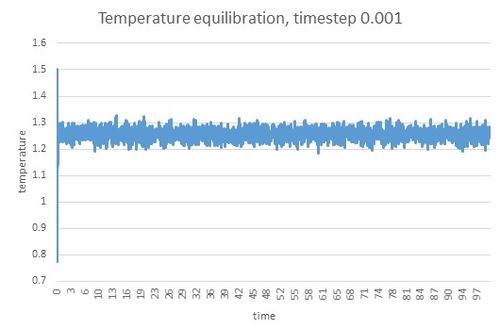
The output of the simulation gives values of temperature, energy and pressure over the course of the simulation. The results for simulation running at timestep 0.0001 gave following trends:
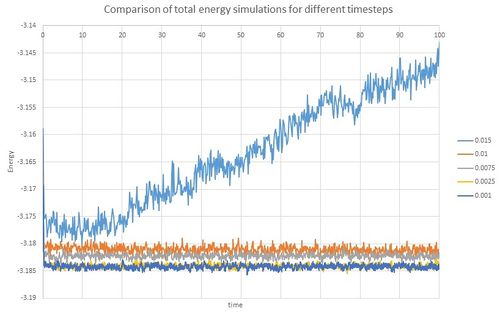
All variables reached equilibration within very short period of time (within 0.3 unit time). To see what effect timestep has on equilibration, total energies over time were compared. Lines for the two shortest timesteps, 0.001 and 0.0025 were very similar: the equilibrium was reached quickly for both and they both gave similar values. The next two timesteps, 0.0075 and 0.01, reached equilibrium relatively quickly as well. However, compared to previous results, the total Energy values were higher and therefore not as accurate. The simulation for the longest timestep 0.015 did not reach equilibrium and therefore is not a suitable timestep for running these simulations. Regarding these results when choosing the timestep for the next part of the experiment timestep 0.015 was eliminated for not reaching equilibrium. Timesteps 0.0075 and 0.01 reached equilbrium and could be thought to be used but timestep 0.0025 was evaluated as the most suitable as it gave similar results as the shorter timestep 0.001 which was the most accurate but less timesteps were prefered to cover the same time period in less steps.
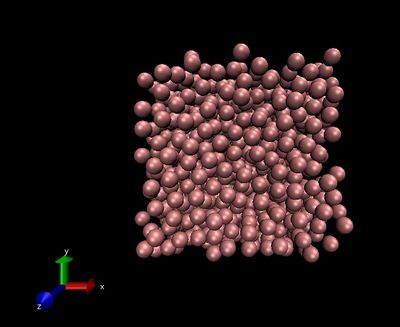
In this part of experiment trajectories were also observed by visualizing them through VMD programme. First the trajectories within the whole system were followed, second, a movement of only a single atom throughout the system was being observed.
Temperature and Pressure control
In the next part of the experiment, temperature and pressure of the system were controlled. Over the period of simulation, the temperature and pressure values fluctuated. Therefore a constant factor, , was introduced. Multiplying velocity by solved the problem of difference between expected temperature and the temperature at a given step. Value of was determined using the equipartition theorem:
Thermodynamic properties temperature, pressure and density were output of this part of the experiment. As temperature and pressure values were set, the main output was the change of density with temperature and pressure. The output had a form of an averaged value of measurements. The averaging was done by this command:
fix aves all ave/time Nevery Nrepeat Nfreq value1 value2
fix aves all ave/time 100 1000 100000 v_dens v_temp v_press v_dens2 v_temp2 v_press2
Nevery Nrepeat Nfreq are arguments which specify how and which values contribute to the average. In this case the averaging occurs on every 100 timestep with 1000 values contributing to average The averaging happens every 100000 timesteps. As the command is run 1000000 times, the simulation lasts 100000 timesteps. In this simulation, the timestep was set to 0.0025 so the simulation time was 250 time units.
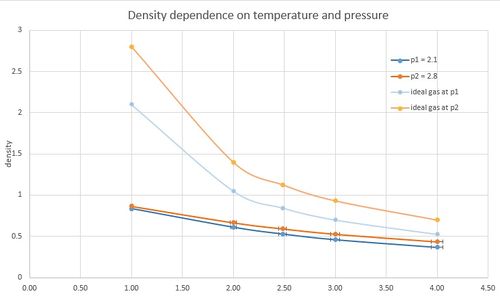
The simulation was done for two different pressures, p*1 = 2.1 and p*2 = 2.8, and for 5 different temperatures T = 120K, 240K, 298K, 360K, 480K. Density values were obtained for 10 different points. The results showed these following trends:
- Density decreases with increasing temperature.
- Density increases with increasing pressure.
- Error in simulation calculation increases with increasing temperature, the error coming from density calculations is minimal.
- The values are lower compared to density values calculated for ideal gas at the same conditions. The difference decreases with increasing temperature, contrarily with increasing pressure the difference between liquid and gas density values is more noticeable. Line describing temperature dependence for a simple liquid has almost linear trend compared to ideal gas where the decay is reciprocal.
The trends follow expectations which rise from applying the equation . The difference between the tested liquid and ideal gas is caused by the fact that in ideal gas no interactions are considered compared to the simulated liquid where interactions cause if two atoms come close together they are repulsed. Also gas compared to liquid is easily compressed, whereas liquid change volume only to certain limit so the decrease in density over range of temperatures is smaller.
Heat capacity
Heat capacity at constant volume is temperature dependence of the energy. [1] In this experiment heat capacity was calculated for 10 different points: for densities equal to 0.2 and 0.8 and temperatures 2.0, 2.2, 2.4, 2.6, 2.8. The calculation was run based on equation:
To run this part of simulation new input file was created: File:Vep hcd2t1.in (example file for density 0.8 and temperature 2.0)
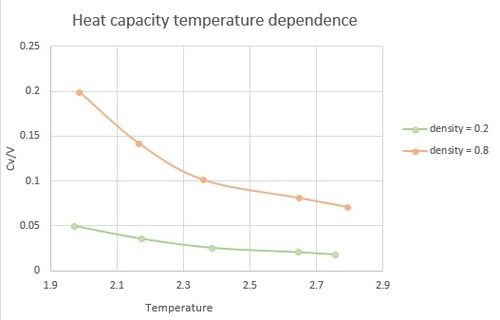
The gained values of heat capacities were plotted as CV/V to show trends over temperature range and also variance with change in density.
The following trends were observed:
- With increasing temperature, heat capacity decreases. The decline is more significant at higher density.
- The heat capacity values are greater for higher density.
A common trend with crystal lattices is that at low temperatures the heat capacity is increasing with increasing temperature. However, in this simulation only a monotonic crystal is considered, giving a decreasing trend. Based on relationship [2] the trend was explained as if the change in internal energy is smaller than change in temperature, the heat capacity at constant volume decreases with increasing temperature.
If crystal density is increased, there is more Energy needed to heat up the system as with increasing density the same space is occupied by more atoms to which energy needs to be given. Therefore, the second trend was observed.
Radial distribution for different states
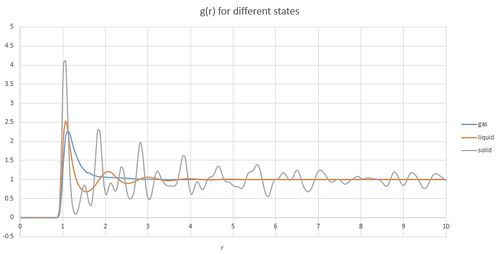
The simulation was performed for three different states. The values of T and density were accustomed to obtain the desired states: solid, liquid and gas. The values were chosen based on phase diagram of Lennard-Jones system.[3].
| Density | Temperature | |
| gas | 0.05 | 1.2 |
| liquid | 0.80 | 1.2 |
| solid | 1.15 | 1.2 |
From the calculated trajectories radial distribution function was calculated.
Radial distribution function of a gas first shows no atoms around until sigma value is reached where the potential of finding other atoms is greatest. With increasing distance, the function stays at the same value. Radial distribution of a liquid follows the similar trend with the first peak at sigma distance. However, the function does not go immediately flat as with gas, instead in shows another peaks and slowly flattens. The following peaks signify sigma distance from the atoms of first peak and so on. These peaks are not visible for gas as the atoms are to dispersed.
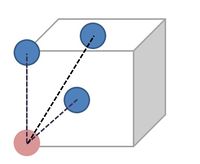
Radial distribution function for solid shows very distinct peaks. The peaks related to distances between atoms within the crystal lattice. In this experiment, face centered cubic lattice was created and the first three peaks of the radial distribution function represent these distances:
The first peak represent distance to the atom placed in the center of the same face (r = 1.07), second peak represents length of the side of the lattice (r = 1.52) and the third closest atom is in the centre of the neighbouring face(r = 1.85).
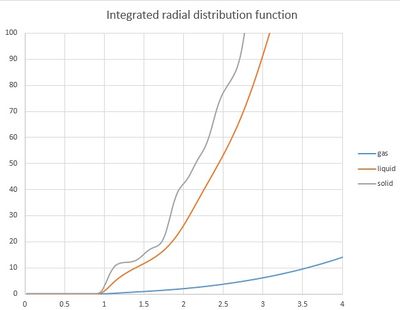
When integrated radial distribution function is observed, the exact number of neighbouring atoms at specific distance can be determined. For solid and liquid the line increases steadily and it is hard to observe specific changes but for the solid it can be determined how many atoms are in the same position towards the allocated atom. For example the integral at r of the first peak is equal to 12, at the distance of the second peak the value is increased by 8 corresponding to 8 atoms. The integrated radial distribution function also shows that gas is less populated than liquid which is less populated than solid.
Dynamical properties
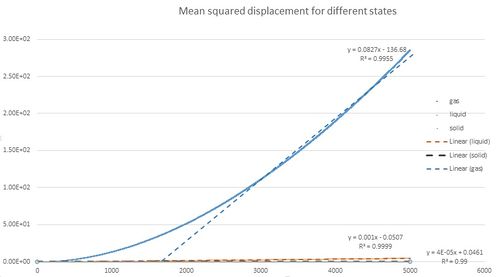
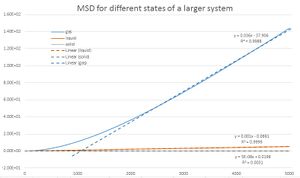
In this part of the experiment, diffusion coefficent was obtained in two different ways. First method used calculations of mean square displacement. MDS was plotted for liquid, solid and gas. The gradients of these graphs which showed linear trend, was used to evaluate the diffusion coefficient D based on the equation: The procedure was repeated for data from a larger system.
| D (unit area/unit time) | 103 atoms | 106 atoms |
| gas | 1.40*10-1 | 5.76*10-2 |
| liquid | 8.49*10-2 | 1.67*10-4 |
| solid | 3.42*10-3 | 8.00*10-9 |
These observations were done:
- The diffusion coefficient decreases from gas to solid.
- The diffusion coefficient reaches smaller values for the larger system.
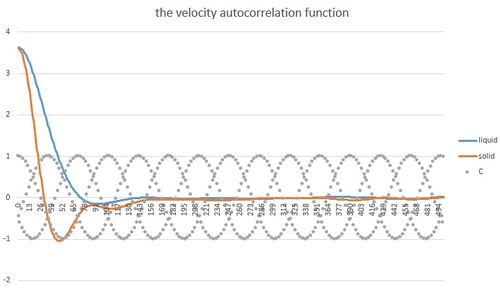
The other method used to calculate diffusion coefficient was via velocity autocorrelation function. VACF reflects on dynamical processes in a system and therefore can be related to diffusion coefficient. At every instant, an atom has specific velocity. The velocity is influenced by forces action on the atom. These forces slowly decrease the velocity correlation until zero is reached. The shape of VACF reflects on the state of the system as different forces are applied. For solid the function is oscillating as the atoms are packed closed to each other and they try to balance positive and negative forces. However, the destruptive forces slowly suppress the oscillation. In liquid, the atoms have higher degree of freedom of movement therefore the oscillation typical for solid can be shown only as one oscillation with following immediate decay to zero.
For comparison VACF for a 1D harmonic oscillator with was plotted on the same graph. An expression for was obtained from these equations:
Failed to parse (syntax error): {\displaystyle C\left(\tau\right) = \frac{\int_{-\infty}^{\infty} -Asin \left{(\omega t+\phi)}\right -Asin \left{(\omega t+\phi + \tau)}\right \mathrm{d}t}{\int_{-\infty}^{\infty}{-Asin}^2\left{(\omega t+\phi)}\right\mathrm{d}t}}
Failed to parse (syntax error): {\displaystyle C\left(\tau\right) = \frac{\int_{-\infty}^{\infty} sin(\omega t+\phi)(sin(wt+\phi)cos(w\tau)+cos(\omega t+\phi)sin(\omega \tau))\mathrm{d}t}{\int_{-\infty}^{\infty}{-Asin}^2\left{(\omega t+\phi)}\right\mathrm{d}t}}
Failed to parse (syntax error): {\displaystyle C\left(\tau\right) = \frac{\int_{-\infty}^{\infty} sin(\omega t+\phi)(sin(\omega t+\phi)cos(\omega \tau)+cos(wt+\phi)sin(\omega \tau))\mathrm{d}t}{\int_{-\infty}^{\infty}{sin}^2\left({\omega t+\phi})\right\mathrm{d}t}}
Failed to parse (syntax error): {\displaystyle C\left(\tau\right) = \frac{\int_{-\infty}^{\infty} sin(\omega t+\phi)^2 cos(\omega \tau)+ {\int_{-\infty}^{\infty} cos(\omega t+\phi)sin(\omega t+\phi))\mathrm{d}t}{\int_{-\infty}^{\infty}{-Asin}^2\left({\omega t+\phi})\right\mathrm{d}t}}
Diffusion coefficient is related to velocity autocorrelation function by this equation: If the the area under the curve was calculated for the plotted VAFC and devided by 3, the diffusion coefficient would be obtained. However, the right data was not obtained due to a mathematical error and correct values of D could not be calculated.
References
- ↑ I. Klotz, R. Roseberg, Chemical Thermodynamics, Basic Theory and Methods, John Wiley & Sons, 2000
- ↑ P. Monk,Physical Chemistry: Understanding Our Chemical World, John Wiley & Sons, 2004
- ↑ Hansen, J.-P., & Verlet, L. (1969). Phase Transitions of the Lennard-Jones System. Phys. Rev., 184(1), 151–161. http://doi.org/10.1103/PhysRev.184.151


