Rep:Mod:Ttestpage
Module 2
BH3 molecules
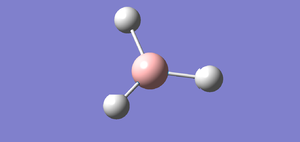
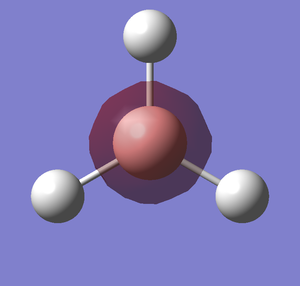
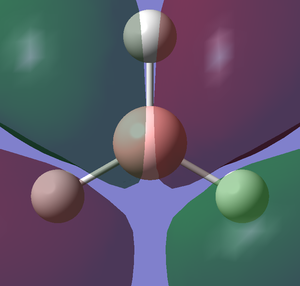
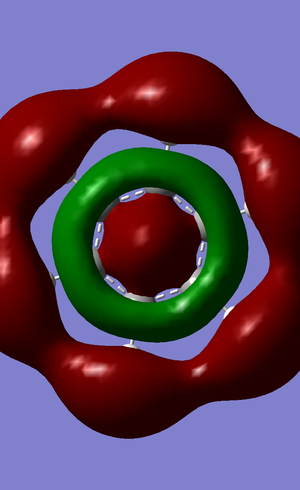
I created a molecule of BH3 with the B-H bond distance of 1.5 angstrom using GaussView 5.0. Then, I optimised the BH3 molecule using optimisation as Job Type, B3LYP as the method and 3-21G as the basis set. In optimisation, we try to solve for the position of nuclei in a molecule. The optimised molecules are the molecules which the nuclei are in a position such that it is in lowest energy. The method determines the type of approximations that are made in solving the Schrodinger equation and the basis set determines the accuracy. The optimised BH3 is shown below.
After optimisation,I found out that the bond distance for the BH3 molecule is 1.19453 Å and the bond angle H-B-H is 120.00. A summary of BH3 optimisation is shown below.

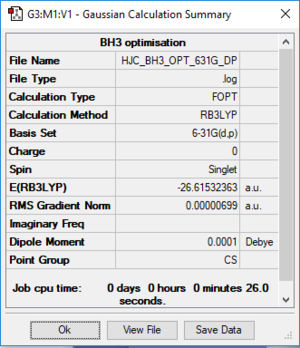
How can I know that is the molecule optimised? First we can check the gradient in the summary above. The gradient should be close to zero(less than 0.001). We can even check it from the file output(text based .log file). Almost at the end of the file, check that it is converged. Below I have uploaded the file output.
           Item               Value     Threshold  Converged?
 Maximum Force            0.000413     0.000450     YES
 RMS     Force            0.000271     0.000300     YES
 Maximum Displacement     0.001610     0.001800     YES
 RMS     Displacement     0.001054     0.001200     YES
 Predicted change in Energy=-1.071764D-06
 Optimization completed.
    -- Stationary point found.
The two graphs below show how the energy and gradient have changed over the optimisation.


A Better Basis Set
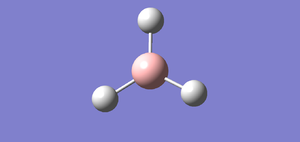
For this section I will be using a different basis set to optimise the structure. Open the 3-21G optimised log file and use 6-31G(d,p) as a basis set. An additional keyword "nosymm" is added to switch off the symmetry. This basis set is more accurate than 3-21G so we can obtain more accurate structure. With this basis set, the bond distance I obtained for this optimised molecule is 1.19232 Å and the bond angle is 120.00. An image and the summary of an optimised BH3 is shown below.
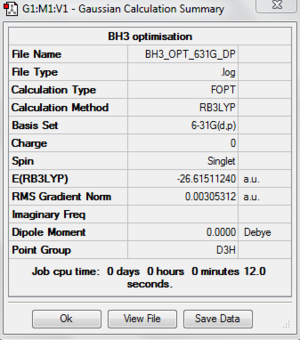
The following file and table are just to check whether the molecule is optimised.
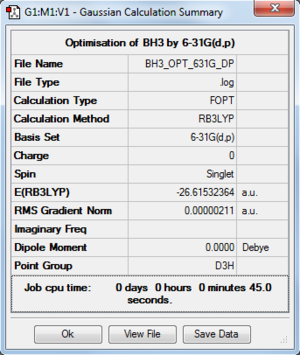
Item               Value     Threshold  Converged?
 Maximum Force            0.000006     0.000450     YES
 RMS     Force            0.000004     0.000300     YES
 Maximum Displacement     0.000024     0.001800     YES
 RMS     Displacement     0.000015     0.001200     YES
 Predicted change in Energy=-1.980661D-10
 Optimization completed.
    -- Stationary point found.

The total energy I obtained for the 3-21G optimised structure is -26.46226433 au. For the 6-31G(d,p), the total energy I obtained is -26.61511240 au. 6-31G(d,p) basis set obtained a lower energy but it doesn't mean that the computation is better. The energy difference is 0.15284807 au. The energy difference seems very small but it isn't small because when we convert into kj/mol the energy difference will be 401 kj/mol(0.15284807*2625.50). We never compare the energy of the structures computed using basis set.
Frequncy Analysis
The frequency analysis is the second derivative of the PES. It can check whether the optimised molecule is a transition state or a ground state. It can also provides the IR and the Raman modes.
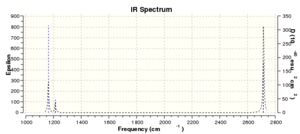
For the calculation, we are now choosing the frequency instead of optimisation. After submitting the calculation, the summary and frequency analysis is shown below.
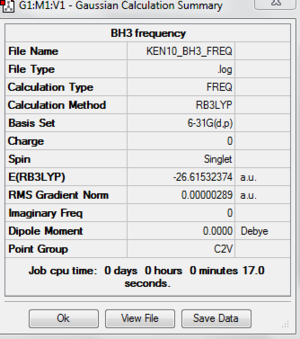
File:KEN10 BH3 FREQ.LOG Again, in order to check the molecule is fully optimised, I have attached the "item" table to make sure that it is converged.
 Item               Value     Threshold  Converged?
 Maximum Force            0.000006     0.000450     YES
 RMS     Force            0.000003     0.000300     YES
 Maximum Displacement     0.000024     0.001800     YES
 RMS     Displacement     0.000011     0.001200     YES
 Predicted change in Energy=-1.970486D-10
 Optimization completed.
    -- Stationary point found.
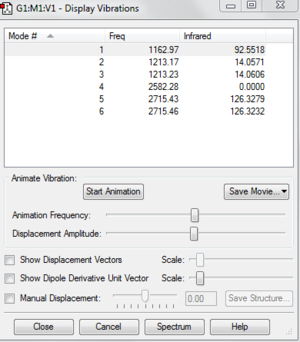
The following data is the data I have taken from the real output for this file.
Low frequencies ---  -19.0010    0.0007    0.0009    0.0009   12.0258   12.0968
 Low frequencies --- 1162.9746 1213.1729 1213.2338
 Harmonic frequencies (cm**-1), IR intensities (KM/Mole), Raman scattering
 activities (A**4/AMU), depolarization ratios for plane and unpolarized
 incident light, reduced masses (AMU), force constants (mDyne/A),
 and normal coordinates:
                     1                      2                      3
                     A                      A                      A
 Frequencies --  1162.9746              1213.1729              1213.2338
 Red. masses --     1.2531                 1.1072                 1.1072
 Frc consts  --     0.9986                 0.9601                 0.9602
 IR Inten    --    92.5518                14.0571                14.0606
  Atom  AN      X      Y      Z        X      Y      Z        X      Y      Z
     1   5     0.00   0.00   0.16     0.00   0.10   0.00    -0.10   0.00   0.00
     2   1     0.00   0.00  -0.57     0.00   0.08   0.00     0.81   0.00   0.00
     3   1     0.00   0.00  -0.57     0.39  -0.59   0.00     0.14  -0.39   0.00
     4   1     0.00   0.00  -0.57    -0.39  -0.59   0.00     0.14   0.39   0.00
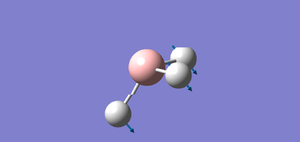
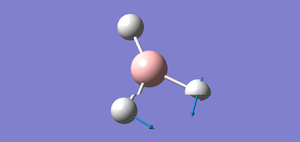
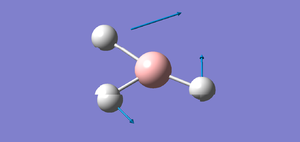
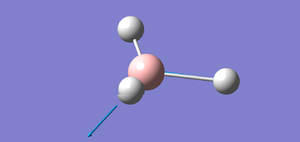
The 6 frequencies are the motions of the centre of mass of the molecules. We can see that four of the frequencies are close to zero and the other two frequencies are around 12 cm-1. The largest zero frequency is about 12 cm-1 which is still acceptable because the vibrational frequency is very large compared to the smallest of the low frequency. These indicate that the stationary point has been found. The better the method is used, the closer the frequencies towards zero.
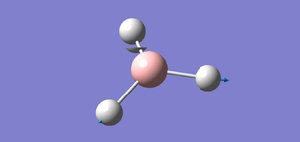
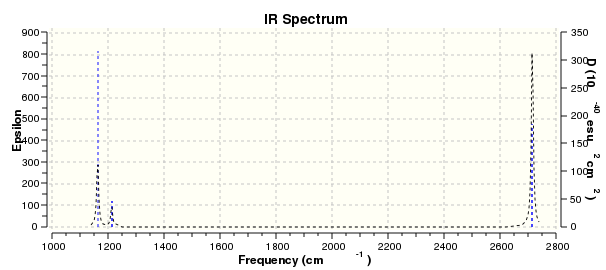
There are six vibrations of molecule but there are only three peaks(1162.97 cm-1,1213.23 cm-1,2715.46 cm-1) shown in the spectrum. The reason is there are three form of vibrations that are symmetry so there is no change in dipole moment and IR can only detect the molecule with the change in dipole moments. Therefore IR cannot detect the other three vibrations.
Molecular Orbitals
For molecular orbital, we use .chk file instead of .log file. There are a few changes in the calculation. First, the method is now set to energy instead of optimisation and "pop=full" has to be added into the keyword section. In the NBO tab, we have to select "Full NBO".
DOI:10042/to-http://hdl.handle.net/10042/20905
File:Bh3 mo.chk
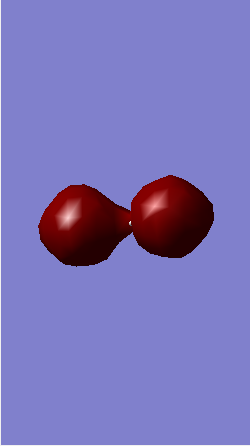
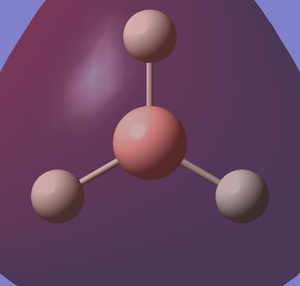
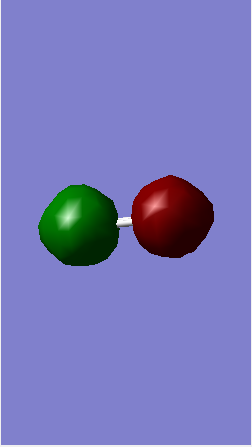
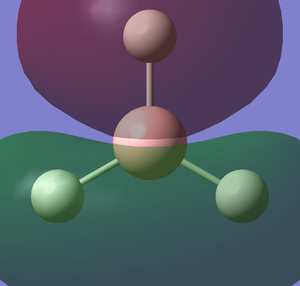
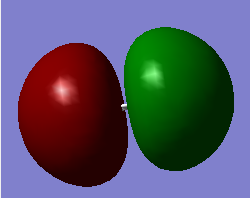
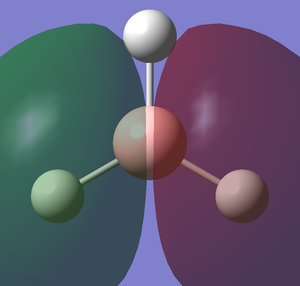
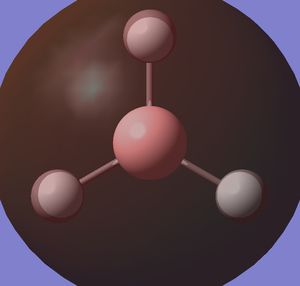
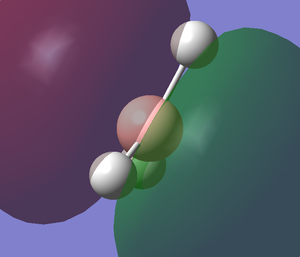
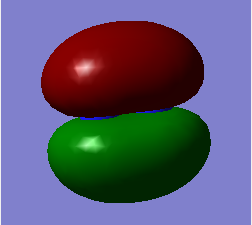
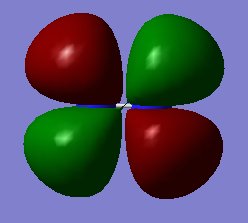
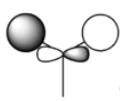
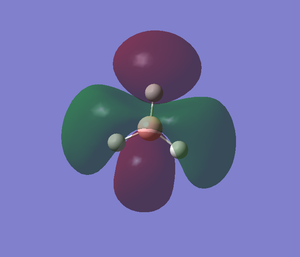
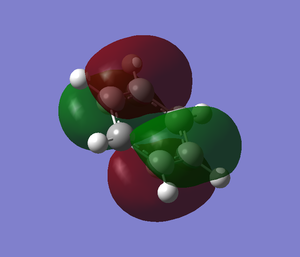
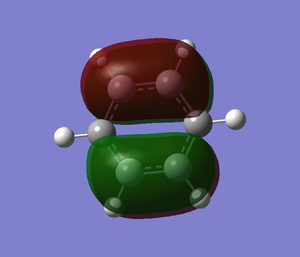
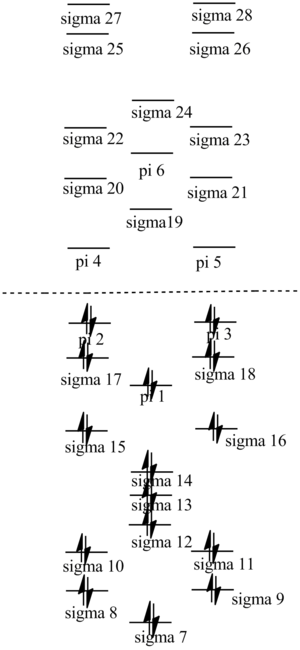
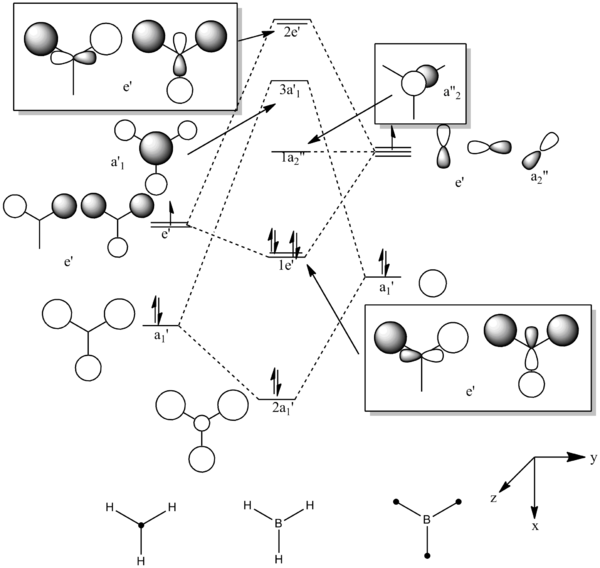 The molecular orbitals from number 1-8 are visualised. The molecular orbital diagram of LCAO for BH3 is shown below and we can compare the real MO and LCAO diagram. Due to some technical error, the table is shifted to under the "Comparison" section.
TlBr3
Optimisation
A molecule of TlBr3 is created using Gaussview 5.0.It is optimised by using B3LYP as the method and a medium level of basis set LanL2DZ. The calculation is done on the SCAN(Supercomputer at Night) system. The following is the summary of optimised TlBr3 molecule. The bond distance of an optimised TlBr3 is 2.65 angstrom and the bond angle Br-Tl-Br is 1200. The literature value for TlBr3 is 2.564 angstrom.
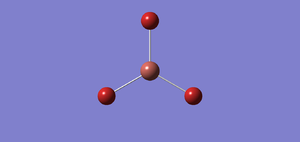
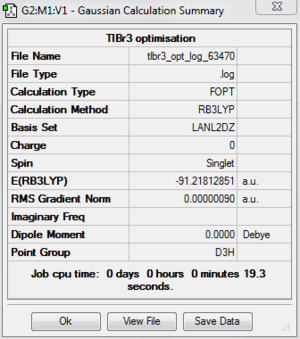
File:Tlbr3 opt log 63470.out DOI:10042/to-http://hdl.handle.net/10042/20857
The following table is just to confirm that the molecule is fully optimised.
Item               Value     Threshold  Converged?
 Maximum Force            0.000002     0.000450     YES
 RMS     Force            0.000001     0.000300     YES
 Maximum Displacement     0.000022     0.001800     YES
 RMS     Displacement     0.000014     0.001200     YES
 Predicted change in Energy=-6.084041D-11
 Optimization completed.
    -- Stationary point found.
Frequency Analysis
The frequency analysis also is done on the SCAN system. The following is the summary of the frequency analysis. File:Tlbr3 freq.tif File:Tlbr3 freq log 63473.out
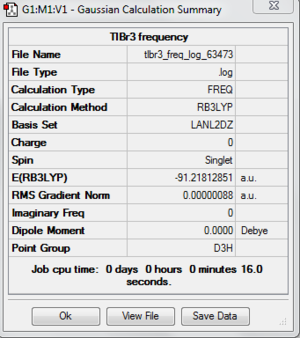
DOI:10042/to-http://hdl.handle.net/10042/20858
The table below is taken form the .log file and it is to prove that the molecule is fully optimised.
 Item               Value     Threshold  Converged?
 Maximum Force            0.000002     0.000450     YES
 RMS     Force            0.000001     0.000300     YES
 Maximum Displacement     0.000022     0.001800     YES
 RMS     Displacement     0.000011     0.001200     YES
 Predicted change in Energy=-5.660901D-11
 Optimization completed.
    -- Stationary point found.
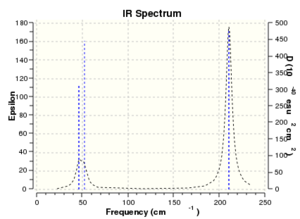
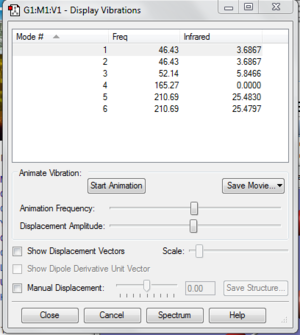
The six zero frequency are roughly around zero. The largest low frequency is at around four and the smallest vibrational frequency is at around 46 cm-1. The error is around 10% which may due to we use a harmonic approximation for vibrations that are actually anharmonic..
Low frequencies ---   -3.4213   -0.0026   -0.0004    0.0015    3.9367    3.9367
 Low frequencies ---   46.4289   46.4292   52.1449
 Harmonic frequencies (cm**-1), IR intensities (KM/Mole), Raman scattering
 activities (A**4/AMU), depolarization ratios for plane and unpolarized
 incident light, reduced masses (AMU), force constants (mDyne/A),
 and normal coordinates:
                     1                      2                      3
                    E'                     E'                     A2"
 Frequencies --    46.4289                46.4292                52.1449
 Red. masses --    88.4613                88.4613               117.7209
 Frc consts  --     0.1124                 0.1124                 0.1886
 IR Inten    --     3.6867                 3.6867                 5.8466
BBr3
A heavy atom cannot be recovered by the Schrodinger equation but we can recover some of these effects by using pseudo-potential. A pseudo-potential is a function which we can model the core of a heavy atom. For this reason, we are using pseudo-potential for Br atoms.
A BBr3 is created and it is optimised by using the basis set of GEN. This switches on the option to specify the basis set for each individual atom. Then, we save the file but do not submit the calculation. We need to specify the pseudo-potential for the Br atoms by editing the input file. After editing the input file, BBr3 can be optimised. I found out that the bond distance for optimised BBr3 is 1.93397 Å. The bond angle for optimised BBr3 is 120.00. The following are the image of optimised molecule and the output file.
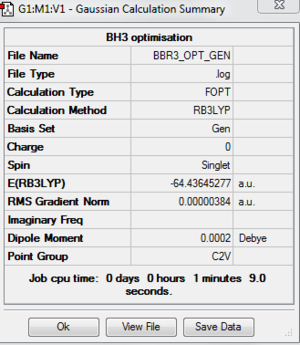
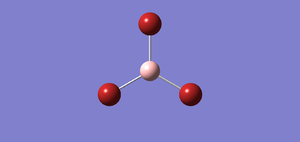
The following table shows that the molecule is fully optimised because it is all onverged. File:BBR3 OPT GEN.LOG
Item               Value     Threshold  Converged?
Maximum Force            0.000008     0.000450     YES
RMS     Force            0.000005     0.000300     YES
Maximum Displacement     0.000036     0.001800     YES
RMS     Displacement     0.000024     0.001200     YES
Predicted change in Energy=-4.098023D-10
Optimization completed.
-- Stationary point found.
Comparison
Bond Distance
| Molecule | Bond distance/ angstrom |
|---|---|
| BH3 | 1.19 |
| BBr3 | 1.93 |
| TlBr3 | 2.65 |
BH3 and BBr3 have incomplete octet and they are Lewis acid. Unlike Br atom, hydrogen atom does not have lone pair of electrons. The lone pair of electron from Br atom forms pi bonding with the vacant p orbital of B atom.Thus the electron deficient is partially removed by the B-Br pi bonding causes the partial occupation of the vacant p orbital on the B atom by electrons donated by the Br atom. It causes BBr3 is a weaker Lewis acid than BH3 and the bond distance to be shorter.
There is one more thing we need to consider when we talk about bond distance, that is the size of the ligand. Obviously, the size of Br atom is much more larger than the size of H atom. Br atom is more diffuse compared to H atom. The overlapping of orbitals between B and H is better than B and Br so B-H is a stronger bond then B-Br. Since the definition of the bond distance is the average distance between nuclei of two bonded atom in a molecule, the bond distance of BBr3 is larger than the bond distance of BH3. The size of the atom actually has a stronger effect on bond distance compared to the factor contributed by the Lewis acid.
B and Tl are from the same group which is Group 13. Boron is a nonmetal and thalium is a metal. The oxidation state of boron is +3 while for thalium is +1 and +3. Due to inert pair effect, Tl is more likely to form Tl(I). The size of Tl is larger so the bond distance is definitely larger.
Comparing Vibrational Frequencies of BH3 and TlBr3

| Compounds | Vibrational Frequency/cm-1 |
|---|---|
| BH3 | 1162.97, 1213.17, 1213.23, 2582.28, 2715.43, 2715.46 |
| TlBr3 | 46.43, 46.43, 52.14,165.27, 210.69, 210.69 |
There is a large difference in the vibrational frequencies for BH3 and TlBr3 because the mass of TlBr3 is larger than BH3. Vibrational frequency is inversely proportional to square root of mass. Therefore when the mass is larger, the vibrational frequncy will become smaller and this applies to BH3.
There are some similarities in the two IR spectra. Both of the spectra have three peaks. There are 4 vibrational modes which are present in both molecules. For both spectra, there are two modes lie very close together. In the higher vibrational frequency, it involves the assymetrical stretches and assymetrical stretches normally have higher frequency. In lower vibrational frequency, the stretches involved are in the same plane. The vibrational frequencies are so close may because there are a lot of similarity in vibrational mode causes the frequencies to be similar.
Questions
In some structure gaussview does not draw in the bonds where we expect, does this mean there is no bond? Why? It happens because Gaussview defines a particular bond by distance. This means that when two atoms are within a range of distance, the program will show the bond. However, if for some reason, the two atom are separated outside the range that is defined by the program, Gaussview will not show the bond. But it does not mean that there is no bond present between two atoms.
What is a bond? A bond exists when there is an attarction between two atoms and causing the electron density is being shared.. The sharing of electron density is because each nucleus look for a full outer shell of electrons.
Why must you use the same method and basis set for both the optimisation and frquency analysis calculation? The reason that we use the same method and basis set for optimisation and frequency analysis calculation is because the energy of the optimised structure depends on the method and basis set of calculation. By using the same method and basis set, we can compare the energy of different molecules.
What is the purpose of carrying out a frequency analysis? The frequency analysis is the second derivatives of the PES. If the frequency is positive, it means that the energy of optimised structure is minimum. If the frequency is negative, the energy of the structure is maximum and that means we have found the transition structure which is not fully optimised. Besides that, frequency analysis can help us to obtain IR spectrum and Raman modes to compare with the experiment.
What do the "Low frequencies" represent? The "Low Frequencies" are the motion of the centre of mass of molecule. It should be much smaller than the vibrational frequency. If the largest "zero" frequency is in an order of magnitude smaller than the vibrational frequency, the optimisation normally is successful.
NH3
Optimisation
NH3 molecule is optimised by using optimisation as Job Type, B3LYP as the method and basis set of 6-31(d,p). It is a small molecule so we can go straight into a higher basis set. The following are the optimised molecule and the summary of the optimisation.

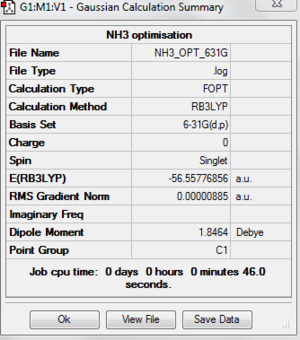
The following table is to check whether the molecule is fully optimised.
Item               Value     Threshold  Converged?
 Maximum Force            0.000024     0.000450     YES
 RMS     Force            0.000012     0.000300     YES
 Maximum Displacement     0.000079     0.001800     YES
 RMS     Displacement     0.000053     0.001200     YES
 Predicted change in Energy=-1.629727D-09
 Optimization completed.
    -- Stationary point found.
Frequency Analysis
The frequency analysis is carried out and the following is the results have obtained. File:NH3 FREQ.LOG
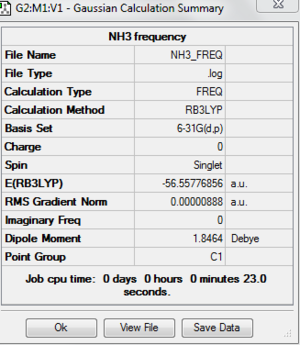
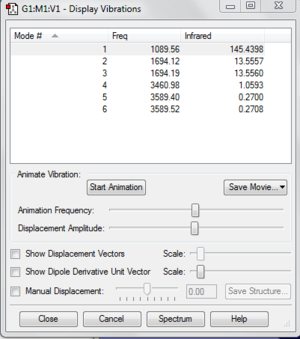
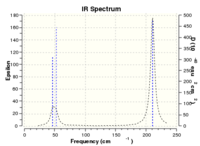 The following table shows that the molecule is fully optimised because it is converged.
 Item               Value     Threshold  Converged?
 Maximum Force            0.000021     0.000450     YES
 RMS     Force            0.000009     0.000300     YES
 Maximum Displacement     0.000077     0.001800     YES
 RMS     Displacement     0.000039     0.001200     YES
 Predicted change in Energy=-1.603126D-09
 Optimization completed.
    -- Stationary point found.
The lowest vibrational frequency is so much larger than the largest low frequency which is at around 28 cm-1. The error for this is only about 3% which is because we use a harmonic approximation for vibrations that are actually anharmonic.
 Low frequencies ---  -30.7764   -0.0017   -0.0008    0.0012   20.3142   28.2484
 Low frequencies --- 1089.5557 1694.1237 1694.1868
 Harmonic frequencies (cm**-1), IR intensities (KM/Mole), Raman scattering
 activities (A**4/AMU), depolarization ratios for plane and unpolarized
 incident light, reduced masses (AMU), force constants (mDyne/A),
 and normal coordinates:
                     1                      2                      3
                     A                      A                      A
 Frequencies --  1089.5557              1694.1237              1694.1868
 Red. masses --     1.1800                 1.0644                 1.0644
 Frc consts  --     0.8253                 1.8000                 1.8001
 IR Inten    --   145.4398                13.5557                13.5560
Molecular Orbital
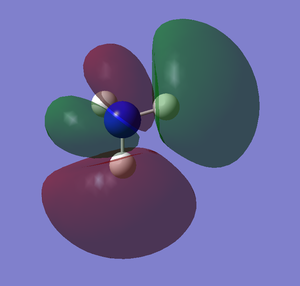
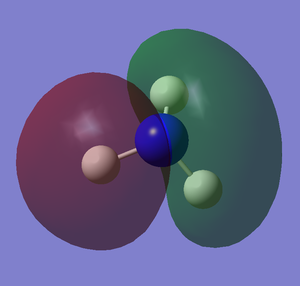
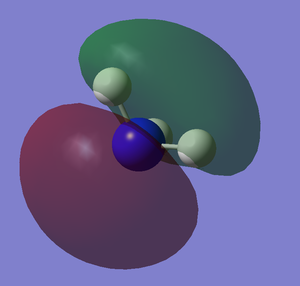
The .chk file is opened instead of log file and the Job Type is switched to Energy. Make sure under the NBO tab, "Fully NBO" is selected. The MO diagram can be seen by clicking the edit and then click "MO". Due to some technical error, the table for the MO of NH3 is under the MO of benzene.

File:Nh3 mo.chk File:NH3 MO.LOG
NBO
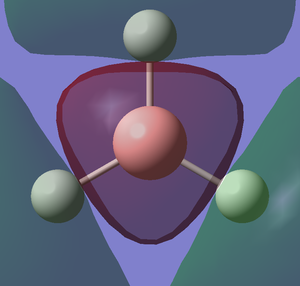
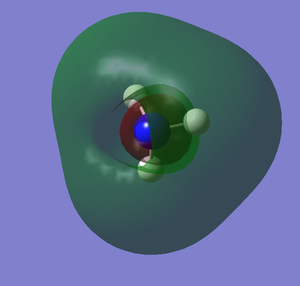
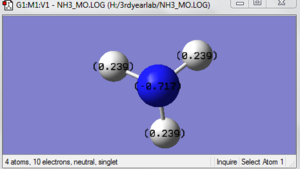
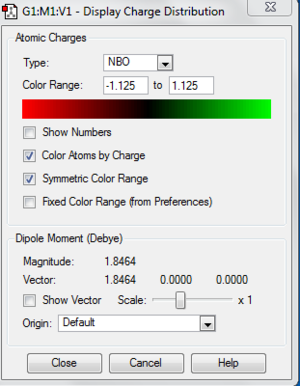
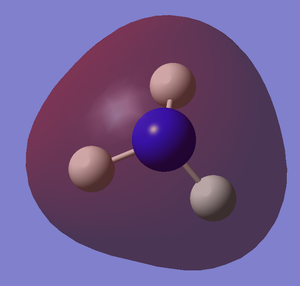
The images below shows the charge distribution of the molecule. The bright green indicates positive charge and the red is negative charge.
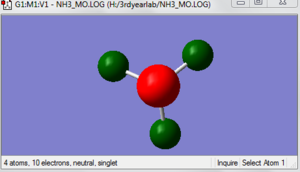
Under the "Natural Charge" in the following table, it is the charge distribution that is present in the molecule showing in the image below.
Summary of Natural Population Analysis:

                                       Natural Population
                Natural  -----------------------------------------------
    Atom  No    Charge         Core      Valence    Rydberg      Total
 -----------------------------------------------------------------------
      N    1   -1.12515      1.99982     6.11104    0.01429     8.12515
      H    2    0.37505      0.00000     0.62250    0.00246     0.62495
      H    3    0.37505      0.00000     0.62250    0.00246     0.62495
      H    4    0.37505      0.00000     0.62249    0.00246     0.62495
 =======================================================================
   * Total *    0.00000      1.99982     7.97852    0.02166    10.00000
The first bond shows that 69% of the bond is contributed by nitrogen atom and 31% of the bond is contributed by the hydrogen atom. Within the nitrogen atom, there are a hybridisation of 25% of s orbitals and 75% of p orbitals. For hydrogen orbital, 100% are s orbital. It means that nitrogen atom are sp3 hybridised to the hydrogen atom which has s atomic orbital. In orbital 4 in the table is the core(CR) for the 1s atomic orbital of nitrogen. In orbital 5, there is a lone pair(LP) with 25% of s and 75% of p orbital. It means that nitrogen atom are sp3 hybridised to the lone pair of electrons.
(Occupancy)   Bond orbital/ Coefficients/ Hybrids
 ---------------------------------------------------------------------------------
     1. (1.99909) BD ( 1) N   1 - H   2
                ( 68.83%)   0.8297* N   1 s( 24.87%)p 3.02( 75.05%)d 0.00(  0.09%)
                                           -0.0001 -0.4986 -0.0059  0.0000 -0.2910
                                            0.0052  0.8155  0.0277  0.0000  0.0000
                                            0.0281  0.0000  0.0000  0.0032  0.0082
                ( 31.17%)   0.5583* H   2 s( 99.91%)p 0.00(  0.09%)
                                           -0.9996  0.0000  0.0072 -0.0289  0.0000
     2. (1.99909) BD ( 1) N   1 - H   3
                ( 68.83%)   0.8297* N   1 s( 24.86%)p 3.02( 75.05%)d 0.00(  0.09%)
                                            0.0001  0.4986  0.0059  0.0000  0.2910
                                           -0.0052  0.4077  0.0138  0.7062  0.0240
                                            0.0140  0.0243  0.0076  0.0033  0.0031
                ( 31.17%)   0.5583* H   3 s( 99.91%)p 0.00(  0.09%)
                                            0.9996  0.0000 -0.0072 -0.0145 -0.0250
     3. (1.99909) BD ( 1) N   1 - H   4
                ( 68.83%)   0.8297* N   1 s( 24.87%)p 3.02( 75.05%)d 0.00(  0.09%)
                                            0.0001  0.4986  0.0059  0.0000  0.2909
                                           -0.0052  0.4077  0.0138 -0.7062 -0.0239
                                            0.0140 -0.0243 -0.0076  0.0033  0.0031
                ( 31.17%)   0.5583* H   4 s( 99.91%)p 0.00(  0.09%)
                                            0.9996  0.0000 -0.0072 -0.0145  0.0250
     4. (1.99982) CR ( 1) N   1           s(100.00%)
                                            1.0000 -0.0002  0.0000  0.0000  0.0000
                                            0.0000  0.0000  0.0000  0.0000  0.0000
                                            0.0000  0.0000  0.0000  0.0000  0.0000
     5. (1.99721) LP ( 1) N   1           s( 25.38%)p 2.94( 74.52%)d 0.00(  0.10%)
                                            0.0001  0.5036 -0.0120  0.0000 -0.8618
                                            0.0505  0.0000  0.0000  0.0000  0.0000
                                            0.0000  0.0000  0.0000 -0.0269  0.0155
It doesn't have much information about NH3. It will only be interesting when there is any value that is larger than 20 kcal/mol in E(2) column.
     Threshold for printing:   0.50 kcal/mol
                                                                              E(2)  E(j)-E(i) F(i,j)
         Donor NBO (i)                     Acceptor NBO (j)                 kcal/mol   a.u.    a.u.
 ===================================================================================================
The following table shows that the N-H bond are at the same energy(-0.60417). The lone pair is higher in energy while the core orbital is very low in energy.
Natural Bond Orbitals (Summary):

                                                            Principal Delocalizations
           NBO                        Occupancy    Energy   (geminal,vicinal,remote)
 ====================================================================================
 Molecular unit  1  (H3N)
     1. BD (   1) N   1 - H   2          1.99909    -0.60417
     2. BD (   1) N   1 - H   3          1.99909    -0.60417
     3. BD (   1) N   1 - H   4          1.99909    -0.60416
     4. CR (   1) N   1                  1.99982   -14.16768
     5. LP (   1) N   1                  1.99721    -0.31756  24
NH3BH3
Optimisation
For this molecule, we want to compute the reaction energy of the reactants and product. The reactants have already been computed in the above but we have to make sure that we need to use the same basis set. NH3 is drawn in Gaussview and optimised by using the same basis set, 6-31(d,p) as in NH3 and BH3. File:Nh3bh3 opt.tif File:NH3BH3 OPT.LOG
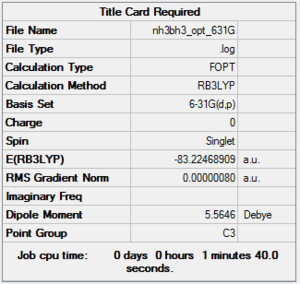
The following table is used to determine whether the molecule is optimised. In this case, it is converged and thus the molecule is optimised.
Item               Value     Threshold  Converged?
 Maximum Force            0.000119     0.000450     YES
 RMS     Force            0.000043     0.000300     YES
 Maximum Displacement     0.001195     0.001800     YES
 RMS     Displacement     0.000428     0.001200     YES
 Predicted change in Energy=-1.677633D-07
 Optimization completed.
    -- Stationary point found.
Frequency Analysis
Frequency analysis is carried out by changing the Job Type from optimisation into frequency. File:NH3BH3 FREQ.LOG
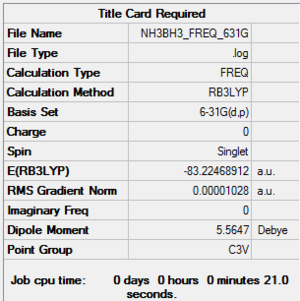
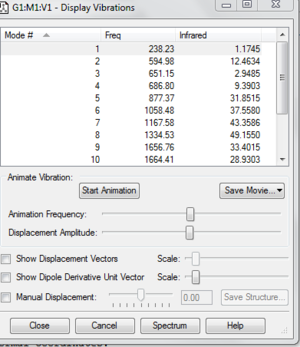
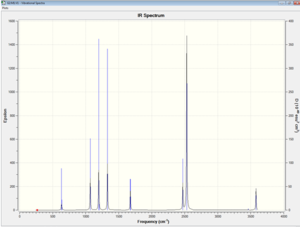
The table below shows the largest low frequency is about 10 % of the vibrational frequency because we use a harmonic approximation for vibrations that are actually anharmonic. The image on the left shows that there is no negative frequency present.
Low frequencies ---  -17.9944   -0.0012   -0.0011   -0.0009   17.3973   26.1787
 Low frequencies ---  238.2374  594.9849  651.1517
 Harmonic frequencies (cm**-1), IR intensities (KM/Mole), Raman scattering
 activities (A**4/AMU), depolarization ratios for plane and unpolarized
 incident light, reduced masses (AMU), force constants (mDyne/A),
 and normal coordinates:
                     1                      2                      3
                     A                      A                      A
 Frequencies --   238.2257               594.9845               651.1511
 Red. masses --     1.0171                 1.2620                 1.0360
 Frc consts  --     0.0340                 0.2632                 0.2588
 IR Inten    --     1.1745                12.4634                 2.9485
Item               Value     Threshold  Converged?
 Maximum Force            0.000140     0.000450     YES
 RMS     Force            0.000052     0.000300     YES
 Maximum Displacement     0.001184     0.001800     YES
 RMS     Displacement     0.000468     0.001200     YES
 Predicted change in Energy=-1.927626D-07
 Optimization completed.
    -- Stationary point found.
Energy Difference
E(BH3-NH3)= -82.54945 au E(BH3)= -26.38297 au E(NH3)= -56.55777 au
ΔE=E(NH3BH3)-[E(NH3)+E(BH3)]
 = -82.54945 au -{-26.38297 au + (-56.55777 au)}
 = -82.54945 au -(-82.9407 au)
 = 0.39125 au
 = 1027 kj/mol
Mini Project: Investigating Aromaticity
Benzene
Optimisation
A benzene ring is created in Gaussview and it is optimised by using basis set of 6-31G(d,p) on the SCAN system. The following table shows that the molecule is fully optimised. File:Benzene opt log 63482.out
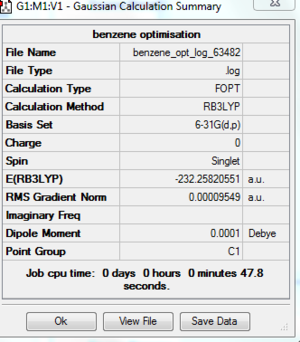
DOI:10042/to-http://hdl.handle.net/10042/20919
Item               Value     Threshold  Converged?
 Maximum Force            0.000212     0.000450     YES
 RMS     Force            0.000085     0.000300     YES
 Maximum Displacement     0.001099     0.001800     YES
 RMS     Displacement     0.000330     0.001200     YES
 Predicted change in Energy=-5.196761D-07
 Optimization completed.
    -- Stationary point found.
Frequency Analysis
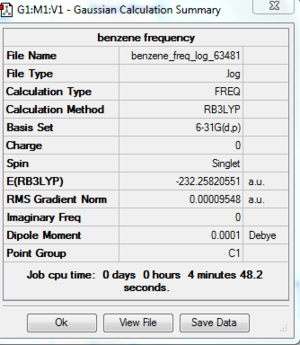
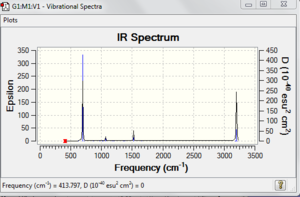
A frequency analysis is carried out by changing the job type into frequency. The six "zero" frequency shows are very close to zero. File:Benzene freq log 63481.out
[[File:Benzene vibration.PNG|thumb]centre]
DOI:10042/to-http://hdl.handle.net/10042/20922
The low frequencies are very low compared to the vibrational frequency. The low frequency is about 4% of the vibrational frequency and this error is mainly because of the method and basis set we used and we use a harmonic approximation for vibrations that are actually anharmonic..
Low frequencies ---  -17.2805  -14.5878   -9.6572   -0.0001    0.0005    0.0006
 Low frequencies ---  413.7971  414.4695  620.8545
 Harmonic frequencies (cm**-1), IR intensities (KM/Mole), Raman scattering
 activities (A**4/AMU), depolarization ratios for plane and unpolarized
 incident light, reduced masses (AMU), force constants (mDyne/A),
 and normal coordinates:
                     1                      2                      3
                     A                      A                      A
 Frequencies --   413.7971               414.4695               620.8540
 Red. masses --     2.9404                 2.9434                 6.0705
 Frc consts  --     0.2966                 0.2979                 1.3786
 IR Inten    --     0.0000                 0.0000                 0.0000
The following table is just to shows that the molecule is fully converged.
 Item               Value     Threshold  Converged?
 Maximum Force            0.000195     0.000450     YES
 RMS     Force            0.000095     0.000300     YES
 Maximum Displacement     0.001064     0.001800     YES
 RMS     Displacement     0.000381     0.001200     YES
 Predicted change in Energy=-5.067015D-07
 Optimization completed.
    -- Stationary point found.
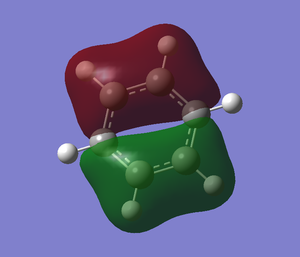
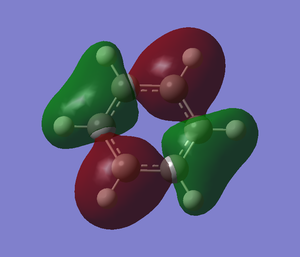
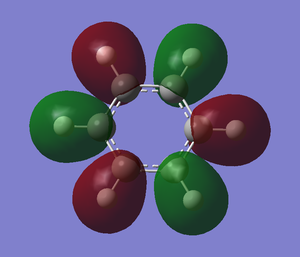
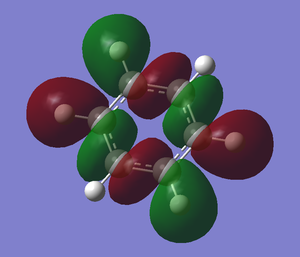
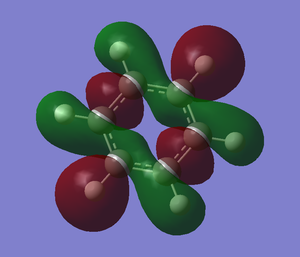
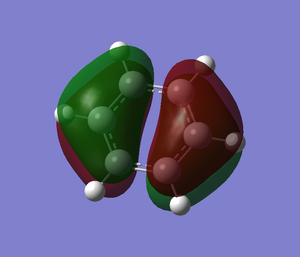
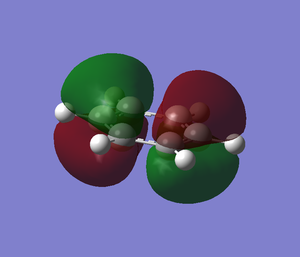
Molecular Orbital
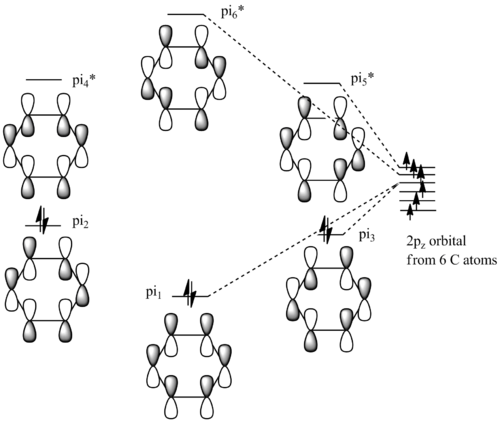
The .chk file is opened instead of log file and the Job Type is switched to Energy."pop=full" is added to the additional keyword. Make sure under the NBO tab, "Fully NBO" is selected.
 File:Benzene mo.chk
File:BENZENE MO.LOG

DOI:10042/to-http://hdl.handle.net/10042/20955
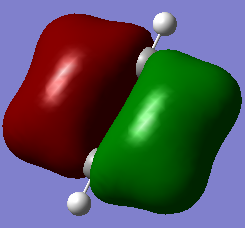
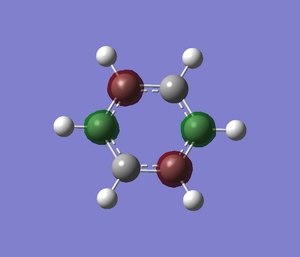
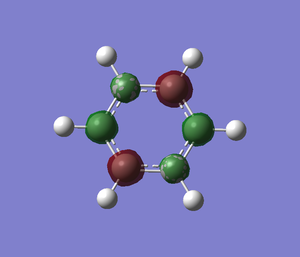
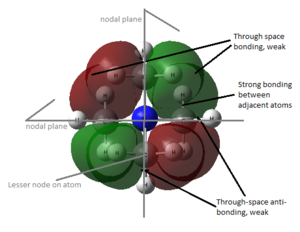
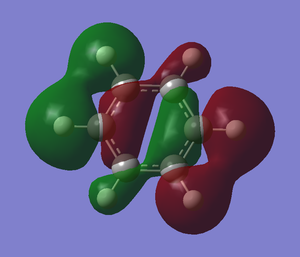
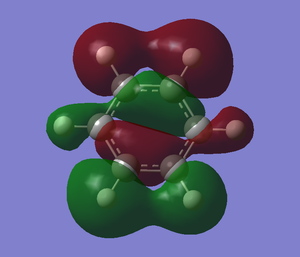
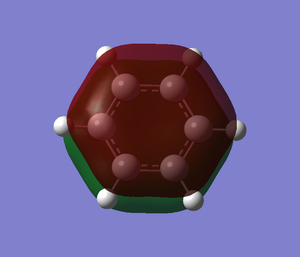
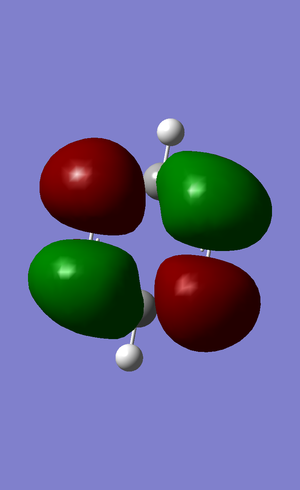
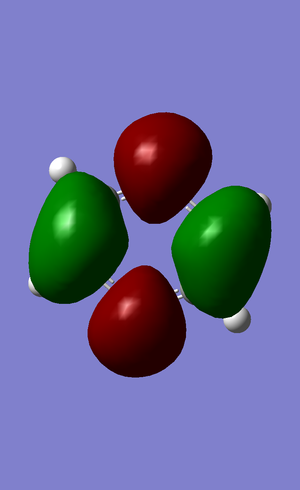
| no. | "Real" MO | "Real" MO | "Real" MO |
|---|---|---|---|
| 1 | 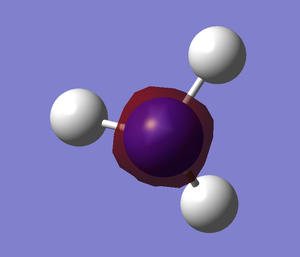 |
 |
 |
| 2 | 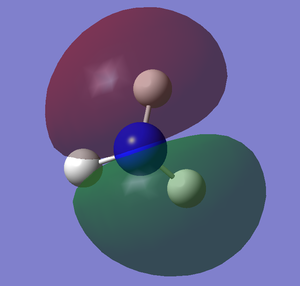 |
 |
NBO Analysis
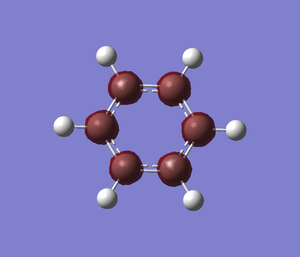
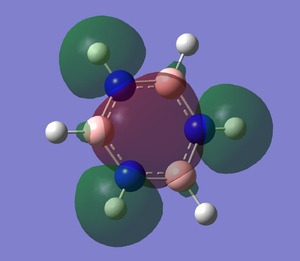
The .log file is opened and we can look at the charge distribution of the molecule in the image below.
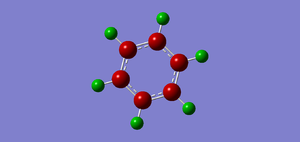

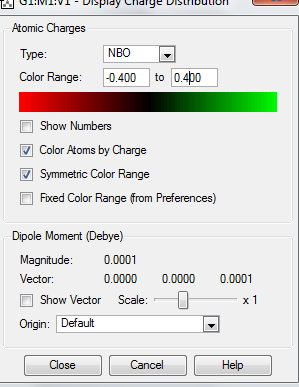
Table below shows the charge distribution of the molecule that is the same thing in the image given.
Summary of Natural Population Analysis:

                                       Natural Population
                Natural  -----------------------------------------------
    Atom  No    Charge         Core      Valence    Rydberg      Total
 -----------------------------------------------------------------------
      C    1   -0.23863      1.99910     4.22621    0.01331     6.23863
      C    2   -0.23865      1.99910     4.22623    0.01331     6.23865
      C    3   -0.23865      1.99910     4.22623    0.01331     6.23865
      C    4   -0.23863      1.99910     4.22621    0.01331     6.23863
      C    5   -0.23865      1.99910     4.22623    0.01331     6.23865
      C    6   -0.23865      1.99910     4.22623    0.01331     6.23865
      H    7    0.23864      0.00000     0.75992    0.00143     0.76136
      H    8    0.23864      0.00000     0.75993    0.00143     0.76136
      H    9    0.23865      0.00000     0.75992    0.00143     0.76135
      H   10    0.23864      0.00000     0.75992    0.00143     0.76136
      H   11    0.23864      0.00000     0.75993    0.00143     0.76136
      H   12    0.23865      0.00000     0.75992    0.00143     0.76135
 =======================================================================
   * Total *    0.00000     11.99462    29.91689    0.08849    42.00000
The first bond (BD) is between carbon and carbon atom and because they are the same atoms so they contribute equally to the bond. 65% of the bond is p orbital and 35% is from s orbital so it will form sp2 hybridize orbital.
(Occupancy)   Bond orbital/ Coefficients/ Hybrids
 ---------------------------------------------------------------------------------
     1. (1.98099) BD ( 1) C   1 - C   2
                ( 50.00%)   0.7071* C   1 s( 35.20%)p 1.84( 64.76%)d 0.00(  0.04%)
                                           -0.0001  0.5932 -0.0079  0.0006 -0.7505
                                           -0.0048 -0.2884 -0.0354 -0.0001  0.0000
                                            0.0092  0.0000  0.0000  0.0138 -0.0109
                ( 50.00%)   0.7071* C   2 s( 35.20%)p 1.84( 64.76%)d 0.00(  0.04%)
                                           -0.0001  0.5932 -0.0079  0.0006  0.7642
                                            0.0260  0.2496 -0.0244  0.0000  0.0000
                                            0.0116  0.0000  0.0000  0.0119 -0.0109
     2. (1.98100) BD ( 1) C   1 - C   6
                ( 50.00%)   0.7071* C   1 s( 35.21%)p 1.84( 64.75%)d 0.00(  0.04%)
                                           -0.0001  0.5933 -0.0079  0.0006  0.1660
                                            0.0342  0.7866  0.0103  0.0000  0.0000
                                            0.0045  0.0000  0.0000 -0.0160 -0.0109
                ( 50.00%)   0.7071* C   6 s( 35.21%)p 1.84( 64.76%)d 0.00(  0.04%)
                                           -0.0001  0.5933 -0.0079  0.0006 -0.1254
                                            0.0283 -0.7941 -0.0219  0.0000  0.0000
                                            0.0073  0.0000  0.0000 -0.0149 -0.0109
     3. (1.66532) BD ( 2) C   1 - C   6
                ( 50.00%)   0.7071* C   1 s(  0.00%)p 1.00( 99.96%)d 0.00(  0.04%)
                                            0.0000  0.0000  0.0000  0.0000 -0.0001
                                            0.0000  0.0000  0.0000  0.9997 -0.0133
                                            0.0000 -0.0067  0.0183  0.0000  0.0000
                ( 50.00%)   0.7071* C   6 s(  0.00%)p 1.00( 99.96%)d 0.00(  0.04%)
                                            0.0000  0.0000  0.0000  0.0000 -0.0001
                                            0.0000  0.0000  0.0000  0.9997 -0.0133
                                            0.0000 -0.0128 -0.0147  0.0000  0.0000
Nothing interesting here because there is nothing greater than 20 kcal/mol in E(2).
Second Order Perturbation Theory Analysis of Fock Matrix in NBO Basis

     Threshold for printing:   0.50 kcal/mol
                                                                              E(2)  E(j)-E(i) F(i,j)
         Donor NBO (i)                     Acceptor NBO (j)                 kcal/mol   a.u.    a.u.
 ===================================================================================================
All the bond has almost the same energy except the third one which has slightly higher in energy.
Natural Bond Orbitals (Summary):

                                                            Principal Delocalizations
           NBO                        Occupancy    Energy   (geminal,vicinal,remote)
 ====================================================================================
 Molecular unit  1  (C6H6)
     1. BD (   1) C   1 - C   2          1.98099    -0.68177  110(g),107(g),120(v),114(v)
                                                    43(v),73(v),109(g),112(g)
                                                    72(v),42(v)
     2. BD (   1) C   1 - C   6          1.98100    -0.68193  118(g),106(g),119(v),112(v)
                                                    63(v),33(v),120(g),109(g)
                                                    32(v),62(v)
     3. BD (   2) C   1 - C   6          1.66532    -0.23793  116(v),111(v),35(v),65(v)
     4. BD (   1) C   1 - H   7          1.98307    -0.51218  118(v),110(v),72(v),32(v)
                                                    107(g),106(g)
     5. BD (   1) C   2 - C   3          1.98100    -0.68195  106(g),113(g),117(v),109(v)
Pyridinium
Optimisation
A pyridinium is created in Gaussview and it is optimised by using basis set of 6-31G(d,p). File:Pyridinium opt log 63616.out
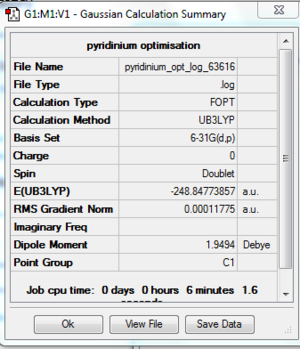
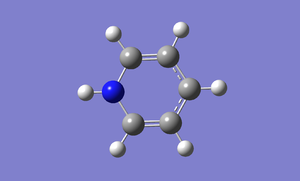
DOI:10042/to-http://hdl.handle.net/10042/20938
Item               Value     Threshold  Converged?
 Maximum Force            0.000220     0.000450     YES
 RMS     Force            0.000066     0.000300     YES
 Maximum Displacement     0.001512     0.001800     YES
 RMS     Displacement     0.000423     0.001200     YES
 Predicted change in Energy=-4.865873D-07
 Optimization completed.
    -- Stationary point found.
Frequency Analysis
The frequency analysis is carried out by changing the Job Type to frequency.
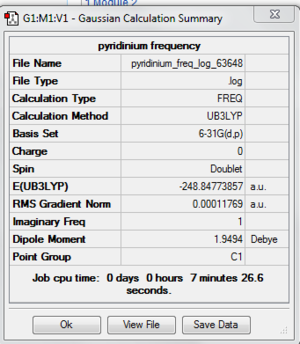
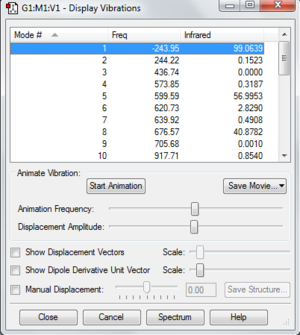
File:Pyridinium freq log 63648.out
DOI:10042/to-http://hdl.handle.net/10042/20940
As you can see from the table, the molecule is not optimised for some reasons.
 Item               Value     Threshold  Converged?
 Maximum Force            0.000483     0.000450     NO
 RMS     Force            0.000118     0.000300     YES
 Maximum Displacement     0.001802     0.001800     NO
 RMS     Displacement     0.000632     0.001200     YES
 Predicted change in Energy=-5.951194D-07
The table below clearly shows that there is one imaginary frequency which is a negative frequency. It shows that what I have found is transition state and not the optimised molecule with lowest energy.
Low frequencies --- -243.9513   -8.8159    0.0005    0.0009    0.0009   12.2824
 Low frequencies ---   18.2277  244.2221  436.7361
 ******    1 imaginary frequencies (negative Signs) ******
 Harmonic frequencies (cm**-1), IR intensities (KM/Mole), Raman scattering
 activities (A**4/AMU), depolarization ratios for plane and unpolarized
 incident light, reduced masses (AMU), force constants (mDyne/A),
 and normal coordinates:
                     1                      2                      3
                     A                      A                      A
 Frequencies --  -243.9480               244.2219               436.7361
 Red. masses --     1.4651                 1.9971                 3.4320
 Frc consts  --     0.0514                 0.0702                 0.3857
 IR Inten    --    99.0639                 0.1523                 0.0000
Molecular Orbital
The .chk file is opened instead of log file and the Job Type is switched to Energy."pop=full" is added to the additional keyword. Make sure under the NBO tab, "Fully NBO" is selected.

DOI:10042/to-http://hdl.handle.net/10042/20944
NBO Analysis
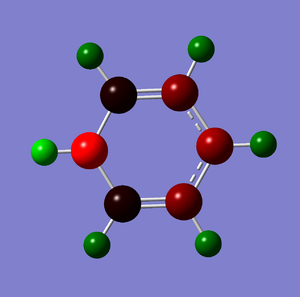
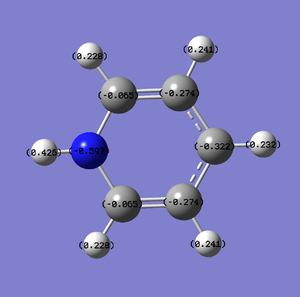
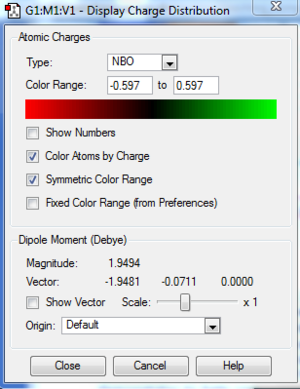
The following table summaries the charge distribution of ech atoms in the molecule which is the same as the image shown below.
Summary of Natural Population Analysis:

                                       Natural Population
                Natural  -----------------------------------------------
    Atom  No    Charge         Core      Valence    Rydberg      Total
 -----------------------------------------------------------------------
      C    1   -0.15651      0.99956     2.14577    0.01118     3.15651
      C    2   -0.08979      0.99955     2.08310    0.00714     3.08979
      C    3   -0.40059      0.99959     2.39101    0.00999     3.40059
      C    4   -0.08976      0.99955     2.08306    0.00714     3.08976
      C    5   -0.15656      0.99956     2.14583    0.01118     3.15656
      N    6   -0.42216      0.99972     2.91481    0.00763     3.92216
      H    7    0.12337      0.00000     0.37594    0.00069     0.37663
      H    8    0.11810      0.00000     0.38119    0.00070     0.38190
      H    9    0.11944      0.00000     0.37990    0.00066     0.38056
      H   10    0.11944      0.00000     0.37991    0.00066     0.38056
      H   11    0.11811      0.00000     0.38119    0.00070     0.38189
      H   12    0.21692      0.00000     0.28169    0.00139     0.28308
 =======================================================================
   * Total *   -0.50000      5.99753    15.94340    0.05907    22.00000
The following table summarises the bonding in the molecule. For example, 60% of the bonding is from the first carbon and 40% of the bonding is from the second carbon. The C-C bond are mainly contributed by p orbital because from the table we can see that p orbital contribute 99.95% to C-C bond. It is not like the benzene ring which have equal contribution from two carbon atoms due to the present of nitrogen atom in the ring. The lone pair of electrons in nitrogen is in p orbital which is shown in table below.
Occupancy)   Bond orbital/ Coefficients/ Hybrids
 ---------------------------------------------------------------------------------
     1. (0.99661) BD ( 1) C   1 - C   2
                ( 60.60%)   0.7784* C   1 s(  0.00%)p 1.00( 99.95%)d 0.00(  0.05%)
                                            0.0000 -0.0002  0.0000  0.0000 -0.0002
                                            0.0000  0.0002  0.0000  0.9990 -0.0374
                                            0.0000  0.0227 -0.0013  0.0000  0.0000
                ( 39.40%)   0.6277* C   2 s(  0.00%)p 1.00( 99.88%)d 0.00(  0.12%)
                                            0.0000 -0.0002  0.0000  0.0000  0.0003
                                            0.0000  0.0002  0.0000  0.9992 -0.0182
                                            0.0000 -0.0345 -0.0037  0.0000  0.0000
     2. (0.99148) BD ( 2) C   1 - C   2
                ( 50.27%)   0.7090* C   1 s( 40.25%)p 1.48( 59.71%)d 0.00(  0.03%)
                                            0.0000  0.6344 -0.0019  0.0039  0.7715
                                            0.0159  0.0304 -0.0280  0.0003  0.0000
                                            0.0055  0.0000  0.0000  0.0160 -0.0071
                ( 49.73%)   0.7052* C   2 s( 35.45%)p 1.82( 64.51%)d 0.00(  0.04%)
                                            0.0000  0.5953 -0.0124 -0.0002 -0.8018
                                           -0.0218 -0.0313 -0.0267  0.0004  0.0000
                                           -0.0014  0.0000  0.0000  0.0169 -0.0115
    21. (0.65536) LP ( 1) C   5           s(  0.00%)p 1.00( 99.97%)d 0.00(  0.03%)
                                            0.0000  0.0003  0.0000  0.0000  0.0003
                                            0.0000 -0.0001  0.0000 -0.9990  0.0398
                                            0.0000 -0.0185 -0.0013  0.0000  0.0000
    22. (0.94537) LP ( 1) N   6           s(  0.00%)p 1.00(100.00%)d 0.00(  0.00%)
                                            0.0000  0.0000  0.0000  0.0000  0.0000
                                            0.0000  0.0001  0.0000  0.9998 -0.0193
                                            0.0000 -0.0022 -0.0001  0.0000  0.0000
There is nothing interesting in Second Order Perturbation Theory Analysis of Fock Matrix in NBO Basis because there is nothiing that exceed 20 kcal/mol in E(2).
The table below summarises the bond orbitals in a molecule. The bonds have very different energy for example, the C-C bond in the first two rows are very different. The first one has -0.25947 au while the second one has -0.70711 au.
Natural Bond Orbitals (Summary):

                                                            Principal Delocalizations
           NBO                        Occupancy    Energy   (geminal,vicinal,remote)
 ====================================================================================
 Molecular unit  1  (C5H6N)
     1. BD (   1) C   1 - C   2          0.99661    -0.25947  114(v),73(v),43(v)
     2. BD (   2) C   1 - C   2          0.99148    -0.70711  111(g),120(v),115(v),110(g)
                                                    45(v),112(g),109(g),75(v)
                                                    44(v),74(v)
     3. BD (   1) C   1 - N   6          0.99431    -0.77560  112(v),63(v),119(v),35(v)
                                                    118(g),108(g),65(v),120(g)
     4. BD (   1) C   1 - H   8          0.99151    -0.52951  118(v),111(v),33(v),108(g)
                                                    74(v)
     5. BD (   1) C   2 - C   3          0.99018    -0.64924  110(v),108(g),117(v),25(v)
                                                    113(g),112(g),54(v),115(g)
                                                    55(v)
Boratabenzene
Optimisation
File:Boratabenzene opt log 63637.out [1]
DOI:10042/to-http://hdl.handle.net/10042/20712
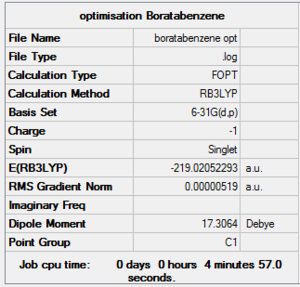

Boratabenzne replaces a "C-H" with "B-H" but to be isoelectronic an extra charge needs to be added, so the molecule is negatively charged. The molecule is optimised by using 6-31(d,p) as the basis set. Below is the table that helps me to confirm that the molecule is fully optimised.
Item               Value     Threshold  Converged?
 Maximum Force            0.000152     0.000450     YES
 RMS     Force            0.000043     0.000300     YES
 Maximum Displacement     0.000814     0.001800     YES
 RMS     Displacement     0.000171     0.001200     YES
 Predicted change in Energy=-1.948479D-07
 Optimization completed.
    -- Stationary point found.
Frequency Analysis
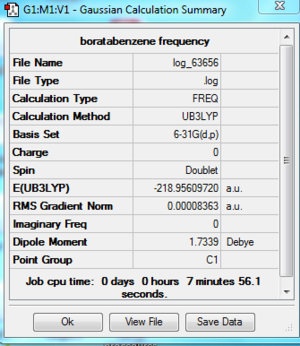
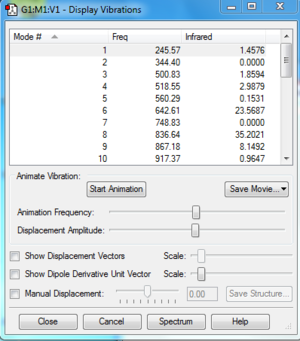
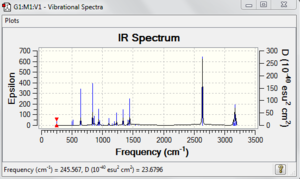
File:Boratabenzene freq log 63656.out
DOI:10042/to-http://hdl.handle.net/10042/20949
Frequency analysis is carried out by changing the optimisation into frequency in the Job Type tab and submit the calculation. The largest low frequency is much smaller than the smallest vibrational frequency. It is about 10% of the vibrational frequency and it is caused by we use a harmonic approximation for vibrations that are actually anharmonic.
Item               Value     Threshold  Converged?
 Maximum Force            0.000387     0.000450     YES
 RMS     Force            0.000084     0.000300     YES
 Maximum Displacement     0.000883     0.001800     YES
 RMS     Displacement     0.000231     0.001200     YES
 Predicted change in Energy=-2.219600D-07
 Optimization completed.
    -- Stationary point found.
Low frequencies ---  -12.9041   -0.0010   -0.0009    0.0002   10.8855   21.1080
 Low frequencies ---  245.5674  344.4026  500.8262
 Harmonic frequencies (cm**-1), IR intensities (KM/Mole), Raman scattering
 activities (A**4/AMU), depolarization ratios for plane and unpolarized
 incident light, reduced masses (AMU), force constants (mDyne/A),
 and normal coordinates:
                     1                      2                      3
                     A                      A                      A
 Frequencies --   245.5674               344.4024               500.8258
 Red. masses --     2.0463                 3.1064                 2.0998
 Frc consts  --     0.0727                 0.2171                 0.3103
 IR Inten    --     1.4576                 0.0000                 1.8594
Molecular Orbital
The .chk file is opened instead of log file and the Job Type is switched to Energy."pop=full" is added to the additional keyword. Make sure under the NBO tab, "Fully NBO" is selected.
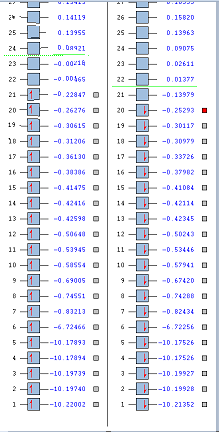
DOI:10042/to-http://hdl.handle.net/10042/20954
NBO Analysis


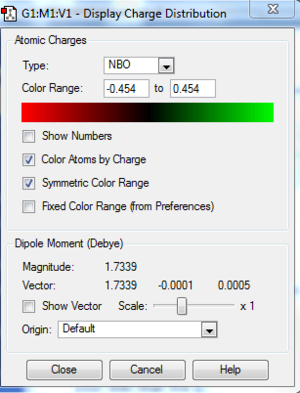
The table below shows the summary of the charge distribution in the molecule in every single atom. It is the same thing as the charge distribution shown in the image but this is just in a table form.
Summary of Natural Population Analysis:

                                       Natural Population
                Natural  -----------------------------------------------
    Atom  No    Charge         Core      Valence    Rydberg      Total
 -----------------------------------------------------------------------
      C    1   -0.45355      1.99910     4.44282    0.01164     6.45355
      C    2   -0.26426      1.99913     4.25048    0.01464     6.26426
      C    3   -0.12213      1.99914     4.11034    0.01265     6.12213
      C    4   -0.26425      1.99913     4.25048    0.01464     6.26425
      C    5   -0.45356      1.99910     4.44283    0.01164     6.45356
      H    6    0.23266      0.00000     0.76580    0.00155     0.76734
      H    7    0.23561      0.00000     0.76257    0.00182     0.76439
      H    8    0.23283      0.00000     0.76566    0.00151     0.76717
      H    9    0.23560      0.00000     0.76258    0.00182     0.76440
      H   10    0.23266      0.00000     0.76579    0.00155     0.76734
      H   11   -0.06187      0.00000     1.06116    0.00071     1.06187
      B   12    0.45027      1.99926     2.53945    0.01102     4.54973
 =======================================================================
   * Total *    0.00000     11.99486    28.91996    0.08518    41.00000
The bond contribution from the carbon atoms is no longer 50-50 as in benzene ring. As we can see from the table, some of the bond for example no. 2 has 60-40 contribution from each carbon atom. It is caused by the present of boron atom in the ring system.
 (Occupancy)   Bond orbital/ Coefficients/ Hybrids
 ---------------------------------------------------------------------------------
     1. (0.99324) BD ( 1) C   1 - C   2
                ( 49.53%)   0.7038* C   1 s( 34.00%)p 1.94( 65.96%)d 0.00(  0.04%)
                                            0.0000  0.5827 -0.0201  0.0011  0.8108
                                            0.0335  0.0168 -0.0277  0.0002  0.0000
                                            0.0011  0.0000  0.0000  0.0178 -0.0099
                ( 50.47%)   0.7104* C   2 s( 37.02%)p 1.70( 62.94%)d 0.00(  0.04%)
                                           -0.0001  0.6083 -0.0120  0.0003 -0.7907
                                           -0.0176 -0.0533 -0.0338 -0.0002  0.0000
                                            0.0006  0.0000  0.0000  0.0159 -0.0103
     2. (0.88742) BD ( 2) C   1 - C   2
                ( 59.53%)   0.7716* C   1 s(  0.00%)p 1.00( 99.97%)d 0.00(  0.03%)
                                            0.0000  0.0000  0.0000  0.0000 -0.0003
                                            0.0000  0.0006  0.0000  0.9998 -0.0070
                                            0.0000  0.0172  0.0066  0.0000  0.0000
                ( 40.47%)   0.6361* C   2 s(  0.00%)p 1.00( 99.94%)d 0.00(  0.06%)
                                            0.0000  0.0000  0.0000  0.0000 -0.0003
                                            0.0000  0.0006  0.0000  0.9996 -0.0112
                                            0.0000 -0.0231  0.0070  0.0000  0.0000
     3. (0.99196) BD ( 1) C   1 - H   6
                ( 62.18%)   0.7885* C   1 s( 28.09%)p 2.56( 71.87%)d 0.00(  0.04%)
                                            0.0003 -0.5300  0.0014  0.0020  0.3646
                                            0.0049  0.7653 -0.0030 -0.0004  0.0000
                                           -0.0115  0.0000  0.0000  0.0134  0.0096
                ( 37.82%)   0.6150* H   6 s( 99.95%)p 0.00(  0.05%)
                                           -0.9997 -0.0030 -0.0101 -0.0200  0.0000
     4. (0.98847) BD ( 1) C   1 - B  12
                ( 66.97%)   0.8184* C   1 s( 37.84%)p 1.64( 62.15%)d 0.00(  0.01%)
                                            0.0001 -0.6149 -0.0181 -0.0014  0.4554
                                            0.0104 -0.6426  0.0330  0.0005  0.0000
                                            0.0072  0.0000  0.0000  0.0055  0.0029
                ( 33.03%)   0.5747* B  12 s( 32.43%)p 2.08( 67.48%)d 0.00(  0.09%)
                                            0.0000 -0.5695  0.0003 -0.0040 -0.4184
                                            0.0204  0.7058  0.0338 -0.0006  0.0000
                                            0.0260  0.0000  0.0000  0.0096  0.0097
There is nothing particular interesting in the table below unless there is a value which exceed 20kcal/mol in E(2) column.
Threshold for printing:   0.25 kcal/mol
                                                                             E(2)  E(j)-E(i) F(i,j)
        Donor NBO (i)                     Acceptor NBO (j)                 kcal/mol   a.u.    a.u.
===================================================================================================
within unit  1
  1. BD (   1) N   1 - B   5        / 20. LP*(   1) B   6                    0.33    0.78    0.021
  1. BD (   1) N   1 - B   5        / 77. RY*(   2) B   7                    0.75    1.21    0.038
Clearly from the table we can see that the bond has a very different energy which varies from -0.70421 to -0.25739.
Natural Bond Orbitals (Summary):

                                                            Principal Delocalizations
           NBO                        Occupancy    Energy   (geminal,vicinal,remote)
 ====================================================================================
 Molecular unit  1  (C5H6B)
     1. BD (   1) C   1 - C   2          0.99324    -0.70421  110(g),109(g),114(v),111(g)
                                                    43(v),108(g),97(v),42(v)
                                                    120(v)
     2. BD (   2) C   1 - C   2          0.88742    -0.25739  119(v),113(v),100(v),107(g)
                                                    44(v)
     3. BD (   1) C   1 - H   6          0.99196    -0.50861  110(v),32(v),118(v),106(g)
                                                    109(g),96(v)
     4. BD (   1) C   1 - B  12          0.98847    -0.53837  111(v),106(g),117(v),33(v)
                                                    32(v),63(v),108(g)
     5. BD (   1) C   2 - C   3          0.99200    -0.69081  106(g),108(v),53(v),116(v)
                                                    112(g),22(v),111(g),114(g)
                                                    23(v)
     6. BD (   1) C   2 - H   7          0.99200    -0.51867  112(v),109(v),106(g),22(v)
                                                    42(v)
Borazine
Optimisation
Borazine is the boron,nitrogen substituted analogue of benzene. As usual, I optimised borazine using basis set of 6-31(d,p) and submit it to HPC for calculation. In order to make sure that the molecule is fully optimised, I have attached an "item" file and it shows that it is converged and also prove that it is fully optimised.
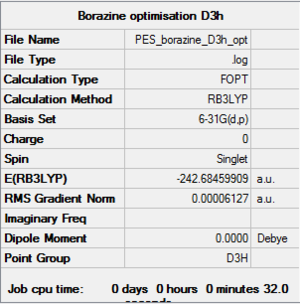
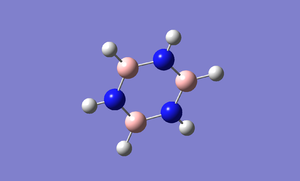

 Item               Value     Threshold  Converged?
 Maximum Force            0.000034     0.000450     YES
 RMS     Force            0.000012     0.000300     YES
 Maximum Displacement     0.001026     0.001800     YES
 RMS     Displacement     0.000230     0.001200     YES
 Predicted change in Energy=-4.304818D-08
 Optimization completed.
    -- Stationary point found.
File:Borazine opt log 63688.log DOI:10042/to-http://hdl.handle.net/10042/20787
Frequency Analysis
The frequency analysis is carried out by changing the job type from optimisation into frequency. The following are the IR, summary and the low frequenies I have obtained.
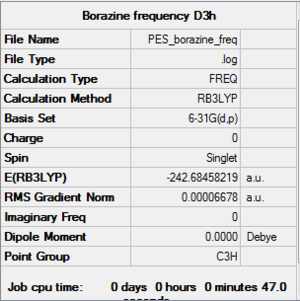
File:Borazine freq log 63831.log
DOI:10042/to-http://hdl.handle.net/10042/20796
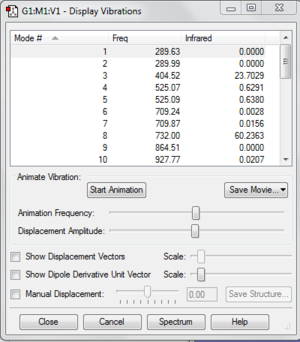
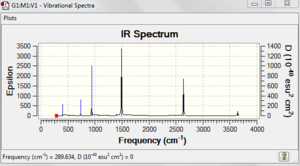

This shows that the molecule is optimised.
Item               Value     Threshold  Converged?
 Maximum Force            0.000056     0.000450     YES
 RMS     Force            0.000023     0.000300     YES
 Maximum Displacement     0.001294     0.001800     YES
 RMS     Displacement     0.000419     0.001200     YES
 Predicted change in Energy=-8.161482D-08
 Optimization completed.
    -- Stationary point found.
The largest low frequency is much smaller than the smallest vibrational frequency. It is less than 10% of the vibrational freqency. This is because we use a harmonic approximation for vibrations that are actually anharmonic.
Low frequencies ---  -15.8568  -13.3170   -0.0005    0.0007    0.0013   16.5751
 Low frequencies ---  289.6345  289.9914  404.5204
 Harmonic frequencies (cm**-1), IR intensities (KM/Mole), Raman scattering
 activities (A**4/AMU), depolarization ratios for plane and unpolarized
 incident light, reduced masses (AMU), force constants (mDyne/A),
 and normal coordinates:
                     1                      2                      3
                     A                      A                      A
 Frequencies --   289.6344               289.9914               404.5203
Molecular Orbital
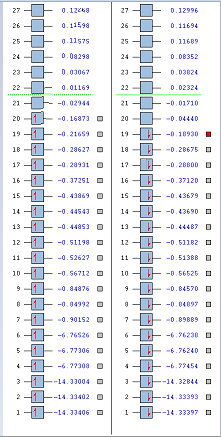
Molecular orbital is run by setting the method to "Energy" and make sure that in the "NBO" tab it is full NBO. DOI:10042/to-http://hdl.handle.net/10042/20796
NBO Analysis
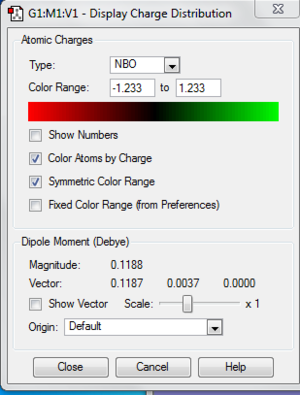
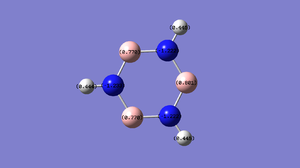
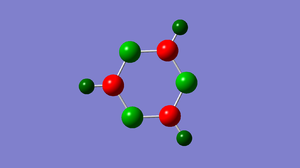
The table below shows the charge distribution in each atom in a molecule.
Summary of Natural Population Analysis:

                                       Natural Population
                Natural  -----------------------------------------------
    Atom  No    Charge         Core      Valence    Rydberg      Total
 -----------------------------------------------------------------------
      N    1   -1.23334      1.99941     6.22891    0.00502     8.23334
      H    2    0.44596      0.00000     0.55200    0.00204     0.55404
      N    3   -1.22196      1.99941     6.21743    0.00513     8.22196
      N    4   -1.22201      1.99941     6.21747    0.00513     8.22201
      B    5    0.77022      1.99850     2.19821    0.03307     4.22978
      B    6    0.80082      1.99858     2.16790    0.03270     4.19918
      B    7    0.77023      1.99850     2.19820    0.03307     4.22977
      H    8    0.44602      0.00000     0.55194    0.00204     0.55398
      H    9    0.44406      0.00000     0.55379    0.00215     0.55594
 =======================================================================
   * Total *    0.00000     11.99380    26.88584    0.12036    39.00000
The bond contribution between N-B bond is 79% from N atom and 21% from B atom. In N atom, 37% are s hybridised orbital and 62% are p hybridised orbital which forms a sp2 orbital. In B atom, 30% are s hybridised orbital while 70% are p hybridised orbital so it forms sp3 orbital.
Occupancy)   Bond orbital/ Coefficients/ Hybrids
 ---------------------------------------------------------------------------------
     1. (0.99372) BD ( 1) N   1 - B   5
                ( 78.66%)   0.8869* N   1 s( 37.37%)p 1.68( 62.61%)d 0.00(  0.02%)
                                            0.0000  0.6113  0.0025 -0.0002  0.3282
                                           -0.0165  0.7198  0.0088 -0.0001  0.0000
                                            0.0068  0.0000  0.0000 -0.0045 -0.0093
                ( 21.34%)   0.4619* B   5 s( 28.98%)p 2.44( 70.73%)d 0.01(  0.29%)
                                           -0.0003  0.5323 -0.0807  0.0028 -0.3452
                                           -0.0761 -0.7607 -0.0604  0.0001  0.0000
                                            0.0322  0.0000  0.0000 -0.0336 -0.0267
     2. (0.99371) BD ( 1) N   1 - B   7
                ( 78.66%)   0.8869* N   1 s( 37.37%)p 1.68( 62.61%)d 0.00(  0.02%)
                                            0.0000  0.6113  0.0025 -0.0002  0.3810
                                           -0.0157 -0.6933 -0.0100  0.0001  0.0000
                                           -0.0074  0.0000  0.0000 -0.0034 -0.0093
                ( 21.34%)   0.4619* B   7 s( 28.99%)p 2.44( 70.72%)d 0.01(  0.29%)
                                           -0.0003  0.5323 -0.0807  0.0028 -0.4007
                                           -0.0804  0.7329  0.0546 -0.0001  0.0000
                                           -0.0369  0.0000  0.0000 -0.0284 -0.0267
     3. (0.91591) BD ( 2) N   1 - B   7
                ( 89.08%)   0.9438* N   1 s(  0.00%)p 1.00(100.00%)d 0.00(  0.00%)
                                            0.0000  0.0000  0.0000  0.0000  0.0000
                                            0.0000  0.0001  0.0000  1.0000 -0.0009
                                            0.0000  0.0056 -0.0002  0.0000  0.0000
                ( 10.92%)   0.3305* B   7 s(  0.00%)p 1.00( 99.57%)d 0.00(  0.43%)
                                            0.0000  0.0000  0.0000  0.0000  0.0000
                                            0.0000  0.0001  0.0000  0.9978  0.0131
                                            0.0000 -0.0286  0.0592  0.0000  0.0000
The value in E(2) does not exceed 20 kcal/mol so there is nothing special in this analysis.
Second Order Perturbation Theory Analysis of Fock Matrix in NBO Basis

     Threshold for printing:   0.25 kcal/mol
                                                                              E(2)  E(j)-E(i) F(i,j)
         Donor NBO (i)                     Acceptor NBO (j)                 kcal/mol   a.u.    a.u.
The energy for N-B bond is either around -0.7au or -0.29 au.
Natural Bond Orbitals (Summary):

                                                            Principal Delocalizations
           NBO                        Occupancy    Energy   (geminal,vicinal,remote)
 ====================================================================================
 Molecular unit  1  (H3B3N3)
     1. BD (   1) N   1 - B   5          0.99372    -0.69820  95(g),98(v),77(v),97(g)
                                                    20(r)
     2. BD (   1) N   1 - B   7          0.99371    -0.69821  94(g),105(v),57(v),97(g)
                                                    20(r)
     3. BD (   2) N   1 - B   7          0.91591    -0.28496  100(v),58(v),62(v),96(g)
                                                    91(v)
     4. BD (   1) N   1 - H   9          0.99341    -0.63945  104(v),99(v),56(v),76(v)
                                                    95(g),94(g)
     5. BD (   1) H   2 - N   3          0.99274    -0.64218  94(v),102(v),99(g),69(v)
                                                    101(g),57(v),56(v)
     6. BD (   1) N   3 - B   5          0.98033    -0.69772  20(v),101(g),97(v),66(v)
                                                    98(g)
     7. BD (   2) N   3 - B   5          0.92134    -0.28527  103(v),68(v),71(v),33(v)
                                                    100(g)
     8. BD (   1) N   3 - B   6          0.99422    -0.69047  99(g),98(g),105(v),57(v)
                                                    20(g)
     9. BD (   1) N   4 - B   6          0.99422    -0.69047  104(g),105(g),98(v),77(v)
                                                    20(g)
    10. BD (   2) N   4 - B   6          0.91479    -0.28414  96(v),82(v),78(v),87(v)
    11. BD (   1) N   4 - B   7          0.98032    -0.69775  20(v),102(g),97(v),66(v)
                                                    105(g)
    12. BD (   1) N   4 - H   8          0.99274    -0.64211  95(v),101(v),104(g),69(v)
Compare and Contrast
Charge Distribution
The charge distribution for the atom in the benzene are all the same. As for boratabenzene, the hydrogen atoms all have almost the same charge distribution except the one that attach to boron which is negative. As for the carbon atom in boratabenzene, the nearer the carbon atom attached to boron, the more negative it is.
Pyridinium is very similar to boratazine. The hydrogen atoms have similar charge distribution except the one attached to nitrogen which has the highest charge distribution. The nearer the carbon atom attach to nitrogen atom, the less negative the charge distribution.
For borazine, the boron has the highest charge distribution and the nitrogen is very negative. The hydrogen atom have charge distribution which are lower than boron but it is still positive.
Molecular Orbital and Substitution of Atoms

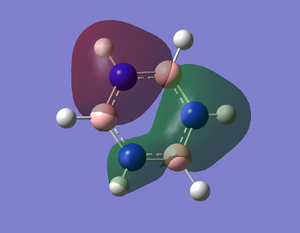
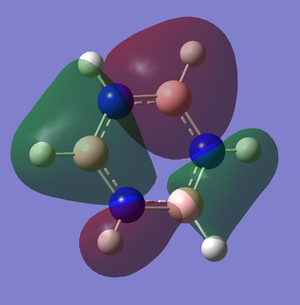
For boratabenzene, the carbon is substituted by boron atom which is more electropositive. The energy level for boron is higher which contribute lessto the bonding. The overlapping is not as good as in benzene so the splitting energy will be smaller. For example the pi bonding for MO. the overlap of p orbital of boron with carbon is not good because the p orbital of boron is smaller than carbon. It contributes less to bonding and cause the splitting energy to become smaller. Unlike in benzene, the p orbital can overlap perfectly which cause large splitting energy. There is one more example which is shown in the image.
For pyridinium it is the exact opposite that is happening. The nitrogen is more electronegative so the energy level for nitrogen will be lower. The overlapping will not be as good as in benzene and thus the splitting energy become smaller.For example the pi bonding for MO. the overlap of p orbital of nitrogen with carbon is not good because the p orbital of nitrogen is larger than carbon. It contributes more to bonding and cause the splitting energy to become smaller.
For borazine, the difference between energy level of nitrogen and boron is very large so the splitting energy is smaller than pyridinium and boratabenzene. For example the pi bonding for MO. the overlap of p orbital of nitrogen with boron is not good because the p orbital of nitrogen is much more larger than boron. It contributes more to bonding and cause the splitting energy to become very small.
The overall MO diagram of benzene is very similar with boratabenzene, pyridiniuma and borazine. The differences are in the energy level of the atoms and the splitting energy. However, the overall framework of MO diagram of benzene is still the same.
Reference
The literature value for TlBr3 is 2.564 angstrom.[1]
- ↑ Glaser, J. U. L. I. U. S., and G. E. O. R. G. Johansson. "On the structures of the hydrated thallium (III) ion and its bromide complexes in aqueous solution." Acta Chemica Scandinavica A 36 (1982): 125-135.
Thus the electron deficient is partially removed by the B-Br pi bonding causes the partial occupation of the vacant p orbital on the B atom by electrons donated by the Br atom.[1]
- ↑ Shriver & Atkins', Inorganic Chemistry, 5, 2010, 326

