Rep:Mod:Transition States and Reactivity - OHC15
Introduction
Potential Energy Surface
Potential Energy Surface are usually represented on a 2D coordinate system. In reality, the potential energy surface is a multidimensional surface with dimension equals to the number of degrees of freedom, which is given by , where is the number of atoms in the molecule. Each degree of freedom are correlated to an external parameter. Knowing the energy surface for a particular external parameter, the correspond chemical properties, like bond energies and reaction energies, could be obtained from the second derivatives of the energy. A successful reaction pathway is the lowest energy route going from the one energy minima to another energy minima (reactant and product state) via energy maxima, which is the transition state. Using the mathematical property of these stationary points, geometries at these 3 states could be identified. Firstly, their first derivative must equal to zero, i.e. . Reactant and product states would have positive second derivatives, i.e. , while the transition state would yield a negative second derivative, i.e. . Converting these properties to the context of vibrational frequencies, the second derivative of a energy surface gives the force constant of a vibrational mode, which can resolve to give vibration frequencies using ( is the reduced mass). Checking for imaginary negative vibration frequencies of optimised geometries using the computational methods described below could allow identification of the transition state, while well optimised reactant and product geometries should not give any negative frequencies from their positive second derivative value.
Nf710 (talk) 11:14, 9 February 2018 (UTC) You can get the force constants by diagonaisling the hessian matrix
Finding Transition State Geometry
Method 1
To use this method, knowledge of the transition state geometry is required to propose a sensible guess of the transition state geometry to generated optimised structure with the help of optimisation calculations. This one-step method is relatively quick and direct, however, it is prone to error as there is chance that the proposed geometry is an invalid representation of the actual transition state geometry.
Method 2
The guessed transition state geometry is formed by modelling reactants approaching each other for reaction. Coordinates of reactant atoms involved in bond formation are freezed while the entire geometry is optimised. This decreases the likelihood of getting an incorrect transition state geometry, giving higher chance of reaching the true transition state geometry before the structure is further optimised.
Method 3
Instead of finding the transition state geometry from the structure of reactants, this method get an approximate transition state geometry from the optimised product state structure. Atoms involved in bond breaking are held in place by freezing coordinates. Optimised transition state structures are then further optimised in transition state calculation. This is a more reliable way to get a correct TS structure than guessing from the reactant state.
Computational Methods
2 different optimisation calculations, PM6 and B3LYP, are performed on modeled molecular structures using Gaussian. Semi-empirical PM6 method is based on the Hartree-Fork model, but instead of performing the full Hartree-Fork method, various assumptions and approximations, including Born-Oppenheimer, independent electron and LCAO approximations, are used. This method also import empirical data for some parameters, as such computational cost is greatly reduced and thus speeding up the calculation process and making calculations possible for large molecules. To correct for discrepancies due to omitted information in approximations, like the instantaneous interactions of electrons, semi-empirical methods are parametrised to fit results so that they agree with experimental data or sometimes with ab initio results. Another method used is the B3LYP method, which uses hybrid functionals developed based on Density Functional Theory. Density Functional Theory obtains energy values using electron density functionals, instead of the orbital wavefunction approach used in Hartree-Fork method. B3LYP is a reasonably fast method that yields good structural and thermochemical properties of system with higher accuracy compared to PM6. In this experiment, most calculations are performed with PM6 and some are further optimised usnig B3LYP.
Nf710 (talk) 11:14, 9 February 2018 (UTC) This is a good understanding. Some equations would have complemented your discussion. The B3LYP is a hybrid becaiuse DFT cannoy acount for exchange correlation and therefore uses HF to recover it.
Diels-Alder Reaction of Cis-Butadiene and Ethene (Ex. 1)
(Fv611 (talk) Very good section overall, especially well done on the MO diagram. The only to be made is to reflect on the significant figures of your bond lengths (are they really that accurate?) and also that you could have explicitly discussed the comparison between the length of the bond being formed at the TS and the length of a single, sp3 hybridised C-C bond.)

Transition state investigation of the [4+2] cycloaddition reaction between butadiene and ethene was performed starting with a guessed transition state structure (method 2) where C2-C3 and C4-C5 distances were first frozen. This resulted in a transition state structure optimised at PM6 level. Then IRC analysis was carried out. Individual reactants and product structures were analysed at PM6 level and compared with structures generated in IRC analysis.
Optimisation and Frequency Calculations
|
| ||||||
|
|
Cis-Butadiene
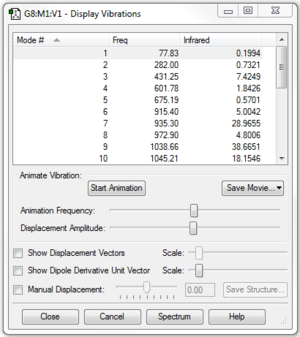
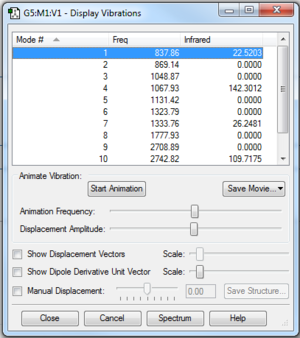
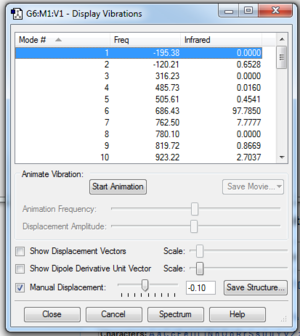
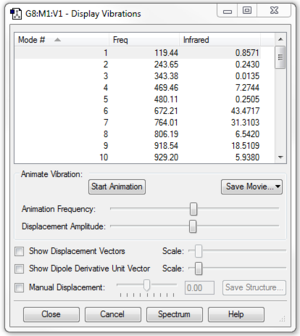
Butadiene could exist in its trans- or cis- conformer. For Diels-Alder reaction to occur, the molecule must has a cis- conformation. In addition to that, it was observed that the optimised planar cis-butadiene has one negative vibration frequency. This is due to the fact that the cis-butadiene has a completely planar geometry which is at the local maxima between 2 other lower energy, bent geometries of cis-butadiene. In reality, the molecule is constantly flexing between the 2 bent conformation through the planar geometry. The reaction can only occur when cis-butadiene approaches ethene in its planar geometry, as observed in the IRC analysis. The negative vibration frequency can be removed by manually displacing the vibration to +1 or -1 and reoptimising the structure.(Figure 1b.) The cis-butadiene (PM6) optimisation file is linked to here and the file after breaking the symmetry is linked to here.
 |
 |
Ethene
Optimisation at PM6 level of ethene was executed and result file could be found here. No negative frequency is observed.
 |
Transition State
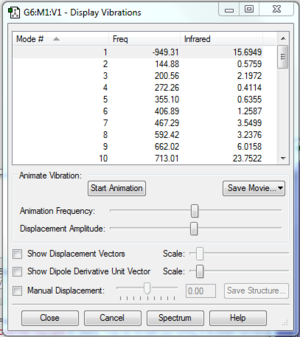
The transition state obtained is confirmed to be valid as it has only one negative vibration frequency (Fig.1c) with all converging parameters shown in the log file of the opt+freq processes. This shows that the modeled transition state is at a stationary point where its second derivative is negative (i.e. a maximum point) and resulting in a negative vibration frequency. This negative vibration mode shows that the 2 ends of butadiene approach ethene carbons at the same rate in synchronised motion, which agrees with the result in the IRC analysis, showing that the formation of both C2-C3 and C4-C5 bonds is synchornous.
 |
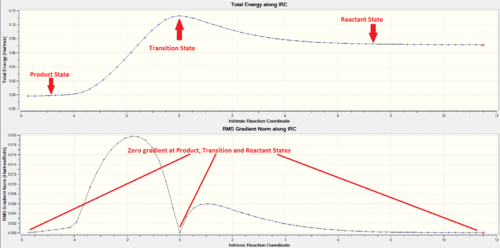 |
In the IRC analysis, a nice asymmetrical curve to the product state (LHS) and reactant state (RHS) from the Transition state is obtained. This shows a successful path through the guessed TS structure where both reactant and product states were reached. The IRC started from the product side as it is not able to differentiate which minima correspond to the reactant and which corresponds to the product state. The product, transition and reactant states coordinates all have zero gradient confirming that energy minima were obtained at product and reactant states while the transition state is at the maxima of the total energy curve.
Cyclohexene
Optimisation and frequency calculations of cyclohexene were performed twice at PM6 level, as 2 negative vibration frequencies were noted. After breaking the symmetry, no negative frequency can be observed.
 |
 |
MO Analysis
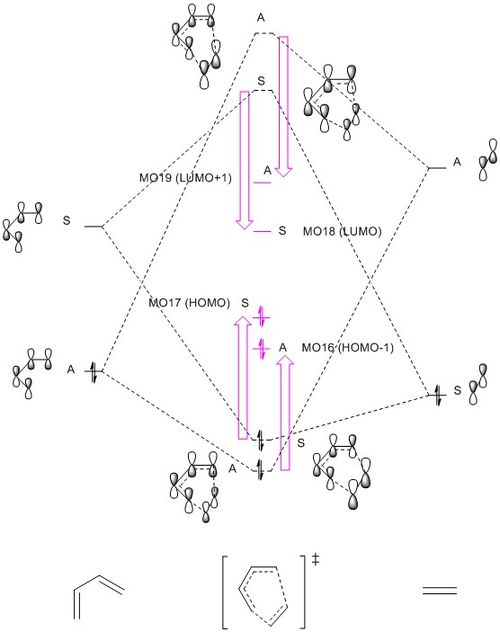
Figure 1i. is the MO diagram constructed using the molecular orbital information obtained from the reactants and TS geometries. The MO energies of the electron rich butadiene HOMO and electron poor ethene (dienophile) LUMO follows a normal demand Diels-Alder reaction.
The resemblance in shapes of TS HOMO and LUMO with that of ethene HOMO and butadiene LUMO indicating that the HOMO-LUMO pair of TS are formed from the interaction between HOMO of ethene and LUMO of butadiene. These orbitals are all described to be symmetrical(S) due to the existence of a mirror plane in the molecular orbital. In contrast, the anti-symmetric(A) HOMO-1 and LUMO+1 are resultant MO from the interaction between anti-symmetric(A) ethene LUMO and butadiene HOMO, characterised by the absence of a vertical plane of symmetry and the 180 degrees rotation about the C2 axis. From these observations, it is possible to conclude that this reaction is governed by orbital symmetry satisfying Pauli Repulsion rule. Interaction can only occur or 'allowed' between orbitals of the same symmetry (i.e. S-S/ A-A). On the other hand, anitsymmetric-symmetric (A-S/S-A) orbital interactions are 'forbidden-ed', and not observed in any TS MO. Combinations of S-A orbital interactions would yield a zero overlap integral. The overlap integral is a quantitative measure indicating the strength of orbital interaction. Thus, contributing orbitals must be of the same symmetry (i.e. S-S/ A-A) to yield a non-zero overlap integral of the resultant MO.
Generally speaking, orbital interaction would result in energy splitting of molecular orbitals, giving one stabilised bonding MO and a destabilised anti-bonding orbital, where destabilising energy is usually greater than stabilisation energy. However, this is not the case for transition state MO energies. The bonding HOMO-1 and HOMO energies are both observed to be higher than butadiene HOMO. This brings the TS HOMO closer to butadiene LUMO, increasing the contribution from butadiene LUMO to the TS HOMO. This is reflected in the size of TS HOMO, showing that ethene HOMO and butadiene LUMO has almost equal contribution to this TS HOMO. The raise in energy of HOMO-1 is relatively less significant than that in HOMO, as there is a significant size difference between the ethene LUMO and butadiene HOMO within the MO. Meanwhile, the anti-bonding LUMO and LUMO+1 energies are lowered. These changes in the 4 TS MO energies is also possibly due to the fact that it is in transition state, so the result is different from what we would expect for a product.
Energy: -942.58083 kJ/mol |
Energy: 51.09223 kJ/mol |
Energy: -1029.93122 kJ/mol |
Energy: 111.74129 kJ/mol | ||||||||||||
Energy: -860.00885 kJ/mol |
Energy: -854.12773 kJ/mol |
Energy: 45.52617 kJ/mol |
Energy: 80.47158 kJ/mol |
Bond Length
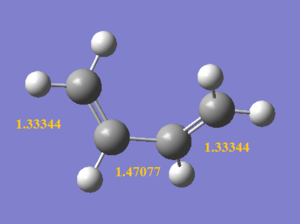
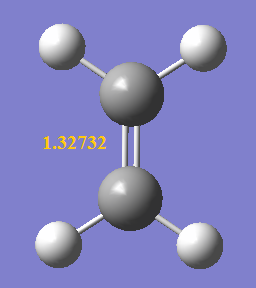
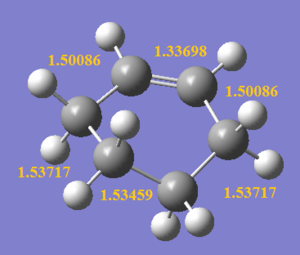
As the reaction occur, the C1-C6 bond length decrceases from 1.47077 Å to 1.33698 Å due to the formation of a C=C, both C1 and C6 remain to be sp2 hybridised. In contrast, C3-C4 bond lengthens from 1.32732 Å to 1.53459 Å as the carbons changes from sp2 to sp3 hybridised upon the removal of C=C bond. It is also observed that the 2 double bonds (C1-C2 and C5-C6) on butadiene lengthen as the outer carbons (C2 and C5) changes from sp2 to sp3 hybridised, but this lengthening is less significant than that of C3-C4, as C1 and C6 in these bonds remain to be sp2 hybridised, giving a mixture of sp2 and sp3 character. The bond lengths of obtained structures agree closely with literature values shown in the table below. Comparing the bond lengths with the van der Waals radius of a free C atom (i.e. 1.70 Å), the bonded carbons has internuclear distance shorter than twice of vdW radius (i.e. 3.40 Å) as they are held closer to each other by bonds. Even for C2-C3 and C4-C5 internuclear distances, they are also shorter than twice of the vdW radius hinting that bond formation is happening where these carbons are held by weak interactions in the TS.
 |
 |
 |
 |
| Literature values / Å | |
| sp2-sp2 C=C | 1.33[1] |
| sp3-sp3 C-C | 1.54[1] |
| Van der Waals radius of C | 1.70[2] |
Diels-Alder Reaction of Cyclohexadiene and 1,3-Dioxone (Ex. 2)
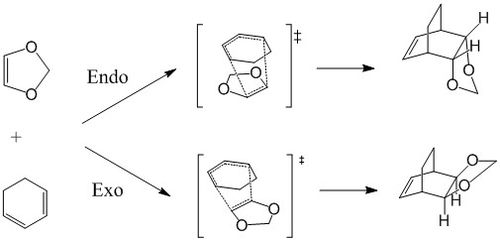
Another Diels-Alder reaction between Cyclohexadiene and 1,3-Dioxone was investigated. The transition state geometry was found using Method 3, starting from the structure of the end product. Both Exo and Endo reaction paths were investigated. All molecules are first optimised at PM6 level prior to optimisation and frequency calculations using DFT (B3LYP) method.
Optimisation, Frequency calculations
| Reactants | Transition States | Products | |||||||||
|
|
| |||||||||
|
|
|
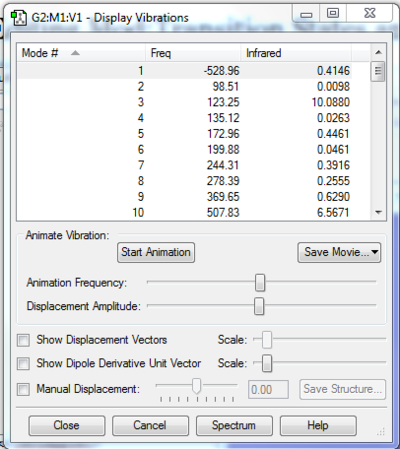
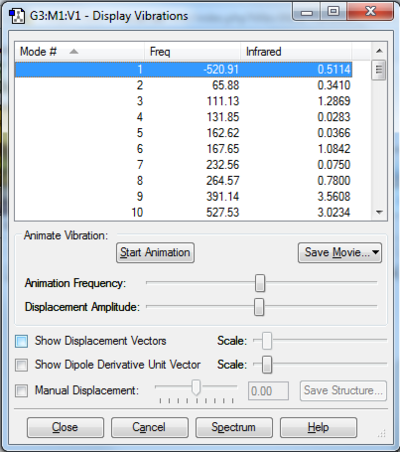
For reactant molecules, reoptimisations were performed to remove negative frequencies by breaking symmetry. Reactant and product structures shown above are geometries with no negative frequencies and in their lowest energy conformation. One negative frequency vibration mode is observed in each TS geometry.
 |
 |
IRC Analysis
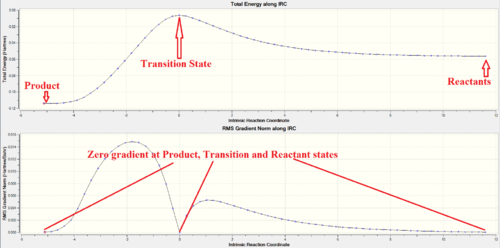
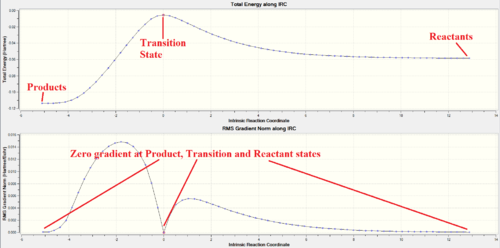
IRC analysis of endo and exo transition states were only performed using PM6 method from the PM6 optimised transition state structures. B3LYP IRC calculations were not performed due to the long computation time of this method. Both IRC paths were successful, starting from the product state on the left hand side, via the transition state, to reach the reactant state on the right hand side. A maximum in energy along both IRC occurred at the TS, with zero RMS gradient norm. Zero gradient is also observed at the start and end of the IRC, confirming that products and reactants are reached. Thus, confirming that the proposed transition states from the product geometries are a valid for both Endo and Exo reactions.
Energies
| Method | Cyclohexadiene | 1,3-dioxole | Endo TS | EndoProduct | Exo TS | Exo Product |
| PM6(Hartree/particle) | 0.116877 | -0.052279 | 0.137942 | 0.037805 | 0.138903 | 0.037974 |
| PM6(kJ/mol) | 306.860587 | -137.258525 | 362.166749 | 99.2570351 | 364.689854 | 99.7007446 |
| B3LYP(Hartree/particle) | -233.324375 | -267.068643 | -500.332149 | -500.418691 | -500.329168 | -500.417322 |
| B3LYP(kJ/mol) | -612593.19323 | -701188.77561 | -1313622.15727 | -1313849.37330 | -1313614.33065 | -1313845.77899 |
Energy values of optimised geometries for this reaction are converted to kJ/mol and shown in the table above. Despite B3LYP method gives energy values much higher than that obtained using PM6 method, relative energies of reactants, transition states and products are consistent in both methods. Both methods shows that Exo pathway has a higher activation energy and less negative reaction energy than Endo reaction. This indicates that Endo is both the kinetic and thermodynamic product as its transition state can easily be reached with a lower activation barrier and gives a thermodynamically more stable product than the Exo path. Therefore, indicating that this reaction would be dominated by Endo path and forming sterospecific Endo product.
| Method | PM6 | B3LYP | ||
|---|---|---|---|---|
| Exo | Endo | Exo | Endo | |
| Activation Energy | 195.08779 | 192.56469 | 167.63819 | 159.81157 |
| Reaction Energy | -69.90132 | -70.34503 | -63.81015 | -67.40446 |
Mo Analysis
(Fv611 (talk) Excellent MO diagrams. Well done!)
 |
 |
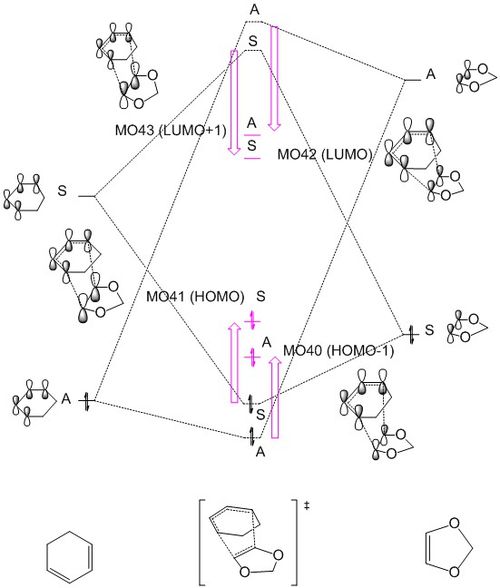
The relative energies of reactants HOMO and LUMO in this reaction are different from the one discussed in Ex. 1. The 2 electron donating O atoms bonded to the dienophile raise the energy of the dioxole HOMO to level higher than diene HOMO, reversing the role of diene and dieneophile HOMO-LUMO. This is an example of inverse demand Diels-Alder reaction.
Energy: -0.20554 Hartrees |
Energy: -0.01710 Hartrees |
Energy: -0.19593 Hartrees |
Energy: 0.03795 Hartrees |
Similar to reaction in Ex. 1, the TS HOMO-LUMO pair are symmetrical and formed from orbital interaction between symmetrical diene LUMO and dioxole HOMO, while the diene HOMO and dioxole LUMO contributing to TS HOMO-1 and LUMO+1. In this reaction, the effect of energy raise of TS HOMO on the constituent orbital contribution is less profound than that observed in Ex. 1, as the diene LUMO-dioxole HOMO gap is smaller in this reaction. This results in a more uneven contribution from the constituent diene and dienophile MO in the formation of TS HOMO.
Energy: -0.19800 Hartrees |
Energy: -0.18560 Hartrees |
Energy: -0.00698 Hartrees |
Energy:0.01018 Hartrees | ||||||||||||
Energy:-0.19648 Hartrees |
Energy:-0.19052 Hartrees |
Energy:-0.00462 Hartrees |
Energy:0.01543 Hartrees |
Nf710 (talk) 11:30, 9 February 2018 (UTC) Your energies are correct well done and therefore you have come to the correct conclusions. You have somewhat over complicated your discussion. I would not say that the s orbitals on the H contribute to SOO They are extremely low in energy. Only the P orbitals from the oxygen would. But your argument and diagram of the sterics is very good so well done there
Reaction of O-Xylylene and SO2 (Ex. 3)
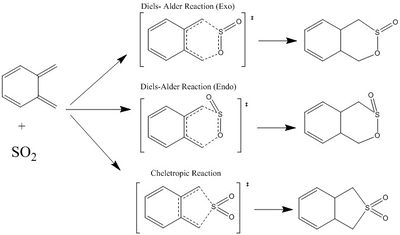
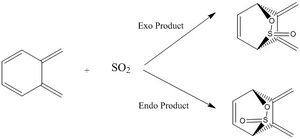
(Don't forget to draw the newly formed double bonds! Tam10 (talk) 14:23, 4 February 2018 (UTC))
In this section, the reaction between Xylylene and SO2, via Diels-Alder Endo and Exo pathway, as well as the Cheletropic pathway will be investigated. The reaction scheme of SO2 with the terminal butadiene are shown in Figure 3a. and these reactions will be the main focus of our transition state geometry investigation. Other possible reactions, including reactions with the internal butadiene fragment, will be discussed in the extension section.
Optimisation and Frequency Calculations
All molecules are first optimised using PM6 method, then reoptimised to B3LYP level. All reactants and products structures do not have negative vibration frequencies after re-optimising. The transition state geometries are checked to have only one negative frequency vibration. IRC analysis of transition state geometries were performed at PM6 level only due to the long waiting time of calculation process using DFT B3LYP method.
|
|
|
| ||||||
|
|
|
|
(You must select the correct frame for your Jmols Tam10 (talk) 14:23, 4 February 2018 (UTC))
Reaction Energy and Activation Energy
The reaction profiles are plotted in Figure 3b.and Figure 3c. using energy values of molecules optimised at PM6 level and B3LYP level. The results from PM6 shows that Cheletropic pathway has the highest activation barrier and most negative reaction free energy. This indicates that Cheletropic product is the thermodynamic product, as it gives the most thermodynamically stable product. The high energy barrier to its transition state is due to the formation of a strained 5-member ring. In the product geometry, the formation of 2 additional C-S bond (lit. bond enthalpy: 272kJ/mol[3])without having to break any S-O bond gives the most thermodynamically stable product.
In contrast, the Endo pathway has the lowest activation barrier and forms the least stable product, which means Endo product is the kinetic product. This reaction would dominate under kinetic controlled condition. The energy of transition state is much lower via Diels-Alder pathway due to the formation of a strain-free 6-member ring and the O atom of SO2 provide stability to the transition states. Despite the fact that C-O bond energy (lit. bond enthalpy: 358kJ/mol[3]) is greater than C-S bond, Diels-Alder products have lower reaction free energy as a S-O bond is broken, which outweighs the difference in energy gain from C-O bond formation, instead of C-S bond.
However, results from B3LYP optimisation slightly contradict with PM6. It shows that Exo product is the thermodynamically most stable geometry, while the Cheletropic product being the least stable product with the highest reaction barrier. The Endo reaction remains to be the kinetic pathway with the lowest activation barrier.
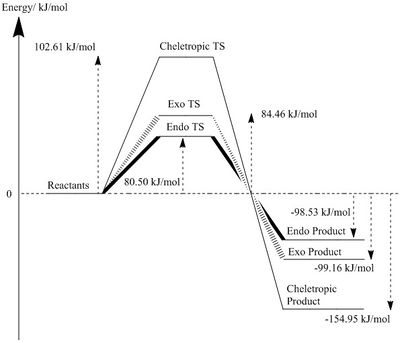
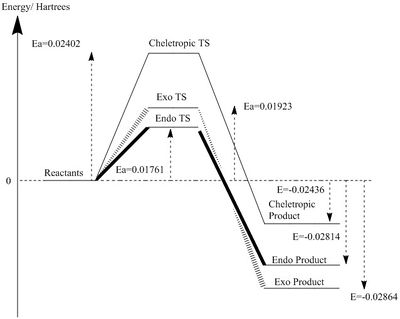
| PM6 (Hartree/particle) | PM6 (kJ/mol) | B3LYP (Hartree/particle) | B3LYP (kJ/mol) | |
|---|---|---|---|---|
| Xylylene | 0.178208 | 463.3408 | -309.50449 | -804711.6792 |
| SO2 | -0.11861 | -308.3964 | -548.60492 | -1426372.784 |
| Exo TS | 0.09208 | 239.4002 | -858.09018 | -2231034.473 |
| Exo Product | 0.02146 | 55.783 | -858.13805 | -2231158.917 |
| Exo Activation Energy | 0.03248 | 84.45580 | 0.01923 | 49.99020 |
| Exo Reaction Energy | -0.03814 | -99.1614 | -0.02864 | -74.4536 |
| Endo TS | 0.09056 | 235.4456 | -858.09180 | -2231038.677 |
| Endo Product | 0.02170 | 56.4122 | -858.13755 | -2231157.633 |
| Endo Activation Energy | 0.03096 | 80.5012 | 0.01761 | 45.786 |
| Endo Reaction Energy | -0.03790 | -98.5322 | -0.02814 | -73.1692 |
| Cheletropic TS | 0.099061 | 257.5586 | -858.08539 | -2231022.019 |
| Cheletropic Product | -0.000002 | -0.00520 | -858.13377 | -2231147.807 |
| Cheletropic Activation Energy | 0.03947 | 102.6142 | 0.02402 | 62.4442 |
| Cheletropic Reaction Energy | -0.05960 | -154.9496 | -0.02436 | -63.34380 |
(Interesting and sort of unexpected. Well done for doing the B3LYP calcs. Don't forget to convert energies to kJ/mol Tam10 (talk) 14:23, 4 February 2018 (UTC))
IRC Analysis
The 'Total Energy' and 'RMS Gradient Norm' plots showed successful reaction pathway in each type of reaction via a valid transition state structure obtained using Method 3.
| Exo | Endo | Cheletropic |
|---|---|---|
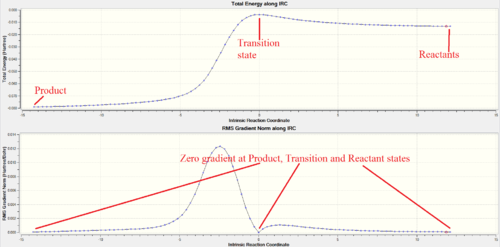
|
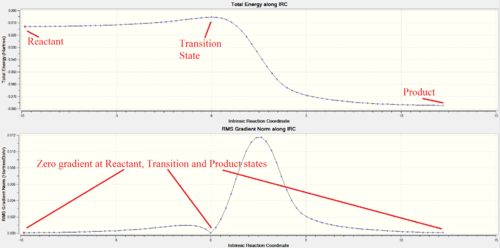
|

|
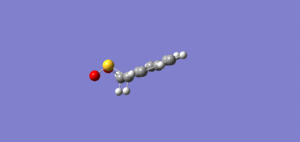
Looking at the IRC animation, it is observed that the aromatisation of Xylylene occurs before any C-S and/or C-O bonds are formed. This shows that Xylylene is highly reactive and has a strong desire to gain aromaticity. This supports the possibility for Xylylene to self-aromatise via 4
electrocyclic reaction, although it gives a highly strained 4-member ring. (Figure 3d.)

(How would this reaction proceed according to WH rules? The TS is relatively easy to find once you know this. You would be able to say if the reaction is possible under the conditions needed for the above Tam10 (talk) 14:23, 4 February 2018 (UTC))
The Cheletropic cycloaddition reaction occur via the synchronous C-S bond formation where both terminal alkenes bond to the same S atom at the same time as shown in the IRC. Both Diels-Alder reactions exhibit an asynchronous C-O, C-S bond formation, where O bonds to one of the terminal alkene carbon before another terminal alkene bond with S atom to give C-S bond, agreeing with their low activation energy TSs due to stabilisation from SO2 O atom.
| Exo | Endo | Cheletropic |
|---|---|---|
|

|

|
MO Analysis
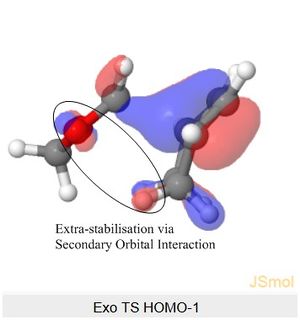
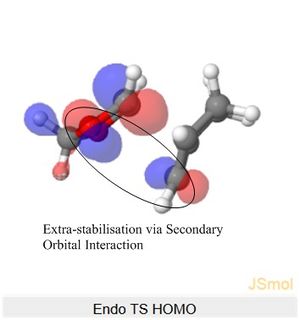
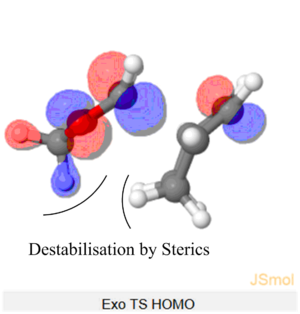
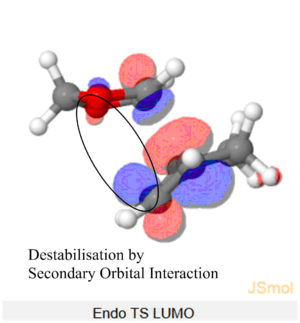
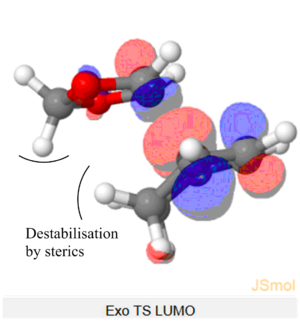
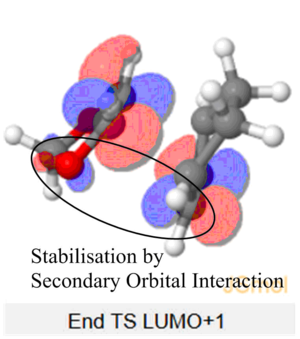
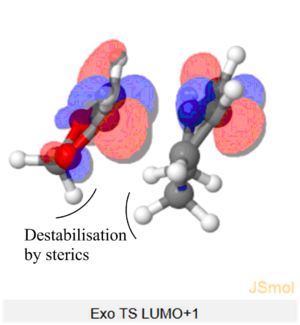
The Endo TS HOMO below shows stabilisation via secondary orbital interaction between the non-bonding O atom of SO2 and the lobe of the internal alkene fragment, explaining Endo TS being more stabilised than the Exo TS.
| Reactants |
Energy: -496.92842 kJ/mol |
Energy: -174.67453 kJ/mol |
Energy: -866.86140 kJ/mol |
Energy: -349.00774 kJ/mol | ||||||||||||
|---|---|---|---|---|---|---|---|---|---|---|---|---|---|---|---|---|
| Exo |
Energy: -702.76764 kJ/mol |
Energy: -563.90493 kJ/mol |
Energy: -267.69600 kJ/mol |
Energy: -136.63103 kJ/mol | ||||||||||||
| Endo |
Energy: -690.11273 kJ/mol |
Energy: -561.46322 kJ/mol |
Energy: -257.24651 kJ/mol |
Energy: -118.462569 kJ/mol | ||||||||||||
| Cheletropic |
Energy: -694.549823 kJ/mol |
Energy: -584.51511 kJ/mol |
Energy: -284.893027 kJ/mol |
Energy: -130.22481 kJ/mol |
(This doesn't look like the correct geometry for the cheletropic TS. But you've shown the SOI in the endo TS Tam10 (talk) 14:23, 4 February 2018 (UTC))
Extension
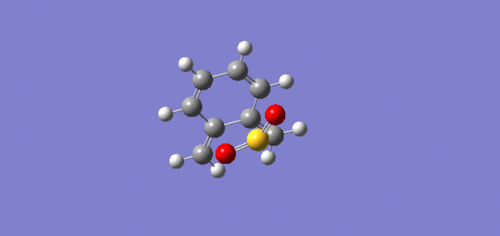
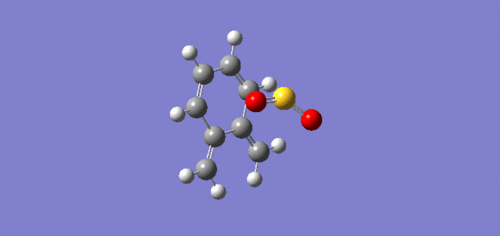
In addition to reactions via the terminal alkene and the
electrocyclic reaction of Xylylene, reactions of the internal diene fragment with SO2 is also viable (figure 3e.). Method 3 is used to obtain TS of these reactions and optimised using PM3 method. The table below show that the activation barriers of these reactions are much higher than reactions with the terminal diene, as these transition states no longer have stabilisation from aromatisation as observed in the IRC. These reactions are so unfavourable that yield positive reaction free energies, indicating that these reactions are not spontaneous and are endothermic.
[Endo TS File] [Endo Product File] [Exo TS File] [Exo Product File]
 |
 |
|---|
| Internal Diene | Terminal Diene | |||
|---|---|---|---|---|
| Exo | Endo | Exo | Endo | |
| Activation Energy | 118.1986 | 110.4376 | 84.4558 | 80.5012 |
| Reaction Energy | 20.046 | 15.639 | -99.1614 | -98.5322 |
Conclusion
Transition state geometries for each reaction were successfully identified using Gaussian. Various functions of Gaussian calculation were explored and applied to anaylse physical properties of reactions being investigated. For instance, energy values of reactant, product and transition state geometries provide information on reaction free energy and activation barrier, thus allowing the prediction of thermodynamic and kinetic pathways. Intrinsic reaction coordinates (IRC) analysis provide pictorial insight to reaction mechanism as well as the evolution of properties, like bond lengths, during the course of reaction. Visualization of MO is another extremely useful tool that allow in-depth explanation on reaction energies and reactivity in terms of orbital interactions. It is also observed that calculated values from PM6 and B3LYP has great discrepancies and could result in contradicting results. Nevertheless, Gaussian is an extremely convenient and useful tool to explore reaction properties, especially for rare or non-existing species.
Reference
[1] Berg, Jeremy M. “Appendix C: Standard Bond Lengths.” Biochemistry. 5th Edition., U.S. National Library of Medicine, 1 Jan. 1970, www.ncbi.nlm.nih.gov/books/NBK21220/
[2] Batsanov S, Van der Waals Radii of Elements, Inorganic Materials Translated from Neorganicheskie Materialy Original Russian Text, 2001 vol: 37 (9) pp: 871-885
[3] Huheey, pps. A-21 to A-34; T.L. Cottrell, "The Strengths of Chemical Bonds", 1958, 2nd ed., Butterworths, London

