Rep:Mod:Thermal expansion of MgO jw4813
Introduction
This experiment basically uses two methods(quasi-harmonic approximation and molecular dynamics) to calculate the free energy of MgO at the solid state, and investigate the relationship between free energy and temperature. During the experiment, software: RedHat Linux, DLVisualize and GULP are used to compute the result. The whole experiment should keep the temperature below the melting point of MgO (3125K[1]), because above the melting point, the material is liquid not solid.
An Initial Calculation on MgO
The 3D version of MgO primitive cell unit looks like the graph below.

| a | 2.9783A | alpha | 60。 |
|---|---|---|---|
| b | 2.9783A | beta | 60。 |
| c | 2.9783A | gamma | 60。 |
From the log file, it shows that the MgO has Mg with 2+ charged, and O with 2- charged. These 2 ions are held together by ionic bond, with lattice energy -41.07531759 eV, which is the energy needed to hold the ions together.
Calculating the phonon modes of MgO
From this exercise, the phonon dispersion state out all possible vibrations of MgO crystal. The density of states(DOS) shows the probability of each vibration in the given size. Therefore, different grids will give different DOS graph. For 1*1*1 grid, there is only one single k-point computed out at (0.5, 0.5, 0.5) position. Compare the vibration frequency in the log file with phonon dispersion graph, it shows that this k point is labeled L on the phonon dispersion graph. When the grid size increases, the molecule will be separated into more parts. For example, 2*2*2 grid size will separate the 3-D molecule by 2 times on each side and gives 4 k-points. Alone each k-point, there is a number of different vibrations will be found out. Therefore, the larger the grid size, the more the k-point and there will be more vibrations in the sample. From 1*1*1 to 4*4*4 grid size, there are more and more peaks computed out on the DOS graph. From 8*8*8 grid size, the peaks start mixing together to give a continuous line. 32*32*32 is a minimum size for the later experiment, because when the grid size increases to 64*64*64, the DOS graph will look similar to the 32*32*32 one but smoother. It shows that 32*32*32 grid size gives enough k-points to show the tendency of vibration of MgO.
Each curve on the phonon dispersion graph is given by the possible vibrations of the molecule. The DOS graph gives a tendency of the vibration of the molecule. For MgO most vibrations concentrated upon 400 cm-1, the highest peak on DOS graph is around 400 cm-1. Then look at the phonon dispersion graph, there is almost a horizontal curve along 400 cm-1. The following graph shows the relationship between DOS and phonon dispersion graph.

This grid size will be appropriate for a calculation on the crystal with similar structure as MgO. Therefore, any crystal with CF8 structure can use this grid size (eg: CaO). For zeolite, it has a larger primitive unit cell and a complicated structure. Therefore it needs more k-points to compute an intact DOS graph, then, a larger grid size is needed. For metals, the crystal only contains one type of atom, and the primitive unit cell will contain only one atom. Therefore it needs less k-point to show the general DOS graph, then, a smaller grid size is required.
Computing the Free Energy - The harmonic approximation
Helmholtz-free energy has equation A=U-TS, which defines the energy under a given temperature and volume in the closed system.[2]For this part, the Helmholtz free energy was computed under different grid size at the same temperature, and the value is unchanged. From equation dA=-PdV-SdT, it shows that the Helmholtz free energy is related to the volume and temperature. Different grid size will not change the volume of the primitive unit cell, and all the experiment were computed under 300K. Therefore, the constant volume and temperature will not change the Helmholtz free energy. From the log file of each grid size, there is a value of weight for each k-point. The weight for 8*8*8 grid size is 0.004, the weight for 16*16*16 is 0.0005, and the weight for 32*32*32 is 0.0001. Therefore 8*8*8 grid size will give a value accurate to 1 meV, 16*16*16 will give a value accurate to 0.5 meV, and 32*32*32 will give a value accurate to 0.1 meV. For 64*64*64, the computing time is too long, although it will give a more accurate value. It is better to use 32*32*32 grid size for the next experiment, which will give an accurate result, and save time at the same time.
Similar reason as before, the suitable grid size for similar oxide is 32*32*32, for zeolite is larger, and for metal is smaller.
The Thermal Expansion of MgO


There are two equations for Helmholtz free energy, A=U-ST and dA=-PdV-SdT. Therefore, it is expected to get a decreasing tendency of free energy against temperature. From the graph of Helmholtz free energy against temperature, it shows that the free energy is decreasing with the increasing of temperature, which proved the equation A=U-ST.
For this experiment, the pressure was kept constant at zero, so the equation dA=-PdV-SdT=-0*dV-SdT=-SdT. From the graph of free energy against temperature, it shows that the gradient of the curve is increasing as the temperature is increasing. In this case dA=-SdT, therefore, the graph shows that with increasing temperature, the entropy of the system is increasing.
From the graph of the lattice constant against temperature. It shows that the lattice constant "a" from primitive unit cell increases by the increasing of temperature. Combine both graphs together, as the entropy increases, the crystal becomes more disorder, therefore, the length of the primitive unit cell will increase. Hence the volume of the primitive unit cell will increase by temperature.
This experiment is based on quasi-harmonic approximation, which means that at low temperature, the vibration of a diatomic molecule obeys the simple harmonic motion. Under this approximation, the bond between two ions will never break by increasing temperature.[3] Therefore, the volume of the unit cell will increase, when the temperature is increasing.
As the temperature approaches the melting point of MgO, the structure will be more disordered, which gives a less similar structure to quasi-harmonic approximation structure. Therefore the phonon modes represent the less actual motions of the ions.
In a diatomic molecule with an exactly harmonic potential the bond length will increase at low temperature, but at high temperature(eg. m.p.), the bond will break finally. The bond will never break under quasi-harmonic approximation, therefore there is a continuous increasing of bond length.
Molecular Dynamics


The large sample of cell is used in the molecular dynamics, because the less the unit cell, the less motions will be given. Then, it is less accurate to compute the free energy on a small size.
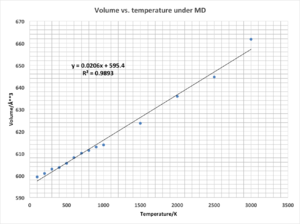
Compare to the lattice constant against temperature under quasi-harmonic approximation, both have an increasing trend by increasing temperature. However, under quasi-harmonic approximation, the lattice constant increases slowly at first, then fast. Under MD, the volume increases linearly with a gradient approximately to 0.0206 Å3/K. This value can use to calculate the thermal expansion coefficient. α=(1/Vi)*(dV/dT)P, and Vi=599.36 Å3 (dV/dT)P=0.0206 Å3/K here. Therefore, α=0.0206/599.3687=0.00003437K-1.
From the previous experiment, the grid size is 32*32*32 for computing the free energy. Therefore, the size of 32*32*32 primitive unit cell combined together will be a large cell enough to perform reliably MD for MgO.
Conclusions
The difference between these two results due to the different methods. Under quasi-harmonic approximation, the free energy calculation is based on the temperature, and the larger grid size will give a more accurate result. However, under MD, the accuracy depends on the time step. The shorter the time step, the more accurate the result is.
In quasi-harmonic approximation, the cell volume will keep increasing at high temperature, but in the MD, the bond between two ions will break at high temperature. During the experiment, the temperature for computing under quasi-harmonic approximation kept between 0 to 1000K, hence to give closer results compare to MD.
Reference
[1]: Physical Properties of MgO. Available: http://www.sigmaaldrich.com/catalog/product/aldrich/529699?lang=en®ion=GB. Last accessed 16th Dec 2016.
[2]:Peter Atkins, Julio de Paula. (2010). The Helmholtz and Gibbs Energies. In: Atkins' Physical Chemistry. 9th ed. United States: W.H. Freeman and Company. 114.
[3]:Dove, Martin T. (1993). Introduction to lattice dynamics, Cambridge university press.
