Rep:Mod:TheRealSLimShady
By: Stefanie Lim CID:00593047
Module 2: Bonding (Ab Initio and Density Functional Molecular Orbital)
BH3
Geometry Optimisation
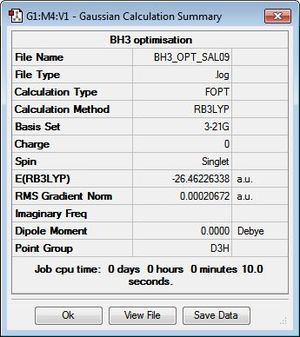
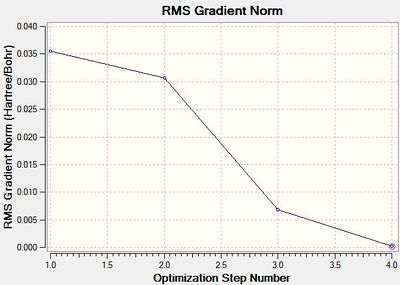
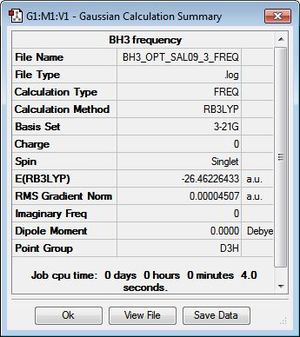
BH3 was modelled initially as a trigonal planar molecule on GaussView with all three B-H bond lengths set to 1.5 Å. The system was then subjected to an optimisation through Gaussian 09W, using B3LYP as the method and 3-21G as the basis set. Despite the relatively low accuracy of 3-21G, the choice to employ this for the optimisation was justified given the simplicity and symmetry of the molecule. A summary of the calculation is displayed in Figure 1. As shown, a dipole moment of zero is typical of the D3h point group, which the molecule has been assigned to due to its high symmetry.
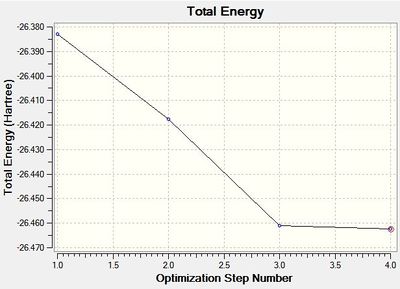
Recalling that the equilibrium structure of a molecule is that which experiences no force, the optimised structure of BH3 can be found as the global minimum of an energy-distance graph (Figure 2), given that the slope corresponds to the force of the system. Hence, a zero-value in the RMS gradient can be used to confirm the success of an optimisation. While the RMS gradient in Figure 1 suggests an optimised structure, the LOG file was inspected to ensure that the optimisation was indeed successful (see text files below). The energy (and forces) of the system were found to have converged, thus, confirming an optimised geometry. This structure can be viewed here.
         Item               Value     Threshold  Converged?
 Maximum Force            0.000413     0.000450     YES
 RMS     Force            0.000271     0.000300     YES
 Maximum Displacement     0.001610     0.001800     YES
 RMS     Displacement     0.001054     0.001200     YES

 Predicted change in Energy=-1.071764D-06
 Optimization completed.
    -- Stationary point found.
The D3h optimised structure predicts a B-H bond length of approximately 1.19 Å and an H-B-H bond angle of 120°, which is consistent with that reported in literature[1].
                             Optimized Parameters
                            (Angstroms and Degrees)
--------------------------                            ------------------------
Name  Definition              Value          Derivative Info.
------------------------------------------------------------------------------
R1    R(1,2)                  1.1935         -DE/DX =    0.0004
R2    R(1,3)                  1.1935         -DE/DX =    0.0004
R3    R(1,4)                  1.1935         -DE/DX =    0.0004
A1    A(2,1,3)                120.0          -DE/DX =    0.0
A2    A(2,1,4)                120.0          -DE/DX =    0.0
A3    A(3,1,4)                120.0          -DE/DX =    0.0
D1    D(2,1,4,3)              180.0          -DE/DX =    0.0
------------------------------------------------------------------------------
 |
 |
Frequency Analysis
As mentioned above, the optimised structure of a system corresponds to a global minimum in an energy-distance graph. While a zero-value in first derivative (i.e. the force) indicates the presence of a stationary point, it does not distinguish between a maximum or a minimum. This is only confirmed by analysing the second derivative: if positive, the stationary point is a minimum and vice-versa if negative. By performing a frequency analysis of BH3, this can be determined and the optimisation of the system confirmed. Additionally, the IR spectrum can be calculated to confirm the identity of the molecule.
To ensure that the frequency analysis was performed on the optimised molecule, the energy of the system was checked in the calculation summary, displayed in Figure 4, and compared with that of the optimised molecule (see Figure 3). It can be seen that the energies are identical, confirming that the correct molecule was analysed.
| Entry | Mode of Vibration | Frequency
(cm-1) |
Lit. Frequency
(cm-1)[2] |
Intensity of Absorption | Symmetry Label
of Vibration |
Diagram |
|---|---|---|---|---|---|---|
| 1 | Antisymmetrical stretching | 2730.07 | 2813 | 103.85 | E' | 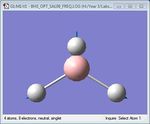 |
| 2 | Antisymmetrical stretching | 2730.07 | 2693 | 103.86 | E' |  |
| 3 | Symmetrical stretching | 2591.65 | - | 0.00 | A1' | 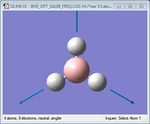 |
| 4 | BH3 rocking | 1204.86 | 1305 | 12.39 | E' | 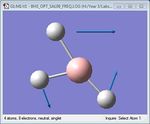 |
| 5 | BH3 scissoring | 1204.86 | 1305 | 12.39 | E' | 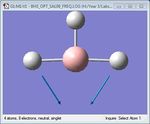 |
| 6 | Umbrella deformation | 1146.03 | 1225 | 92.67 | A2" | 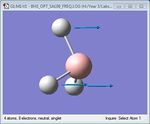 |
 Low frequencies ---   -0.3716   -0.0098   -0.0018   37.2444   37.9574   37.9592
 Low frequencies ---   1146.0292   1204.8631   1204.8641
As shown in Table 1 above, BH3 is predicted to have six vibrational frequencies, as expected from the 3N-6 rule with N=4. However, it can be seen from the IR spectrum that only 3 peaks are observed. This is due to the fact that the molecule exhibits two sets of degenerate motions and one IR-inactive motion. Entries 1 and 2 correspond to the degenerate albeit different antisymmetrical stretches of BH3, resulting in absorption at a single frequency. The same idea applies to entries 4 and 5, forming the second set of degenerate motions. It is clear that entry 3 appears IR-inactive due to a zero-intensity absorption. As IR spectroscopy requires a change in dipole moment in order to measure vibration frequencies, the fact that this motion is symmetrical renders the motion as unobservable. Thus, only 3 frequencies are observed.
Given that the resultant IR frequencies of BH3 are all positive, it can be said that a minimum in the energy optimisation has, indeed, been reached rather than a maximum, which would have resulted in negative vibrations typical of a transition state. It should be noted that the 'low frequencies' included in the text file above is due to motions of the centre of mass being displaced, rather than vibrations of the bonds of the molecule.
Molecular Orbital Analysis[3]
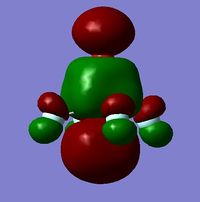
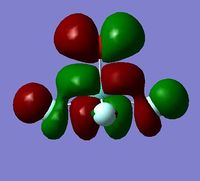
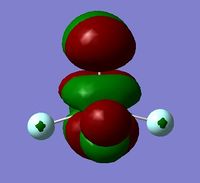
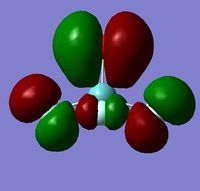
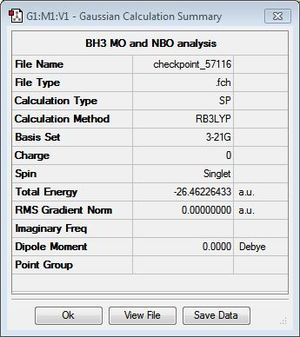
Given that the previous two sections have confirmed the optimisation of the BH3 structure, full MO analysis was carried out and compared with that predicted by qualitative MO diagrams. A Gaussian calculation was set up on the optimised structure then run on the HPC servers, selecting energy as the job type and including both MO and NBO calculations (see following section for NBO analysis). Figure 5 displays a summary of the calculation details.
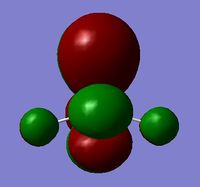
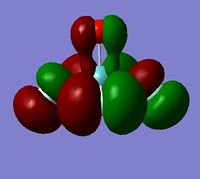
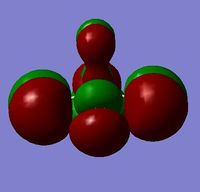
In order to determine whether the computed MOs are those that can be expected from the system, a qualitative MO diagram was produced based on the LCAO (Linear Combination of Molecular Orbitals) method. The BH3 unit was split into two separate units: an H3 unit (with one placeholder) and a B unit (with three placeholders). Given that hydrogen is more electronegative that boron (H=2.20, B=2.04), the H AOs (Atomic Orbitals) were placed lower in energy than the B AOs. The presence of the B 1s AO must be noted, however, as being much lower in energy than the valence AOs of hydrogen and boron and, thus, does not participitate in any orbital mixing. One weakness of qualitative MO methods is the difficulty in determining the exact order of orbital/MO energies as well as the extent of orbital mixing that occurs in the system. Solving the electronic structure of BH3 and calculating the MOs quantitatively resolves this issue to provide a more accurate explanation for the bonding and reactivity of the system. Table 2 displays both the computed and qualitative MOs of BH3 as well as the energies of the calculated MOs.
 |
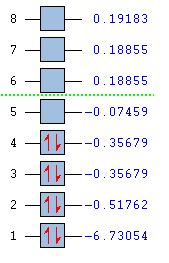 |
It is clear from the table above that there is very good agreement between the MOs predicted using quantitative and qualitative methods. The HoMO-3 MO corresponds to the B 1s AO and confirms the prediction that this orbital is too low in energy to interact with other molecular orbitals, given the relative energy difference with the other MOs. Additionally, it can be seen that the LUMO results from a non-bonding p-orbital from the B unit. The fact that its calculated energy is negative accounts for the reactivity of BH3 as a common Lewis acid, as population of this MO with a pair of electrons would not result in destabilising interactions.
One aspect that must be noted about qualitative MO methods is the fact it is based on the LCAO method and, thus, implies that orbitals are localised on individual atoms. Quantitative MO methods, on the other hand, account for the delocalisation of MOs across the entirety of the molecule, providing a more accurate representation of the electronics of the system.
Charge Distribution and NBO Analysis[4]
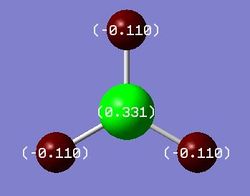
As alluded to previously, BH3 commonly reacts as a Lewis acid due to the presence of an empty boron p-orbital (LUMO) that can readily accept electrons without destabilisation of the system. An alternative explanation for this behaviour arises from analysis of the charge distribution across the molecule. As the MO and NBO analysis for BH3 was done simultaneously, the .log file of the calculation was inspected and opened in GaussView to visualise the charges. It is clear from Figure 6 that the Lewis acidity of the boron centre can be attributed to its highly positive charge and, hence, electron deficiency. As shown, the positive charge of the boron centre is roughly three times the negative charge of one of the hydrogen atoms, thus, resulting in an overall neutral molecule. To obtain a more quantitative analysis of the bonding in BH3, the text file of the calculation was examined. The relevant portions are included below.
Summary of Natural Population Analysis:

                                       Natural Population
                Natural  -----------------------------------------------
    Atom  No    Charge         Core      Valence    Rydberg      Total
 -----------------------------------------------------------------------
      B    1    0.33121      1.99904     2.66976    0.00000     4.66879
      H    2   -0.11040      0.00000     1.11008    0.00032     1.11040
      H    3   -0.11040      0.00000     1.11008    0.00032     1.11040
      H    4   -0.11040      0.00000     1.11008    0.00032     1.11040
 =======================================================================
   * Total *    0.00000      1.99904     6.00000    0.00097     8.00000
(Occupancy)   Bond orbital/ Coefficients/ Hybrids
 ---------------------------------------------------------------------------------
     1. (1.99851) BD ( 1) B   1 - H   2
                ( 44.49%)   0.6670* B   1 s( 33.33%)p 2.00( 66.67%)
                                            0.0000  0.5774  0.0000  0.0000  0.0000
                                            0.8165  0.0000  0.0000  0.0000
                ( 55.51%)   0.7451* H   2 s(100.00%)
                                            1.0000  0.0000
     2. (1.99851) BD ( 1) B   1 - H   3
                ( 44.49%)   0.6670* B   1 s( 33.33%)p 2.00( 66.67%)
                                            0.0000  0.5774  0.0000  0.7071  0.0000
                                           -0.4082  0.0000  0.0000  0.0000
                ( 55.51%)   0.7451* H   3 s(100.00%)
                                            1.0000  0.0000
     3. (1.99851) BD ( 1) B   1 - H   4
                ( 44.49%)   0.6670* B   1 s( 33.33%)p 2.00( 66.67%)
                                            0.0000  0.5774  0.0000 -0.7071  0.0000
                                           -0.4082  0.0000  0.0000  0.0000
                ( 55.51%)   0.7451* H   4 s(100.00%)
                                            1.0000  0.0000
     4. (1.99904) CR ( 1) B   1           s(100.00%)
                                            1.0000  0.0000  0.0000  0.0000  0.0000
                                            0.0000  0.0000  0.0000  0.0000
     5. (0.00000) LP*( 1) B   1           s(100.00%)
The data shown in the second text file provides important information about the 2e-2c bonding in BH3. Firstly, entries 1-3 show that boron forms bonds to the 1s AOs of hydrogen using its three sp2 hybrid orbitals. However, it contributes only 44.49% of the electron density to the bond while hydrogen provides 55.51%. This is expected given the electron deficiency of the boron centre shown by the charge distribution in the first text file. Entry 4 describes the boron 1s AO containing the core electron pair of the molecule while entry 5 shows the formally unoccupied (occupancy of 0) orbital of boron which acts as the LUMO of the system. It is suggested that the empty orbital is of s character, which is inconsistent with p character predicted from both the quantitative and qualitative MO methods. This error might be due to the fact that the calculation was done employing the B3LYP/3-21G method, which has relatively low accuracy. Thus, it is clear that this must be taken into account when analysing the calculated data obtained.
TlBr3
Geometry Optimisation
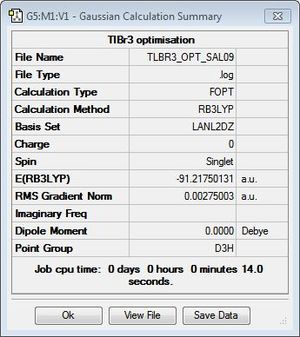
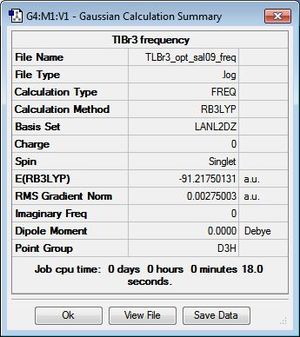
TlBr3 was optimised by first modelling the system as a trigonal planar molecule in GaussView. However, unlike in the optimisation of BH3, the symmetry of the system was restricted to the D3h point group and the tolerance set to 'very tight (0.0001) in order to simplify the calculations on the molecule and ensure the correct vibrations are computed later. An optimisation on Gaussian 09W was then performed using the DFT method B3LYP/LANL2DZ, which is a medium-level basis set used to employ pseudo potentials to compensate for the presence of heavier elements. Like restricting the symmetry of TlBR3, this is done to simplify the calculations and decrease the time required to calculate data. A summary of the Gaussian calculations can be found in Figure 7 and the optimised structure can be viewed here.
         Item               Value     Threshold  Converged?
 Maximum Force            0.000002     0.000450     YES
 RMS     Force            0.000001     0.000300     YES
 Maximum Displacement     0.000022     0.001800     YES
 RMS     Displacement     0.000014     0.001200     YES

Predicted change in Energy=-6.082801D-11
 Optimization completed.
    -- Stationary point found.

                           ----------------------------
                           !   Optimized Parameters   !
                           ! (Angstroms and Degrees)  !
 --------------------------                            --------------------------
 ! Name  Definition              Value          Derivative Info.                !
 --------------------------------------------------------------------------------
 ! R1    R(1,2)                  2.651          -DE/DX =    0.0                 !
 ! R2    R(1,3)                  2.651          -DE/DX =    0.0                 !
 ! R3    R(1,4)                  2.651          -DE/DX =    0.0                 !
 ! A1    A(2,1,3)              120.0            -DE/DX =    0.0                 !
 ! A2    A(2,1,4)              120.0            -DE/DX =    0.0                 !
 ! A3    A(3,1,4)              120.0            -DE/DX =    0.0                 !
 ! D1    D(2,1,4,3)            180.0            -DE/DX =    0.0                 !
 --------------------------------------------------------------------------------
As shown by the text files and RMS gradient above, the system has indeed converged to result in an optimised trigonal planar structure with Tl-Br bond lengths of 2.65 Å and bond angles of 120°. This is consistent with the reported literature values of 2.51 Å for a trigonal planar TlBr3 structure[5]. Additionally, the resultant zero dipole moment of the system, like BH3, is indicative of highly symmetrical systems and is typical of the D3h point group.
Frequency Analysis
To verify that the global minimum was reached in the optimisation, a frequency analysis was performed. The same method and basis set used in the optimisation was employed in the frequency analysis for consistency and to ensure that the calculations are run on the optimised system. Given that different methods and basis sets take into account different factors and, hence, have varying accuracies, it is likely that the calculated results for the properties of the system will change with the method implemented.
Low frequencies ---   -0.0008   -0.0004   -0.0003   18.6824   19.5014   19.5014
 Low frequencies ---   49.9765   49.9768   57.4606
| Entry | Mode of Vibration | Frequency
(cm-1) |
Lit. Frequency
(cm-1)[6] |
Intensity of Absorption | Symmetry Label
of Vibration |
Diagram |
|---|---|---|---|---|---|---|
| 1 | Antisymmetrical stretching | 195.01 | 233 | 23.68 | E' | 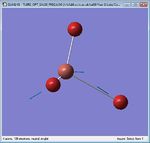 |
| 2 | Antisymmetrical stretching | 195.01 | 233 | 23.68 | E' | 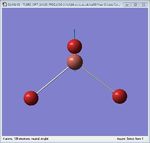 |
| 3 | Symmetrical stretching | 150.77 | 197 | 0.00 | A1' |  |
| 4 | Umbrella deformation | 57.46 | 66 | 5.81 | A2" | 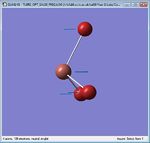 |
| 5 | BH3 rocking | 49.98 | 55 | 3.46 | E' | 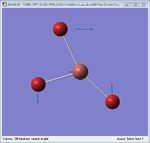 |
| 6 | BH3 scissoring | 49.98 | 55 | 3.46 | E' |  |
Given the non-negative values of the frequency analysis, it can be said that the system has indeed reached a global minimum in the optimisation of TlBr3. Inspection of the calculated values with those reported in literature shows that the method has been generally successful at modelling the system. While 6 frequencies are predicted, only 3 are displayed due to two pairs of degenerate frequencies only resulting in a single absorption for each pair. Furthermore, it can be seen in Entry 3 that this absorption is IR inactive given the symmetry of the motion and, hence, the lack of a change in dipole moment.
In addition to the agreement between the calculated and literature frequencies, it can be seen from the text file above that the lowest 'low frequency' - corresponding to the translational motion of the molecule - is very close to zero. This is in contrast to the BH3 system, which had a slightly higher value, thus, supporting the accuracy of the pseudo-potential employed in this case, rather than a full electron basis set as done previously.
Isomerism of Mo(CO)4L2
Geometry Optimisation
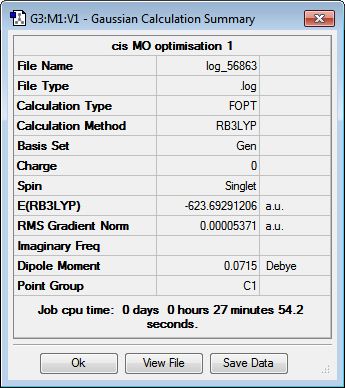
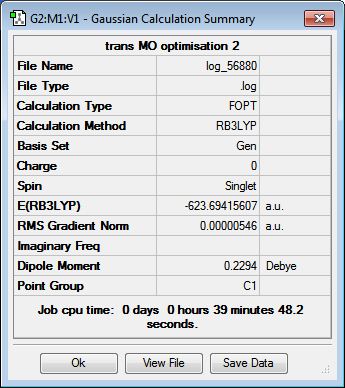
In a similar manner to the previous two sections, the structures of the cis- and trans-isomers of Mo(CO)4(PCl3)2 were optimised initially using the low-level method B3LYP/LANL2MB to obtain a rough geometry. As the normal convergence criteria for the optimisation is more accurate than the method employed, loose convergence criteria was set during the calculation setup to allow the system to reach the convergence limit. The .log files for the isomers can be found here: cis[7] and trans[8].
While this initial optimisation results in reasonable bond angles and lengths, the dihedral angles of the system are not accurately defined, given the relatively low accuracy of the employed basis set. It is likely that the minimum reached from the optimisation is a local minimum of the potential energy surface of the complex, rather than the global minimum. Thus, the PCl3 groups were manually rotated using GaussView before the next optimisation in an attempt to obtain the right optimised structure. For the cis-isomer, one of the P-Cl bonds was made to point upwards, parallel to the axial CO ligand, and the other P-Cl bond in the second group was made to point downwards. For the trans-isomer, the two groups are made to be eclipsed, with one of the P-Cl bonds from each group parallel to the Mo-CO bond. Once manipulated, these geometries were then optimised using the higher-level B3LYP/LANL2DZ method, again employing pseudo-potentials to compensate for the heavier elements. Given the higher accuracy of the basis set, the electronic convergence was increased in the calculation setup. The .log files from the second optimisation can be found here: cis[9] and trans[10].
Despite using the LANL2DZ psuedo-potential, the basis set used to model the system is still insufficient, given that it does not take into account the d orbitals of the phosphorus atom, which have a tendency to be hypervalent. Thus, another optimisation was carried out, manually adding the d AO functions (see below) as an extrabasis.
(blank line)
P 0
D  1  1.0
0.55  0.100D+01
****
(blank line)
This optimisation was performed on both molybdenum complexes on the HPC serves to result in the final optimised geometries of the isomers. The .mol and .log files of the optimisation can be found here: cis-Mo(CO)4(PCl3)2 optimisation log file, cis-Mo(CO)4(PCl3)2 optimised structure, trans-Mo(CO)4(PCl3)2 optimisation log file and trans-Mo(CO)4(PCl3)2 optimised structure.
 |
 |
Frequency Analysis
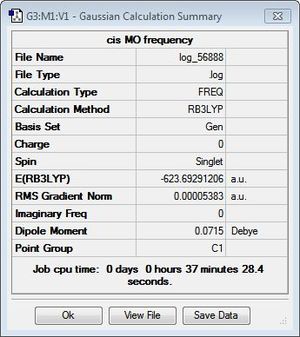
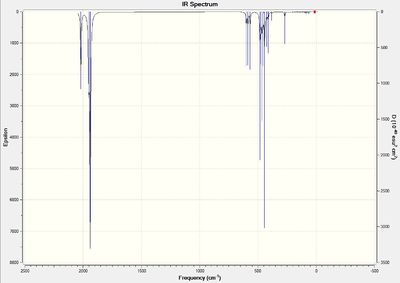
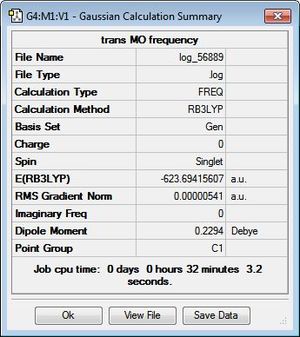
To verify the optimisation of the cis- and trans- isomers and to obtain the IR spectra of the complexes, frequency analysis was performed on both systems. The table below displays both the calculation summaries as well as the calculated IR spectra. The .log files of the frequency analyses can be found here: cis-isomer log file, trans-isomer log file.
Given the fact that no negative frequencies were found after the frequency analysis for either system, it can be deduced that the optimisation was successful. Additionally, given the symmetry of the two complexes, the IR spectra displays absorption peaks that are to be expected. In the trans-isomer, the complex is centrosymmetric, rendering all the CO ligands as equivalent and would, thus, absorb at a single frequency. However, in the cis-'isomer, the symmetry is reduced and is, thus, more likely to result in vibrations that cause changes in dipole moments. This results in more absorption frequencies, particularly in the carbonyl region, which is as observed in the provided IR spectra.
Mini Project: A comparison between MoSF4 and MoOF4
Given that the chemistry of transition metal-sulphide fluorides has focused on the WSF4 system, Nieboer, Mack, Mercier and Gerken[11] have decided to investigate the related complex, MoSF4, reporting its structure - both calculated and experimental - as well as the frequency and natural bond order analyses performed on the molecule. In addition, a brief comparison to the oxygen analogue, MoOF4, was made with regards to the bonding observed in the solid state. This connection thus forms the basis of the mini project, which aims to examine the electronics of the two molybdenum systems in an attempt to rationalise their reported structures and bonding. More specifically, MO and NBO analyses will be performed at the B3LYP level in addition to structure optimisation and frequency analysis.
Geometry Optimisation
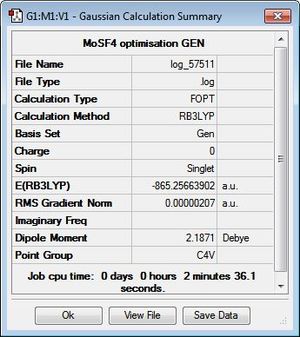
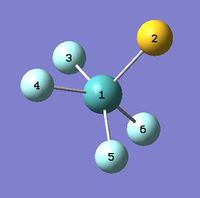
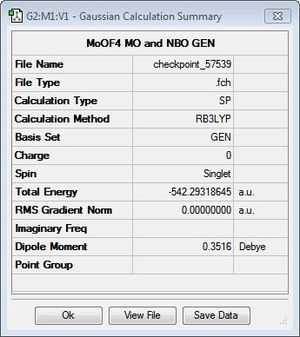
The structures of MoSF4 and MoOF4 were optimised using the B3LYP/GEN method, applying the pseudo-potential, LANL2DZ, to the molybdenum centre and the 6-31 + g(d) basis set to the fluorine and sulphur/oxygen atoms. It is found that, while necessary for the heavy metal centre, the pseudo-potential is not suitable for sulphur systems, thus applying a full electron basis set for these atoms. Additionally, given the accuracy of the pseudo-potential and basis set, tighter convergence criteria was set, to ensure the success of the optimisation. Figures 15 and 16 display the calculation summaries. The .log files and optimised structures can be found here: MoSF4 structure, MoSF4 log file, MoOF4 structure and MoOF4 log file.
 |
 |
Despite the near-zero values of the RMS gradient, the .log files were inspected to ensure the optimisation was indeed successful.
MoSF4:
         Item               Value     Threshold  Converged?
 Maximum Force            0.000005     0.000450     YES
 RMS     Force            0.000001     0.000300     YES
 Maximum Displacement     0.000019     0.001800     YES
 RMS     Displacement     0.000006     0.001200     YES

Predicted change in Energy=-6.913531D-11
 Optimization completed.
    -- Stationary point found.
----------------------------
                           !   Optimized Parameters   !
                           ! (Angstroms and Degrees)  !
 --------------------------                            --------------------------
 ! Name  Definition              Value          Derivative Info.                !
 --------------------------------------------------------------------------------
 ! R1    R(1,2)                  2.0849         -DE/DX =    0.0                 !
 ! R2    R(1,3)                  1.867          -DE/DX =    0.0                 !
 ! R3    R(1,4)                  1.867          -DE/DX =    0.0                 !
 ! R4    R(1,5)                  1.867          -DE/DX =    0.0                 !
 ! R5    R(1,6)                  1.867          -DE/DX =    0.0                 !
 ! A1    A(2,1,3)              104.8934         -DE/DX =    0.0                 !
 ! A2    A(2,1,4)              104.8934         -DE/DX =    0.0                 !
 ! A3    A(2,1,5)              104.8934         -DE/DX =    0.0                 !
 ! A4    A(2,1,6)              104.8934         -DE/DX =    0.0                 !
 ! A5    A(3,1,4)               86.2123         -DE/DX =    0.0                 !
 ! A6    A(3,1,5)              150.2133         -DE/DX =    0.0                 !
 ! A7    A(3,1,6)               86.2123         -DE/DX =    0.0                 !
 ! A8    A(4,1,5)               86.2123         -DE/DX =    0.0                 !
 ! A9    A(4,1,6)              150.2133         -DE/DX =    0.0                 !
 ! A10   A(5,1,6)               86.2123         -DE/DX =    0.0                 !
 ! D1    D(2,1,4,3)            104.4142         -DE/DX =    0.0                 !
 ! D2    D(2,1,5,3)            180.0            -DE/DX =    0.0                 !
 ! D3    D(2,1,6,3)           -104.4142         -DE/DX =    0.0                 !
 ! D4    D(2,1,5,4)            104.4142         -DE/DX =    0.0                 !
 ! D5    D(2,1,6,4)            180.0            -DE/DX =    0.0                 !
 ! D6    D(2,1,6,5)            104.4142         -DE/DX =    0.0                 !
 ! D7    D(3,1,5,4)            -75.5858         -DE/DX =    0.0                 !
 ! D8    D(3,1,6,4)            -75.5858         -DE/DX =    0.0                 !
 ! D9    D(3,1,6,5)           -151.1716         -DE/DX =    0.0                 !
 ! D10   D(4,1,6,5)            -75.5858         -DE/DX =    0.0                 !
 --------------------------------------------------------------------------------
MoOF4:

         Item               Value     Threshold  Converged?
 Maximum Force            0.000416     0.000450     YES
 RMS     Force            0.000091     0.000300     YES
 Maximum Displacement     0.000545     0.001800     YES
 RMS     Displacement     0.000133     0.001200     YES

Predicted change in Energy=-1.958938D-07
 Optimization completed.
    -- Stationary point found.
----------------------------
                           !   Optimized Parameters   !
                           ! (Angstroms and Degrees)  !
 --------------------------                            --------------------------
 ! Name  Definition              Value          Derivative Info.                !
 --------------------------------------------------------------------------------
 ! R1    R(1,2)                  1.8604         -DE/DX =    0.0                 !
 ! R2    R(1,3)                  1.8604         -DE/DX =    0.0                 !
 ! R3    R(1,4)                  1.8604         -DE/DX =    0.0                 !
 ! R4    R(1,5)                  1.8604         -DE/DX =    0.0                 !
 ! R5    R(1,6)                  1.6733         -DE/DX =   -0.0004              !
 ! A1    A(2,1,3)               85.9866         -DE/DX =    0.0                 !
 ! A2    A(2,1,4)              149.3189         -DE/DX =   -0.0001              !
 ! A3    A(2,1,5)               85.9866         -DE/DX =    0.0                 !
 ! A4    A(2,1,6)              105.3406         -DE/DX =    0.0                 !
 ! A5    A(3,1,4)               85.9866         -DE/DX =    0.0                 !
 ! A6    A(3,1,5)              149.3189         -DE/DX =   -0.0001              !
 ! A7    A(3,1,6)              105.3406         -DE/DX =    0.0                 !
 ! A8    A(4,1,5)               85.9866         -DE/DX =    0.0                 !
 ! A9    A(4,1,6)              105.3406         -DE/DX =    0.0                 !
 ! A10   A(5,1,6)              105.3406         -DE/DX =    0.0001              !
 ! D1    D(2,1,4,3)            -75.1815         -DE/DX =    0.0                 !
 ! D2    D(2,1,5,3)            -75.1815         -DE/DX =    0.0                 !
 ! D3    D(2,1,6,3)             90.0            -DE/DX =    0.0                 !
 ! D4    D(2,1,5,4)           -150.3631         -DE/DX =    0.0001              !
 ! D5    D(2,1,6,4)            180.0            -DE/DX =    0.0                 !
 ! D6    D(2,1,6,5)            -90.0            -DE/DX =    0.0                 !
 ! D7    D(3,1,5,4)            -75.1815         -DE/DX =    0.0                 !
 ! D8    D(3,1,6,4)             90.0            -DE/DX =    0.0                 !
 ! D9    D(3,1,6,5)            180.0            -DE/DX =    0.0                 !
 ! D10   D(4,1,6,5)             90.0            -DE/DX =    0.0                 !
 --------------------------------------------------------------------------------
The text files above confirm the convergence of both systems upon optimisation of the structures. It is interesting to note the difference in energies and dipole moments of the two complexes, as shown in Figures 15 and 16, despite sulphur and oxygen being part of the same group. This observation will be examined further upon analysis of the calculated MOs and NBOs of the systems. In addition, it can be seen that, despite the Mo-F bond lengths being similar for both complexes, the Mo-O bond lengths is markedly shorter than the Mo-S bond length. Again, this is will be investigated further using the calculated NBO analysis.
In an attempt to test the accuracy of the calculated data, the computed bond lengths and angles of MoSF4 were compared to those reported by Nieboer et. al (see Table 4).
| Bond | Calculated value | Lit. calculated value | Lit. experimental value |
|---|---|---|---|
| Mo-S | 2.08 Å | 2.08 Å | 2.06 - 2.07 Å |
| Mo-F | 1.87 Å | 1.85 Å | 1.81 - 1.85 Å |
| F-Mo-S | 104.9° | 105.4° | 96.7° - 101.7° |
| F-Mo-F | 86.2° | 86.0° | 89.6° - 92.9° |
As shown, the values calculated for the bond lengths and angles are consistent with those computed in literature, supporting the pseudo-potential and basis set chosen to model the system. This agreement, however, is weaker for the experimental values, which may be attributed to the fact that these measured values are based on the solid state structure of MoSF4 and, hence, are subject to certain forces and errors that are likely to be disregarded by computational methods.
Frequency Analysis
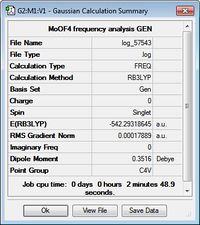
As done previously, frequency analysis was performed on both systems to ensure that a minimum has indeed been reached during the optimisation and to obtain the IR spectra of the complexes. The DFT method employed in the structure optimisation was kept consistent for this calculation. For reference, the .log files of the frequency analysis can be found here: MoSF4 frequency log file, MoOF4 frequency log file.
 |
 |
 |
 |
The non-zero values of the vibrations in both systems confirm the successful optimisation of both molybdenum complexes.
| Entry | Mode of Vibration | Frequency
(cm-1) |
Lit. Frequency
(cm-1)[13] |
Intensity of Absorption | Symmetry Label
of Vibration |
Diagram |
|---|---|---|---|---|---|---|
| 1 | Asymmetrical MoF4 stretching | 720.60 | 704 | 266.43 | E | 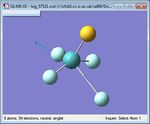 |
| 2 | Asymmetrical MoF4 stretching | 720.60 | 704 | 266.43 | E | 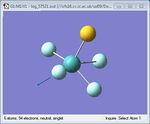 |
| 3 | In- plane MoF4 stretching | 708.28 | 701 | 112.19 | A1 |  |
| 4 | Symmetrical MoF4 stretching | 598.51 | 596 | 0.00 | B2 | 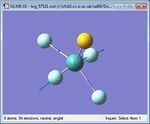 |
| 5 | Mo=S stretch | 592.85 | 605 | 26.00 | A1 | 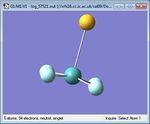 |
| 6 | MoF4 scissoring | 319.45 | 331 | 0.00 | B2 | 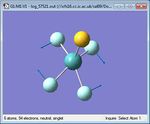 |
| 7 | Umbrella deformation | 250.92 | 257 | 3.16 | A1 | 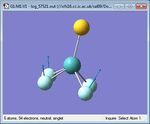 |
| 8 | In-plane bending | 228.04 | 242 | 17.01 | E |  |
| 9 | In-plane bending | 228.04 | 242 | 17.01 | E | 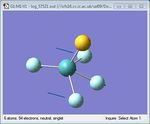 |
| 10 | MoSF4 rocking | 202.09 | 208 | 0.68 | E | 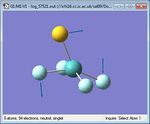 |
| 11 | MoSF4 rocking | 202.09 | 208 | 0.68 | E |  |
| 12 | MoF4 out-of-plane bending | 116.34 | 115 | 0.00 | B1 | 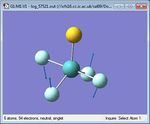 |
| Entry | Mode of Vibration | Frequency
(cm-1) |
Lit. Frequency
(cm-1)[14] |
Intensity of Absorption | Symmetry Label
of Vibration |
Diagram |
|---|---|---|---|---|---|---|
| 1 | M=O stretch | 1082.06 | 1044 | 124.19 | A1 |  |
| 2 | Asymmetrical MoF4 stretching | 736.50 | - | 287.17 | E | 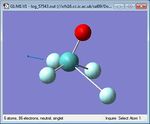 |
| 3 | Asymmetrical MoF4 stretching | 736.50 | - | 287.17 | E | 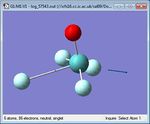 |
| 4 | In-plane MoF4 stretching | 726.45 | 711 | 40.73 | A1 |  |
| 5 | Symmetrical MoF4 stretching | 617.45 | - | 0.00 | B2 | 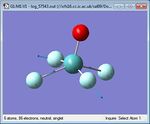 |
| 6 | MoF4 scissoring | 327.90 | - | 0.00 | B2 |  |
| 7 | MoOF4 rocking | 294.42 | - | 6.54 | E | 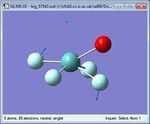 |
| 8 | MoOF4 rocking | 294.42 | - | 6.54 | E | 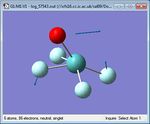 |
| 9 | Umbrella deformation | 259.34 | - | 11.36 | A1 |  |
| 10 | MoF4 in-plane bending | 232.31 | - | 19.15 | E | 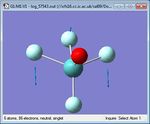 |
| 11 | MoF4 in-plane bending | 232.31 | - | 19.15 | E |  |
| 12 | MoF4 out-of-plane bending | 93.44 | - | 0.00 | B1 |  |
Given that the absorptions of the MoF4 moiety is similar for both systems, the particular motions that will be examined will be those of the Mo=S and Mo=O bonds. As evident from the tables above, it is clear that the Mo=O stretch occurs at a much higher frequency than the Mo=S stretch, suggesting that the former bond is stronger. This is consistent with the observation noted above of a significantly shorter Mo=O bond. This is not expected given the fact that sulphur contains empty d orbitals that can accept electron density from the metal, strengthening the bond. The NBO analysis performed may perhaps be used to rationalise this.
MO Analysis
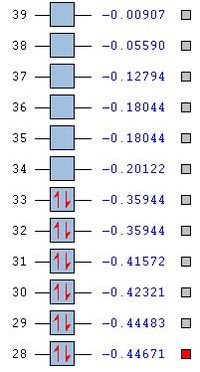
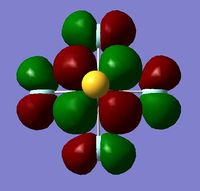
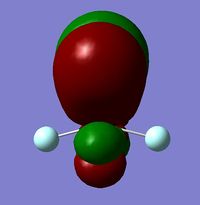
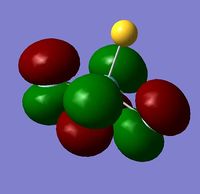
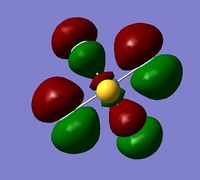
In an attempt to investigate the electron density along the Mo=O/S bond, MO and NBO analysis was carried out simultaneously. The tables below display some of the calculated MOs of both complexes (LUMO+5 - HOMO-5) and the .log files for the analyses can be found here: MoSF4 MO log file and MoOF4 MO log file.
 |
 |
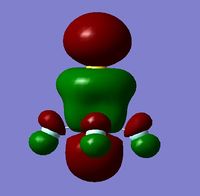
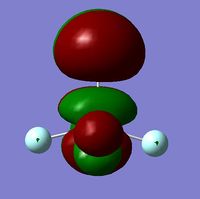
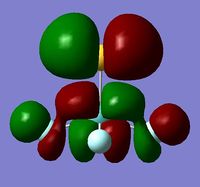
Again, the MOs of both complexes appear to generally be similar, particularly the HOMO and the LUMO, suggesting that the reactivity of MoSF4 and MoOF4 will, thus, be similar. However, what can be seen by comparison of the HOMO-4 and HOMO-5 orbitals of both complexes is that there appears to be greater electron delocalisation along the Mo=O bond onto the oxygen. MoSF4, on the other hand, appears to have most of the electron density localised on the MoF4 moiety. This may rationalise the shorter Mo=O bond in comparison to the Mo=S bond. This electron delocalisation may also be used to explain the lower energy of the MoOF4 complex, as calculated in the structure optimisation.
NBO Analysis
 |
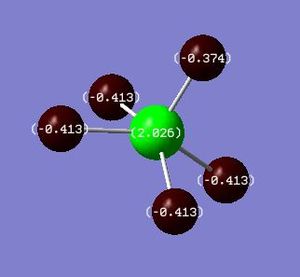 |
From the table above, the charge distribution of the complexes, particularly along the Mo=O/S bond is as expected based on the electronegativities of the atoms. Given that oxygen is more electronegative (thus, giving rise to a larger dipole moment), it is reasonable to predict that the molybdenum centre will be more positively charged in this complex, compared to that in MoSF4. It is interesting to note, however, that despite sulphur being more electronegative than the molybdenum centre, it is not as negatively charged as one might expect, such as in the case of oxygen. This may be due to the fact that the MOs of MoOF4 exhibit electron density on the oxygen atom but not on the sulphur atom for MoSF4, as alluded to previously.
Despite the difference in charge distribution for oxygen and sulphur in the two complexes, it remains that the molybdenum centre is electron deficient in both cases. This serves to rationalise the polymeric structure the complexes adopt in the solid state, as observed by Nieboer et. al.
References
- ↑ K. Kawaguchi, J. Chem. Phys., 1992, 96, 3411; DOI:10.1063/1.461642
- ↑ K. Kawaguchi, J. E. Butler, C. Yamada, S. H. Bauer, T. Minowa, H. Kanamori, E. Hirota, J. Chem. Phys., 1987, 87, 2438; DOI:10.1063/1.453135
- ↑ DOI:10042/to-13012
- ↑ DOI:10042/to-13012
- ↑ P. Schwerdtfeger, J. Ischtwan, J. Comput. Chem., 1993, 14, 913; DOI:10.1002/jcc.540140806
- ↑ P. Schwerdtfeger, J. Ischtwan, J. Comput. Chem., 1993, 14, 913; DOI:10.1002/jcc.540140806
- ↑ DOI:10042/to-13058
- ↑ DOI:10042/to-13060
- ↑ DOI:10042/to-13073
- ↑ DOI:10042/to-13074
- ↑ J. Nieboer, J. P. Mack, H. P. A. Mercier, M. Gerken, Inorg. Chem., 2010, 49, 6153; DOI:10.1021/ic100766d
- ↑ J. Nieboer, J. P. Mack, H. P. A. Mercier, M. Gerken, Inorg. Chem., 2010, 49, 6153; DOI:10.1021/ic100766d
- ↑ J. E. D. Davies, D. A. Long, J. Chem. Soc. A, 1968, 2050; DOI:10.1039/J19680002050
- ↑ J. E. D. Davies, D. A. Long, J. Chem. Soc. A, 1968, 2050; DOI:10.1039/J19680002050

