
Rep:Mod:Td81121
BH3 molecule Optimisation
The molecule BH3 was optimised using two different basis: 3-21G and 6-31G(d,p). Thereafter, the energy values obtained from both methods were compared.
3-21G Basis Set
[BH3 3-21G optimisation log file]
| Property | Value |
|---|---|
| File Name | TC_bh3_opt |
| File Type | .log |
| Calculation Type | FOPT |
| Calculation Method | RB3LYP |
| Basis Set | 3-21G |
| Charge | 0 |
| Spin | Singlet |
| Energy | -26.46226429 a.u. |
| RMS Gradient Norm | 0.00008851 a.u. |
| Dipole Moment | 0.00 D |
| Point Group | CS |
| Computational Time | 32.5 sec |
Item               Value     Threshold  Converged?
 Maximum Force            0.000220     0.000450     YES
 RMS     Force            0.000106     0.000300     YES
 Maximum Displacement     0.000709     0.001800     YES
 RMS     Displacement     0.000447     0.001200     YES
 Predicted change in Energy=-1.672479D-07
 Optimization completed.
6-31G Basis Set
[BH3 - 6-31G(d,p) optimisation log file]
| Property | Value |
|---|---|
| File Name | TC_bh3_opt_631g_dp |
| File Type | .log |
| Calculation Type | FOPT |
| Calculation Method | RB3LYP |
| Basis Set | 6-31G(d,p) |
| Charge | 0 |
| Spin | Singlet |
| Energy | -26.61532358 a.u. |
| RMS Gradient Norm | 0.00008207 a.u. |
| Dipole Moment | 0.00 D |
| Point Group | CS |
| Computational Time | 4sec |
Item               Value     Threshold  Converged?
 Maximum Force            0.000204     0.000450     YES
 RMS     Force            0.000099     0.000300     YES
 Maximum Displacement     0.000875     0.001800     YES
 RMS     Displacement     0.000418     0.001200     YES
 Predicted change in Energy=-1.452205D-07
 Optimization completed.
| Property | Value |
|---|---|
| BH3 optimised bond length | 1.19 Å |
| BH3 optimised H-B-H bond angle | 120.0o |
The literature value for the BH bond length is quoted to be 1.190 Å. [1] The computed bond length is in good agreement with the literature value.
Total Energies
| Method | Energy |
|---|---|
| 3-21G | -26.46226429 a.u. |
| 6-31G(d,p) | -26.61532358 a.u. |
The calculated energies are different as different methods have been for the optimisation process. The 6-31G(d,p) incorporates more functions and so would give a better measure of the real energy value.
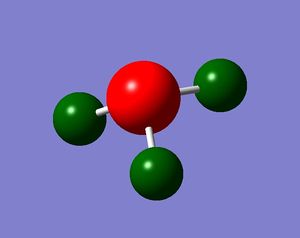
GaBr3 Optimisation
The optimisation of GaBr3 was carried out using a different basis set as the molecule has far larger electron density then the previous boron molecules. The chosen basis set was LanL2DZ, which sets the core electrons to an accurate constant (therefore modelled by a function called pseudo-potential) and performs optimisation on the valence electrons using the 6-31G basis set.
[GaBr3 LanL2DZ optimisation D-space Link] [GaBr3 LanL2DZ optimisation .Log file]
| Property | Value |
|---|---|
| File Name | TC_gabr3_opt_LanL2Dz |
| File Type | .log |
| Calculation Type | FOPT |
| Calculation Method | RB3LYP |
| Basis Set | LANL2DZ |
| Energy | -41.70082783.u. |
| RMS Gradient Norm | 0.00000016 a.u. |
| Dipole Moment | 0.00 D |
| Point Group | D3H |
         Item               Value     Threshold  Converged?
 Maximum Force            0.000000     0.000450     YES
 RMS     Force            0.000000     0.000300     YES
 Maximum Displacement     0.000003     0.001800     YES
 RMS     Displacement     0.000002     0.001200     YES
 Predicted change in Energy=-1.282680D-12
 Optimization completed.
| Property | Value |
|---|---|
| GaBr3 optimised bond length | 2.35 Å |
| GaBr3 optimised Br-Ga-Br bond angle | 120.0o |
Literature value - GaBr3 bond length: 2.239A [2]. This is slightly different could perhaps be imporved by using a larger basis set.
BBr3 Optimisation
In optimising the BBr3 molecule, the basis set "GEN" with the keyword "pseudo=read gfinput" was utilised which allows the ability to specify pseudo potentials for individual atoms. The 6-31G(d,p) basis set was used for boron and LanL2DZ was used for the bromine atoms.
[BBr3 GEN optimisation D-Space Link] [BBr3 GEN optimisation .log file]
| Property | Value |
|---|---|
| File Name | TC_bbr3_opt_GEN |
| File Type | .log |
| Calculation Type | FOPT |
| Calculation Method | RB3LYP |
| Basis Set | GEN |
| Energy | -64.43645355 a.u. |
| RMS Gradient Norm | 0.00001020 a.u. |
| Dipole Moment | 0.00 D |
| Point Group | CS |
Item Table
 Item               Value     Threshold  Converged?
 Maximum Force            0.000017     0.000450     YES
 RMS     Force            0.000010     0.000300     YES
 Maximum Displacement     0.000072     0.001800     YES
 RMS     Displacement     0.000043     0.001200     YES
 Predicted change in Energy=-1.759239D-09
 Optimization completed.
| Property | Value |
|---|---|
| BBr3 optimised bond length | 1.93 Å |
| BBr3 optimised Br-B-Br bond angle | 120.0o |
Literature value: 1.903 Å[3]. This reference value is in good agreement with the computed value and further enhances the reliability of the calculations.
Bond comparison of BH3 BBr3 and GaBr3
| Molecule | Bond Distance (Å) |
|---|---|
| BH3 | 1.19 |
| BBr3 | 1.93 |
| GaBr3 | 2.35 |
The bond distances of these compounds are compared and a discussion is outlined below.
Bond Distance Comparison
Changing The Ligand
Changing the ligand to a heavier ligand causes the bond length to increase and thus forming a weaker bond. Both hydrogen and bromine are X-type donors and donates 1 electron to the central atom in forming a bond. However, bromine has more electrons and thus larger orbitals and so forms longer and weaker bonds.
Changing The Central Atom
Changing the central atom to a heavier atom also causes the bond length to increase. Both boron and gallium are in group 13 and therefore forms 3 single bonds with 3 bromine atoms. However, as gallium is a bigger atom and therefore has a larger and more diffused orbitals compared to boron. This causes a weaker overlap between the central atom and ligand, resulting in weaker and longer bonds compared to the B-Br single bonds.
Bond Discission
Gaussview does not draw in bonds, where bonds might be expected
In some cases, gaussview does not draw in the bonds when they may be expected, this does not necessarily mean there is no bond. Gaussview draws bonds based on distance criteria and in some cases, the distances between atoms exceeds the pre-defined parameters, thus resulting in gaussview no drawing in bonds.
Definition of a Bond
A bond is a directional attraction between two atoms, normally an electrostatic attraction, that has a stabilising effect. In the case of covalent bonds, the valence electrons from both atoms are attracted to both nuclei and thus shared between the two nuclei and forming a covalent bond. In the case of ionic bonds, electron is transferred from an electropositive atom (normally a metal)to an electronegative atom, in doing so, the former forms a positive ion and the latter forms a negative ion. An ionic bond is therefore the electrostatic attraction between the two ions. A metallic bond is one where the metal atoms in the metal lattice donates electrons to the commonly shared 'sea of electrons', resulting in the attraction between the positive metal ion and the surrounding electrons. Weaker intermolecular bonding interactions also exists and these are due to dipole-dipole interactions. For example, differences in electronegativity between different atoms often causes the formation of dipoles, these difference in dipoles leads to dipole interactions between different molecules and can result in permanent dipoles such as hydrogen bonding (in the case of nitrogen, oxygen and fluorine) or temporary dipoles such as dispersion forces. Because of the type of interactions involved and the degree of attraction between atoms is also different. The relative strengths of the bonds, in decreasing order is covalent, ionic, metallic, hydrogen bonding, dipole-dipole interactions and london dispersion forces.
Frequency analysis for BH3 and BBr3
A couple of attempts to compute the frequency of BH3 were firstly carried out in order to obtain the appropriate low frequency required. Thereafter, the frequency analysis was performed for GaBr3 in order to compare the two different molecules.
Frequency Analysis for BH3
[BH3 initial frequency analysis log file]
| Property | Value |
|---|---|
| File Name | TC_bh3_freq |
| File Type | .log |
| Calculation Type | FREQ |
| Calculation Method | RB3LYP |
| Basis Set | 6-31G(d,p) |
| Energy | -26.61532358 a.u. |
| RMS Gradient Norm | 0.00008198 a.u. |
| Dipole Moment | 0.00 D |
| Point Group | CS |
Low frequencies ---    0.0005    0.0005    0.0011   33.8055   41.5584   43.6982
Low frequencies --- 1163.5017 1213.4677 1213.5865
The first line of the frequencies are far higher than the required low frequency values. Therefore, the optimisation calculations were performed again by constraining the BH3 geometry to D3H.
Optimisation using D3H point group
[BH3 (constrained geometry) frequency analysis log file ]
| Property | Value |
|---|---|
| File Name | TC_bh3_freq3 |
| File Type | .log |
| Calculation Type | FREQ |
| Calculation Method | RB3LYP |
| Basis Set | 6-31G(d,p) |
| Charge | 0 |
| Spin | Singlet |
| Energy | -26.61532363 a.u. |
| RMS Gradient Norm | 0.00000291 a.u. |
| Dipole Moment | 0.00 D |
| Point Group | D3H |
Item               Value     Threshold  Converged?
 Maximum Force            0.000006     0.000450     YES
 RMS     Force            0.000004     0.000300     YES
 Maximum Displacement     0.000023     0.001800     YES
 RMS     Displacement     0.000015     0.001200     YES
 Predicted change in Energy=-2.012165D-10
 Optimization completed.
 Low frequencies ---   -0.9432   -0.8611   -0.0054    5.7455   11.7246   11.7625
 Low frequencies --- 1162.9963 1213.1826 1213.1853
| No. | Form of vibration | Frequency | Intensity | Symmetry D3H point group |
|---|---|---|---|---|
| 1 |  |
1163 | 93 | A2 |
| 2 |  |
1213 | 14 | E' |
| 3 |  |
1213 | 14 | E' |
| 4 |  |
2582 | 0 | A1' |
| 5 |  |
2715 | 126 | E' |
| 6 |  |
2715 | 126 | E' |
IR spectrum

There are two sets of two vibrations with the same frequencies and therefore, they would overlap and only appear as a single peak. In addition, the vibration which is totally symmetrical does not have a dipole and hence does not show up in the IR spectrum. These factors result in the IR spectrum only showing 3 peaks where there are actually six vibrations.
Frequency analysis for GaBr3
[GaBr3 frequency analysis D-space link] [GaBr3 frequency analysis log file]
| No. | Form of vibration | Frequency (cm-1) | Intensity | Symmetry D3H point group |
|---|---|---|---|---|
| 1 |  |
76 | 3 | E' |
| 2 |  |
76 | 3 | E' |
| 3 |  |
100 | 10 | A2 |
| 4 |  |
197 | 0 | A1' |
| 5 |  |
316 | 57 | E' |
| 6 |  |
316 | 57 | E' |
Low frequencies ---   -0.5252   -0.5247   -0.0024   -0.0010    0.0235    1.2010
Low frequencies ---   76.3744   76.3753   99.6982
The lowest "real" normal mode of vibrations are the 76 cm-1 frequency vibrations, corresponding to the first two degenerate E' modes of vibration.
IR spectrum

There are six vibrational modes but only three peaks visible on the IR spectrum. This is because some of the vibrations are degenerate in energy (vibration 1 & 2 and vibrations 5 & 6) and so show up as a single peak. The forth vibration has no particular dipole moment, as such does not have a signal in the IR spectrum.
Vibration comparisons
| No. | BH3 vibrational frequencies (cm-1) | GaBr3 vibrational frequencies (cm-1) |
|---|---|---|
| 1 | 1164 | 76 |
| 2 | 1213 | 76 |
| 3 | 1213 | 100 |
| 4 | 2582 | 197 |
| 5 | 2715 | 316 |
| 6 | 2715 | 316 |
The large differences in frequency values of BH3 compared to GaBr3 indicate that the GaBr3 bonds are much weaker. As suggested before the large difference between electronegativities contribute to enhanced electrostatic attraction between B and H and hence affording stronger bonds.
Although the two spectra are similar in that they both have three peaks, an reordering of modes can also be observed, in particular, the A2 level for GaBr3 higher in energy then its E' energy level, whereas the opposite can be seen for the BH3 molecule. This is likely to be due to differences in the size of the atoms. For example, in the BH3 molecule, the central atom boron is heavier than hydrogens and therefore, the substituent atoms, i.e. hydrogens, move with the central atom staying relatively stationary for the A2 level. The case is reversed for the GaBr3 molecule, in that the central atom is lighter than its substituent atoms and thus, the central atom vibrate more with the heavier bromine substituents relatively more stationary in the A2 level. This difference lead to the shift in relative energies compared to their relative E' levels and hence a reordering can be seen. The vibrational frequency can be calculated using the equation:
where k is the force constant for the restoring force:
Therefore, when comparing a molecule's vibrational frequency, because a particular vibrational motion would need less force to restore, the force constant would be lower and hence the vibrational frequency would be less.
In addition, it can be seen that for both the spectra, two modes lie fairly close together, the A2 and E', and another two modes, the A1' and E' lie fairly close together but higher in energy. This is because for the first set of vibrations the type of vibration are all bending of the bonds, whereas, in the higher energy set of frequencies the type of vibration are all stretching vibrations. Similar type of vibration leads to similar vibrational frequencies, therefore, two sets of two modes of vibration can be seen, where one set of vibrations is close to each other and another is close to each other but higher in energy.
Nevertheless, both IR spectra exhibit the same number of modes, this is due to both molecules having the same symmetry and same number of atoms (where vibrational modes is governed by 3N-6, N=4).
The same method and basis for both the optimisation and frequency analysis much be used as the assumptions used by the one may not be compatible with the other and for both to afford correctly calculated values, the same inputs needs to be used.
The purpose of carrying out an frequency analysis is that, by investigating the frequency using computational methods, the result can be used to compare with experimental results and thus offering a higher reliability of the overall result. Also, it may be in some cases that, experimental means are not easily accessible and so computational calculations can be seen as a possible alternative method of investigation.
The top line of the low frequencies represent the translational and rotational degrees of freedom, corresponding to motion in the x, y and z axes. The bottom line of low frequencies represent the vibrational frequencies.
Molecular Orbitals of BH3
A population analysis was carried out using the previously optimised BH3 molecule with 631G(d,p) with keywords "pop=full, opt=tight, int=ultrafine, scf=conver=9"
[BH3 population analysis D-space link] [BH3 population analysis log file]
.jpg)
The LCAO MOs as predicted by the MO theory are similar to the real MO as computed by gaussian. This indicates that, while MO theory may be limited in cases where the molecule is relatively complicated, for the case of simple molecules such as BH3, MO theory is generally accurate.
NH3 Computational Analysis
Computational study of the NH3 molecule was carried out in order to perform an NBO analysis.
Optimisation
The optimisation of the NH3 molecule was performed using the 6-31G(d,p) basis set with the keywords "opt=tight, int=ultrafine, scf=conver=9"
| Property | Value |
|---|---|
| File Name | NH3_opt_631G_d_p |
| File Type | .log |
| Calculation Type | FOPT |
| Calculation Method | RB3LYP |
| Basis Set | 6-31G(d,p) |
| Charge | 0 |
| Spin | Singlet |
| Energy | -56.55776873 a.u. |
| RMS Gradient Norm | 0.00000323 a.u. |
| Dipole Moment | 1.85 D |
| Point Group | C3V |
| Computational Time | 29.8 Sec |
         Item               Value     Threshold  Converged?
 Maximum Force            0.000006     0.000015     YES
 RMS     Force            0.000004     0.000010     YES
 Maximum Displacement     0.000012     0.000060     YES
 RMS     Displacement     0.000008     0.000040     YES
 Predicted change in Energy=-9.846059D-11
 Optimization completed.
    -- Stationary point found.
Frequency Analysis
The frequency analysis of the NH3 molecule was carried out using the above optimised molecule with the keywords "opt=tight, int=ultrafine, scf=conver=9".
[NH3Frequency Analysis log file]
 Low frequencies ---   -0.0129   -0.0016   -0.0012    7.0768    8.0933    8.0936
 Low frequencies --- 1089.3840 1693.9368 1693.9368
| No. | Form of vibration | Frequency (cm-1) | Intensity | Symmetry of C1 point group |
|---|---|---|---|---|
| 1 |  |
1089 | 145 | A1 |
| 2 |  |
1694 | 14 | E |
| 3 |  |
1694 | 14 | E |
| 4 |  |
3461 | 1 | A1 |
| 5 |  |
3590 | 0 | E |
| 6 |  |
3590 | 0 | E |
IR Spectrum

NH3 IR spectrum shows two peaks only, whereas there are 6 modes of vibration. This is due to two of the modes of vibration having similar vibrations and the fact that 3 of the modes have no dipole moment and hence does not give a signal in the IR spectra.
NH3 NBO
The NBO analysis was carried out using the above optimised molecule with the keywords "pop=full, opt=tight, int=ultrafine, scf=conver=9"
Colour Atom by Charge
It can be seen that the majority of the negative charge is resident on the nitrogen atom. This is expected as nitrogen is the atom with the relatively higher electronegativity value.
Charge range: -1.125 to 1.125
Charge Number Shown

The charge number for the various atoms are shown above (N: -1.125; H: 0.375 each). It can also be seen that the sum of all the charges adds up to zero, in accordance with NH3 being a neutral molecule.
Information from the .log file
Additional information from the NBO analysis .log file were also investigated.
Summary of natural population analysis
    Natural Population
                Natural  -----------------------------------------------
    Atom  No    Charge         Core      Valence    Rydberg      Total
 -----------------------------------------------------------------------
      N    1   -1.12514      1.99982     6.11104    0.01429     8.12514
      H    2    0.37505      0.00000     0.62250    0.00246     0.62495
      H    3    0.37505      0.00000     0.62250    0.00246     0.62495
      H    4    0.37505      0.00000     0.62250    0.00246     0.62495
 =======================================================================
   * Total *    0.00000      1.99982     7.97852    0.02166    10.00000
The electron density is outlined above and the majority of electrons are seen to be from nitrogen, as the nitrogen donates electron density and act of a Lewis base whereas hydrogen accepts electrons and act as a Lewis acid.
Bond orbital/Coefficient/Hydride
       (Occupancy)   Bond orbital/ Coefficients/ Hybrids
 ---------------------------------------------------------------------------------
     1. (1.99909) BD ( 1) N   1 - H   2
                ( 68.83%)   0.8297* N   1 s( 24.86%)p 3.02( 75.05%)d 0.00(  0.09%)
                                            0.0001  0.4986  0.0059  0.0000  0.0000
                                            0.0000  0.8155  0.0277 -0.2910  0.0052
                                            0.0000  0.0000 -0.0281 -0.0087  0.0014
                ( 31.17%)   0.5583* H   2 s( 99.91%)p 0.00(  0.09%)
                                            0.9996  0.0000  0.0000 -0.0289  0.0072
     2. (1.99909) BD ( 1) N   1 - H   3
                ( 68.83%)   0.8297* N   1 s( 24.86%)p 3.02( 75.05%)d 0.00(  0.09%)
                                            0.0001  0.4986  0.0059  0.0000 -0.7062
                                           -0.0239 -0.4077 -0.0138 -0.2910  0.0052
                                            0.0076  0.0243  0.0140  0.0044  0.0014
                ( 31.17%)   0.5583* H   3 s( 99.91%)p 0.00(  0.09%)
                                            0.9996  0.0000  0.0250  0.0145  0.0072
     3. (1.99909) BD ( 1) N   1 - H   4
                ( 68.83%)   0.8297* N   1 s( 24.86%)p 3.02( 75.05%)d 0.00(  0.09%)
                                            0.0001  0.4986  0.0059  0.0000  0.7062
                                            0.0239 -0.4077 -0.0138 -0.2910  0.0052
                                           -0.0076 -0.0243  0.0140  0.0044  0.0014
                ( 31.17%)   0.5583* H   4 s( 99.91%)p 0.00(  0.09%)
                                            0.9996  0.0000 -0.0250  0.0145  0.0072
     4. (1.99982) CR ( 1) N   1           s(100.00%)
                                            1.0000 -0.0002  0.0000  0.0000  0.0000
                                            0.0000  0.0000  0.0000  0.0000  0.0000
                                            0.0000  0.0000  0.0000  0.0000  0.0000
     5. (1.99721) LP ( 1) N   1           s( 25.38%)p 2.94( 74.52%)d 0.00(  0.10%)
                                            0.0001  0.5036 -0.0120  0.0000  0.0000
                                            0.0000  0.0000  0.0000  0.8618 -0.0505
                                            0.0000  0.0000  0.0000  0.0000 -0.0310
The information highlights that the electrodensity in the bond are mostly from the nitrogen (~70% from nitrogen, ~30 from H)
Second Order Perturbation Theory Analysis of Fock Matrix in NBO Basis
 Second Order Perturbation Theory Analysis of Fock Matrix in NBO Basis

     Threshold for printing:   0.50 kcal/mol
As the threshold for printing is below 20 kcal/mol, the information about interaction from bonding NBOs into non-bonding or antibonding orbitals is not of interest.
Natural Bond Orbital Summary
 Natural Bond Orbitals (Summary):

                                                            Principal Delocalizations
           NBO                        Occupancy    Energy   (geminal,vicinal,remote)
 ====================================================================================
 Molecular unit  1  (H3N)
     1. BD (   1) N   1 - H   2          1.99909    -0.60417
     2. BD (   1) N   1 - H   3          1.99909    -0.60417
     3. BD (   1) N   1 - H   4          1.99909    -0.60417
     4. CR (   1) N   1                  1.99982   -14.16768
     5. LP (   1) N   1                  1.99721    -0.31757  16(v),20(v),24(v),17(v)
                                                    21(v),25(v)
The relative energies of the N-H bonds, the lone pair and core orbitals can be seen. The core orbital is very higher in energy and as such are often left off the MO diagram.
NH3BH3 Computational Anlysis
The optimisation, frequency analysis were completed in order to calculated the association energy for combining a molecule of NH3 with one of BH3.
Optimisation
The optimisation of NH3BH3 was completed using the basis set 6-31G(d,p) with the keywords "opt=tight, int=ultrafine, scf=conver=9".
[NH3BH3 optimisation analysis file]
| Property | Value |
|---|---|
| File Name | TC_NH3BH3_opt_631g_d_p_opt_int_scf |
| File Type | .log |
| Calculation Type | FOPT |
| Calculation Method | RB3LYP |
| Basis Set | 6-31G(d,p) |
| Charge | 0 |
| Spin | Singlet |
| Energy | -83.22468906 a.u. |
| RMS Gradient Norm | 0.00000124 a.u. |
| Dipole Moment | 5.56 D |
| Point Group | C1 |
| Calculation time | 3 min 53.3 sec |
  Item               Value     Threshold  Converged?
 Maximum Force            0.000002     0.000015     YES
 RMS     Force            0.000001     0.000010     YES
 Maximum Displacement     0.000026     0.000060     YES
 RMS     Displacement     0.000009     0.000040     YES
 Predicted change in Energy=-8.958388D-11
 Optimization completed.
    -- Stationary point found.
Frequency Analysis
The frequency analysis of NH3BH3 was carried out using the above optimised molecule with the keywords "opt=tight, int=ultrafine, scf=conver=9".
[NH3BH3 Frequency Analysis file]
 Low frequencies ---   -6.5596   -2.8712   -0.0003    0.0008    0.0009    5.6712
 Low frequencies ---  263.5388  632.9505  638.4074
| No. | Form of the vibration | Frequency (cm-1) | Intensity |
|---|---|---|---|
| 1 |  |
264 | 0 |
| 2 |  |
633 | 14 |
| 3 |  |
638 | 4 |
| 4 |  |
638 | 4 |
| 5 |  |
1069 | 41 |
| 6 |  |
1069 | 41 |
| 7 |  |
1196 | 109 |
| 8 |  |
1204 | 3 |
| 9 |  |
1204 | 3 |
| 10 |  |
1329 | 114 |
| 11 |  |
1676 | 28 |
| 12 |  |
1676 | 28 |
| 13 |  |
2472 | 67 |
| 14 |  |
2532 | 231 |
| 15 |  |
2532 | 231 |
| 16 |  |
3464 | 3 |
| 17 |  |
3581 | 28 |
| 18 |  |
3581 | 28 |
NH3BH3 IR Spectrum
Below is the IR spectrum from the frequency analysis calculations.

Association Energy
An analysis of the association energy for combining a molecule of NH3 with one of BH3 is outlined below:
| Molecule | Energy (a.u.) |
|---|---|
| BH3 | -26.61532358 |
| NH3 | -56.55776873 |
| NH3BH3 | -83.22468906 |
The bond energy is the energy difference between the reactants and products. This can be calculated according to the equation:
The energy value can be converted from AU to kJ/mol by multiplying the AU energy value by Na and a factor of 4.359810x10⁻¹⁸ and dividing by 1000:
The calculated bond energy is reasonable as it is within the range of normal bond energies, i.e. within the range of ~100 kJ/mol - ~500kJ/mol. In addition, the calculated value is negative, which indicate that the process of forming NH3 is favourable and therefore spontaneous process. The bond energy is +135.49 kJ/mol.
References
- ↑ K. Kawaguchi, J Chem Phys , 1992, 96, 3411-3415 DOI: 10.1063/1.461942
- ↑ B. Reffy, M. Hargittai, M. Kolonits and B. Reffy, J. Mol. Struct., 1998 , 445, 139 - 148 DOI: 10.1016/S0022-2860(97)00420-1
- ↑ I. Krossing and G. Santiso-Quinones, Z. Anorg. Allg. Chem., 2008, 634, 4, 704 - 707 DOI: 10.1002/zaac.200700510