Rep:Mod:TW1C
Tingmang Wu's 1C Report
Part 1
The Hydrogenation of Cyclopentadiene Dimer
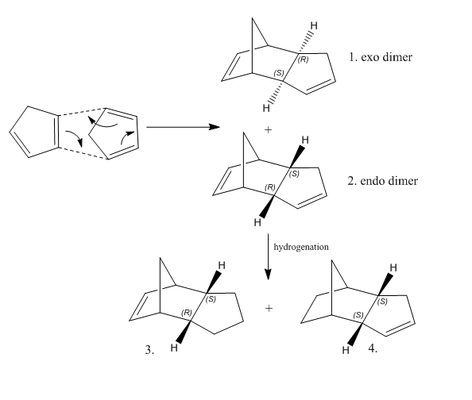
As shown on Scheme 1,at room temperature, it could be predicted that cyclopentadiene could undergo dimerisation rapaidly giving two possible dimers which are endo and exo. In fact, only one of the dimers will be formed, which is the endo. In order to investigate the reason that endo dimer is preferred, two dimers (Molecules 1 and 2) were drawn in ChemDraw with geometries optimised by Avogadro. Energy minima were worked out using the MMF94s force field and conjugate gradients algorithm. The hydrogenation of the endo dimer afford Molecules 3 and 4. Same optimisations as described above were also applied to molecule 3 and 4. The results were summarized in table 1.
| Molecules | 1 (kcal/mol) | 2 (kcal/mol) | 3 (kcal/mol) | 4 (kcal/mol) | ||||||||||||
|---|---|---|---|---|---|---|---|---|---|---|---|---|---|---|---|---|
| Geometries |
|
|
|
| ||||||||||||
| Total Bond Stretching Energy | 3.54155 | 3.46890 | 3.30628 | 2.82471 | ||||||||||||
| Total Angle Bending Energy | 30.77441 | 33.18922 | 31.97995 | 24.68561 | ||||||||||||
| Total Stretch-Bending Energy | -2.04053 | -2.08234 | -2.10217 | -1.65772 | ||||||||||||
| Total Torsional Energy | -2.73115 | -2.94945 | -1.51294 | -0.37796 | ||||||||||||
| Total Out-of-Plane Bending Energy | 0.01486 | 0.02193 | 0.01266 | 0.00027 | ||||||||||||
| Total VAN DER WAALS Energy | 12.80053 | 12.35804 | 13.64239 | 10.63555 | ||||||||||||
| Total Electrostatic Energy | 13.01379 | 14.18440 | 5.11961 | 5.14704 | ||||||||||||
| Total Energy | 55.37346 | 58.19070 | 50.44579 | 41.25751 |
Referring to table 1, the endo(Dimer 2) has a greater total energy than the exo(Dimer 1), which indicates that the endo is thermodynamically less stable than the exo. The greater total angle bending energy of endo reveals that its structure is more bending than that of the exo, which explains its angle measured is more deviated from ordinary sp2 carbon angle(120o ) and sp3 carbon angle(109.4o ) compared to those of the exo. However, cyclopentadiene dimerises giving specifically the endo dimer 2 rather than the exo dimer 1, therefore, the reaction is strictly kinetically controlled that affords less thermodynamically stable endo dimer according to Hammond postulate.
In comparison, Molecule 4 is more thermodynamically stable than Molecule 3, which mainly attributes to lower total angle bending energy. By looking at the measured angle, the bending angles of Molecule 3 have larger deviation from ordinary sp2 carbon angle(120o ) and sp3 carbon angle(109.4o ) than those of Molecule 4. Consequently, under thermodynamic control, the major product of Dimer 2 hydrogenation is Molecule 4.
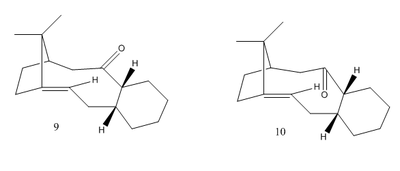
Referring to Paquette [1], Molecule 9 and 10 are two key intermediates in synthesis of Taxol. These two molecules are antropisomers, which only differ in orientation of the carbonyl group, and they can be converted onto each other.
In order to investigate which antropisomer is more stable, two molecules were drawn in ChemDraw with geometries optimised by Avogadro. Energy minima were worked out using the MMF94s force field and conjugate gradients algorithm. It was reported that alkene reacted abnormally slowly during subsequent functionalisation, hence suggested by Maier et al[2], hydrogenated products of Molecule 9 and 10 (Molecule 9* and 10*) were drawn and optimized with methods shown above. The results were summarized as Table 2.
| Molecules | 9 (kcal/mol) | 10 (kcal/mol) | 9* (kcal/mol) | 10* (kcal/mol) | ||||||||||||
|---|---|---|---|---|---|---|---|---|---|---|---|---|---|---|---|---|
| Geometries |
|
|
|
| ||||||||||||
| Total Bond Stretching Energy | 7.15853 | 7.13838 | 7.42181 | 6.49398 | ||||||||||||
| Total Angle Bending Energy | 23.08453 | 22.41210 | 28.19522 |
21.46097 | ||||||||||||
| Total Stretch-Bending Energy | -0.29174 | -0.24364 | 0.15451 | 0.21131 | ||||||||||||
| Total Torsional Energy | 3.45643 | -1.90152 | 8.53543 | 12.52149 | ||||||||||||
| Total Out-of-Plane Bending Energy | 0.98053 | 0.67824 | 0.28534 | 0.18833 | ||||||||||||
| Total VAN DER WAALS Energy | 33.10543 | 32.12839 | 34.10091 |
32.30608 | ||||||||||||
| Total Electrostatic Energy | 0.22844 | 0.82482 | 0.00000 |
0.00000 | ||||||||||||
| Total Energy | 67.72216 | 61.03678 | 78.69321 |
73.18217 |
According to the Table 2, the Molecule 10 has a lower total energy than Molecule 9, hence Molecule 10 is more stable. The relative stability mainly attributes to the total torsional energy, which means that Molecule 9 has more torsional strain, possibly due to the clash between between methyl group and carbonyl group.
On the other hand, by comparing Molecule 9 and 10 to their hydrogenated products 9* and 10* respectively, it could be obtained that both of the hydrogenated products have higher total energies, mainly attributes to increase in total angle bending energies or total torsional energies. By invoking the concept of a "hyperstable alkene", the alkenes are stabilized when the double bonds are at the bridgehead location, hence are more thermodynamically stable than other isomers, In other words, they are remarkably inert. The bridgehead alkene gives the hyperstability which decreases the energy from trans-annular interactions of its hydrogenated product, which is a saturated alkane. Again, the total energy of the alkenes are low, therefore hydrogenation are unfavourable.
Spectroscopic Simulation using Quantum Mechanics
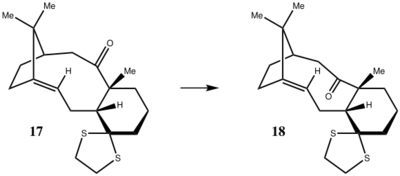
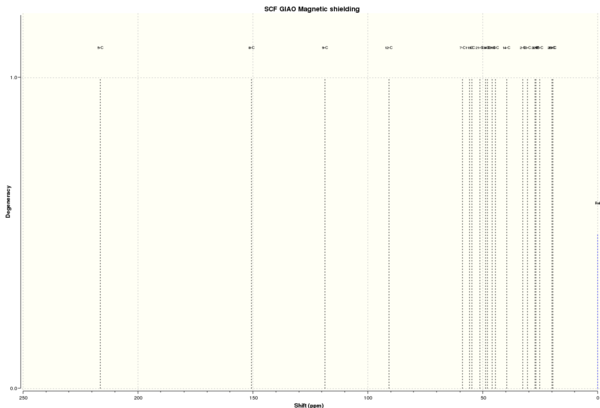
Molecule 17 (Scheme 3) were drawn and optimized by Avogadro with energy minimized. The geometry at the denisty functional level was calculated using Gaussian. 13C and 1H NMR spectra were simulated under B3LYP theory and 6-31G(d,p) basis, with chloroform as the solvent (Figure 1 and 2) (DOI:10042/27494 ). The chemical shifts of two spectra were summarized in Table 3 and 4.
| Shift (ppm) | Degeneracy | Atoms |
| 216.3934000000 | 1.0000 | 5 |
| 150.6715000000 | 1.0000 | 8 |
| 118.6185000000 | 1.0000 | 9 |
| 90.7563000000 | 1.0000 | 12 |
| 58.7623000000 | 1.0000 | 7 |
| 55.8272000000 | 1.0000 | 11 |
| 54.6872000000 | 1.0000 | 3 |
| 51.2235000000 | 1.0000 | 21 |
| 48.7909000000 | 1.0000 | 13 |
| 47.9213000000 | 1.0000 | 4 |
| 45.8486000000 | 1.0000 | 19 |
| 44.5531000000 | 1.0000 | 18 |
| 39.5022000000 | 1.0000 | 14 |
| 32.4960000000 | 1.0000 | 2 |
| 30.6104000000 | 1.0000 | 10 |
| 27.3032000000 | 1.0000 | 1 |
| 26.7638000000 | 1.0000 | 22 |
| 25.2232000000 | 1.0000 | 15 |
| 19.8853000000 | 1.0000 | 20 |
| 19.5205000000 | 1.0000 | 23 |
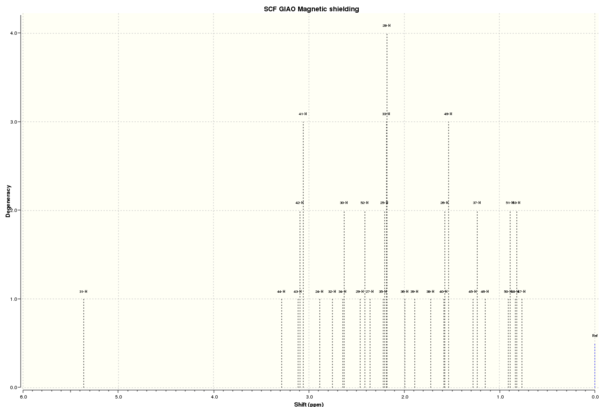
| Shift (ppm) | Degeneracy | Atoms |
| 5.3625000000 | 1.0000 | 31 |
| 3.2847000000 | 1.0000 | 44 |
| 3.0881000000 | 3.0000 | 43,42,41 |
| 2.8848000000 | 1.0000 | 24 |
| 2.7547000000 | 1.0000 | 32 |
| 2.6387500000 | 2.0000 | 34,30 |
| 2.4369000000 | 2.0000 | 29,52 |
| 2.3573000000 | 1.0000 | 27 |
| 2.1986250000 | 4.0000 | 35,25,33,28 |
| 1.9938000000 | 1.0000 | 36 |
| 1.8915000000 | 1.0000 | 39 |
| 1.7219000000 | 1.0000 | 38 |
| 1.5645666667 | 3.0000 | 40,26,49 |
| 1.2564500000 | 2.0000 | 45,37 |
| 1.1486000000 | 1.0000 | 46 |
| 0.8984000000 | 2.0000 | 50,51 |
| 0.8264500000 | 2.0000 | 48,53 |
| 0.7628000000 | 1.0000 | 47 |
Comparing to the literature value [3], the predicted 1H NMR spectrum gives higher shifts, especially for the alkene proton 31. It could be concluded that the simulated proton NMR spectrum did not perfectly match with the experimental spectrum.
A bar chart was plotted to compare the difference of shifts between predicted and experimental 13C spectra by Excel.(Figure 3)

Referring to Figure 6, it can be seen that the predicted spectrum generally matches with the experimental spectrum, but most of the shifts are slightly higher in ppm. The difference between shifts may be attributed to the use of different solvents. Also, spin-coupling errors of carbon coupling to other heavy atoms like sulphur should not be ignored. For carbon-sulphur bonds, the shifts are supposed to be corrected by -3 ppm which is approximately same as the correction of carbon-chloride bonds[4],due to nearly equal in molecular weight.
Part 2: Analysis of the properties of the synthesised alkene epoxides
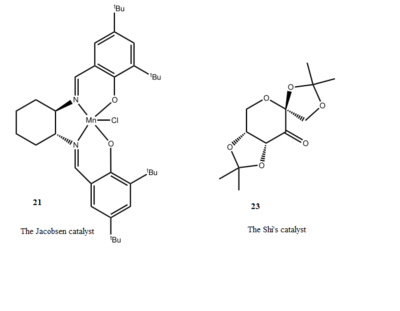
the Jacobsen and shi's Catalyst
Jacobsen and shi's catalysts (Scheme 4) were used to promote asymmetric epoxidation of alkenes. The Conquest was used to search for the crystal structure of these catalysts in Cambridge Crystal Database (CCDC). Also, Mercury program was introduced to analyze those crystal structures. Two crystal structures were shown as following[5] [6] .
| 21Jacobsen catalyst | 23Shi's catalyst | ||||||
|---|---|---|---|---|---|---|---|
|
|
The presence of anomeric centres (carbon centres connecting to two oxygen) in Shi's catalyst should be noted. At each anomeric centre, one of the C-O bond is shorter than the average C-O bond length (142 pm),whilst the other one is longer.(see Figure 4). This is due to the lone pair electrons donation from one of the oxygen to the C-O σ * orbital, which shortens the carbon oxygen bond between the oxygen that has donated the lone pair electrons and the carbon, lengthening the other carbon oxygen bond whose electron density in the σ * anti-bonding orbital increases.
As for Jacobsen catalyst, four distances between two closely distributed hydrogen atoms on two tertiary butyl groups were measured as shown on Crystal structure of Shi and Jacobsen catalyst. All the values of those interaction were compared to the van der Waals distance for hydrogen (2.40 Å), [7]. It could be found the interactions between all four pairs of hydrogen atoms are attractive. Therefore, during alkene epoxidation, these interactions prevents alkene from approaching to the manganese centre from tertiary butyl side, ensuring that alkenes could be stereoselectively epoxidized.
The Calculated NMR Properties of the Epoxides
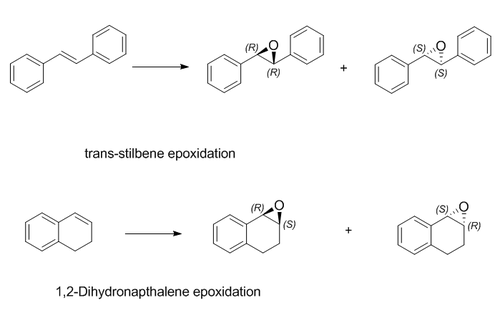
Two alkenes (trans-stilbene and 1,2-dihydronaphthalene) were chosen to be epoxidized, each giving two alkene oxides enantiomers (see Scheme 5). Each products were optimized by Avogadro with energy minimized (Optimized Alkene Oxides). The geometries of R,R-trans-stilbene oxide and R,S-dihydronaphthalene oxide at the denisty functional level were calculated using Gaussian. 13C and 1H NMR spectra were simulated under B3LYP theory and 6-31G(d,p) basis, with chloroform as the solvent(Figure 4 to 7) (DOI:10042/27496 and DOI:10042/27497 ). The chemical shifts of four spectra were summarized in Table 5 to 8.
| R,R-trans-stilbene oxide | S,S-trans-stilbene oxide | R,S-Dihydronaphthalene oxide | S,R-Dihydronaphthalene oxide | ||||||||||||
|---|---|---|---|---|---|---|---|---|---|---|---|---|---|---|---|
|
|
|
|
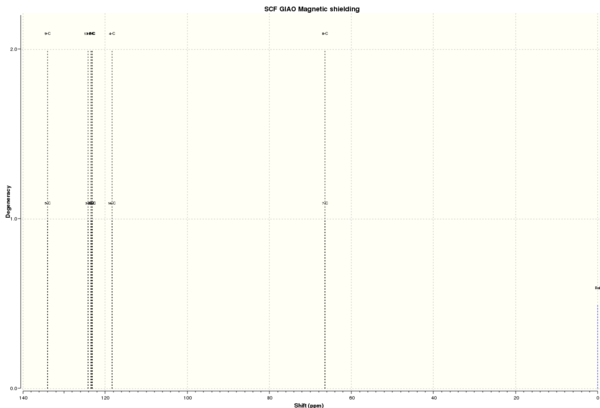
| Shift (ppm) | Degeneracy | Atoms |
| 134.0871000000 | 2.0000 | 5,9 |
| 124.2190000000 | 2.0000 | 3,13 |
| 123.5175000000 | 2.0000 | 1,11 |
| 123.2128500000 | 2.0000 | 12,2 |
| 123.0773500000 | 2.0000 | 10,6 |
| 118.2643500000 | 2.0000 | 14,4 |
| 66.4246500000 | 2.0000 | 7,8 |

| Shift (ppm) | Degeneracy | Atoms |
| 7.5704000000 | 2.0000 | 18,26 |
| 7.4791750000 | 8.0000 | 20,23,16,24,17,25,19,27 |
| 3.5380500000 | 2.0000 | 21,22 |

| Shift (ppm) | Degeneracy | Atoms |
| 135.3878000000 | 1.0000 | 4 |
| 130.3706000000 | 1.0000 | 5 |
| 126.6665000000 | 1.0000 | 6 |
| 123.7911000000 | 1.0000 | 2 |
| 123.5334000000 | 1.0000 | 3 |
| 121.7442000000 | 1.0000 | 1 |
| 52.8212000000 | 1.0000 | 10 |
| 52.1925000000 | 1.0000 | 7 |
| 30.1803000000 | 1.0000 | 8 |
| 29.0635000000 | 1.0000 | 9 |
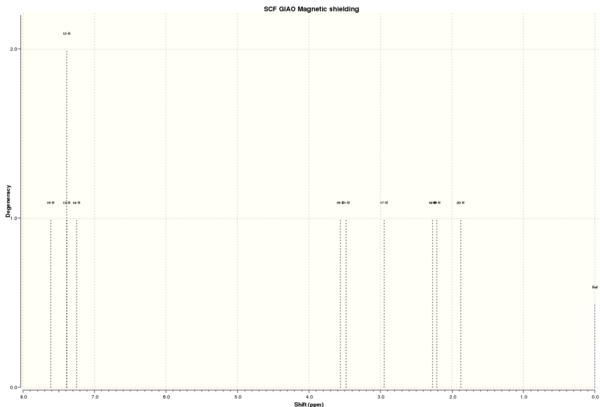
| Shift (ppm) | Degeneracy | Atoms |
| 7.6151000000 | 1.0000 | 15 |
| 7.3894000000 | 2.0000 | 13,12 |
| 7.2515000000 | 1.0000 | 14 |
| 3.5596000000 | 1.0000 | 16 |
| 3.4831000000 | 1.0000 | 21 |
| 2.9466000000 | 1.0000 | 17 |
| 2.2673000000 | 1.0000 | 18 |
| 2.2090000000 | 1.0000 | 19 |
| 1.8734000000 | 1.0000 | 20 |
The Assignment of the Absolute Configurations for products
Alkenen epoxidation is stereospecfic with respect to alkenes that would not alter the trans/cis configuration of the alkene. It proceeds via a concerted syn-addition mechanism, therefore the trans-stilbene gives R,R- or S,S-trans-stilbene oxides whereas 1,2-dihydronapthalene (a cis- alkene) gives 1R,2S- or 1S,2R-dihydronapthalene oxide as shown on Scheme 5. Consequently, the stereochemistry of final products after epoxidation should be characterized using analytical techniques.
Optical rotatory power
The optical rotatory power is one of the measurements that distinguish the absolute configurations of the enantiomes. Initially, literature values of optial rotatory powers of four epoxides were searched from Reaxys (Table 9). Computational analyses were carried out to predict the optical rotatory powers of four optimized epoxides in chloroform at 589 nm and 365 nm using Gaussian with CAM-B3LYP method, 6-311++g(2df,p) basis. The outcomes were summarized in Table 10.
| Epoxides | R,S-dihydronaphthalene oxides[8] | S,R-dihydronaphthalene oxides[9] | S,S-trans-stilbene oxides[10] | R,R-trans-stilbene oxides[11] |
|---|---|---|---|---|
| Concentration (g/100ml) | 0.81 | 0.21 | 0.56 | 0.73 |
| Enantiometric Excess (%) | 99 | 99 | 89 | 97 |
| Solvent | CHCl3 | CHCl3 | CHCl3 | CHCl3 |
| Optical Rotation | 129o | -39o | -205.2o | 334.6o |
| Wavelength (nm) | 589 | 589 | 589 | 589 |
| Temperature | 20oC | 25oC | 20oC | 25oC |
| epoxides | R,R-trans-stilbene oxides DOI:10042/27501 | S,S-trans-stilbene oxidesDOI:10042/27523 | R,S-dihydronaphthalene oxides DOI:10042/27499 | S,R-dihydronaphthalene oxides DOI:10042/27524 |
|---|---|---|---|---|
| αd at 589 nm | 102.87o | -24.18o | 177.43o | -52.74o |
The predicted values calculated by the method mentioned above agrees with the literature values found with some extend of deviation tolerated. The sign of all predicted values perfectly match with the literature values. Therefore, the method introduced is reliable in calculating the optical rotatory power of those two epoxides.
VCD and ECD
Apart from optical rotatory power, the absolute configuration could be assigned by vibrational circular dichroism (VCD) and the electronic circular dichroism (ECD). VCD spectra of R,R- and S,S-trans-stilbene oxides were plotted to assign the configuration (Figure 8 and 9). As for ECD, due to lacking of chromophore in epoxides, it fails to assign the configuration by using UV/Vis spectrum.
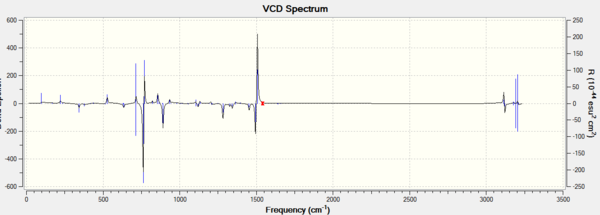
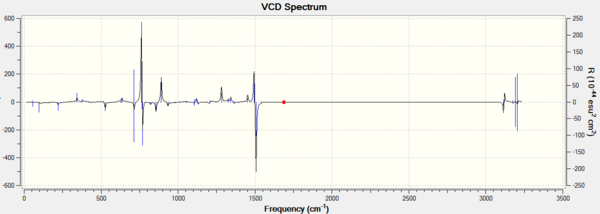
The VCD spectra of R,R-trans-stilbene oxide and S,S-trans-stilbene oxide are nearly mirror images to each other since their vibrational environments are completely opposite to each other. This technique is definitely applicable in assigning the configurations for enantiomers.
Using the (calculated) properties of transition state for the reaction
The enantiomeric excess of four product mixtures(two epoxidation promoted by each catalyst) could be calculated using free energy difference between two diastereomeric transition states (ΔG). The ratio of concentrations of the two species (K) for each product mixture could be converted from the each ΔG according to the equation "ΔG=-RTlnK". Knowing the values of K, each enantiomeric excess was calculated (Table 11 to 14).
| Transition State | R,R-trans-stilbene oxide | S,S-trans-stilbene oxide |
| Free Energies of 1 (Hartrees) | -1535.14760552 | -1535.14668122 |
| Free Energies of 2(Hartrees) | -1535.14902029 | -1535.14601044 |
| Free Energies of 3(Hartrees) | -1535.16270178 | -1535.15629511 |
| Free Energies of 4(Hartrees) | -1535.16270154 | -1535.15243112 |
| Average ΔG(Hartrees) | -1535.1555072825 | -1535.1503544725 |
| Free Energy Difference (RR-SS)(Hartrees) | -0.00515281000002688 | |
| K | 235.7 | |
| Relative Population (%) | 99.5 | 0.5 |
| Enantiomeric Excess (%) | 99.0 |
| Transition State | R,R-trans-stilbene oxide | S,S-trans-stilbene oxide |
| Free Energies of 1 (Hartrees) | -3575.66547138 | -3575.66429705 |
| Free Energy Difference (RR-SS) (Hartrees) | -0.00117432999968514 | |
| K | 3.5 | |
| Relative Population (%) | 77.8 | 22.2 |
| Enantiomeric Excess (%) | 55.6 |
| Transition State | R,S-dihydronaphthalene oxide | S,R-dihydronaphthalene oxide |
| Free Energies of 1 (Hartrees) | -1381.54381947 | -1381.55280118 |
| Free Energies of 2 (Hartrees) | -1381.5472601 | -1381.53607543 |
| Free Energies of 3 (Hartrees) | -1381.556204 | -1381.54761301 |
| Free Energies of 4 (Hartrees) | -1381.54990117 | -1381.55813219 |
| Average ΔG (Hartrees) | -1381.549296185 | -1381.5486554525 |
| Free Energy Difference (RR-SS) (Hartrees) | -0.000640732500414742 | |
| K | 1.9 | |
| Relative Population (%) | 65.5 | 34.5 |
| Enantiomeric Excess (%) | 31.0 |
| Transition State | R,S-dihydronaphthalene oxide | S,R-dihydronaphthalene oxide |
| Free Energies of 1 (Hartrees) | -3422.06853796 | -3422.06054777 |
| Free Energies of 2 (Hartrees) | -3422.05830133 | -3422.05965215 |
| Average ΔG (Hartrees) | -3422.063419645 | -3422.06009996 |
| Free Energy Difference (RR-SS) (Hartrees) | -0.00331968499995128 | |
| K | 33.8 | |
| Relative Population (%) | 97.1 | 2.9 |
| Enantiomeric Excess (%) | 94.2 |
As can be seen on Table 11 to 14, R,R transition states and R,S transition states are predominant for both Shi's catalyst and Jacobsen catalyst promoted epoxidations due to having lower free energy comparing to S,S and S,R transition states respectively. Therefore, the R,R-trans-stilbene oxide and R,S-dihydronaphthalene oxide are supposed to be the major products in trans-stilbene and 1,2-dihydronaphthalene epoxidation promoted by both Shi's and Jacobsen catalyst.
NCI Analysis for the Transition State
The non-covalent interactions for R,R- transition state of Shi's catalyst promoted epoxidation of trans-stilbene was analyzed by Gaussview(Figure 10).
Orbital |
Figure 10. The non-covalent interactions for R,R- transition state of Shi's catalyst promoted epoxidation of trans-stilbene
Referring to the figure shown above, the green region indicates attractive interaction that active catalyst binds to the substrate via the oxygen atoms. The substrate should have oriented itself to maximize the attractive interaction before binding to minimize the energy of the transition state. This transition state is stabilized by the attractive interactions which therefore determine the stereoselectivity of the epoxidation.
QTAIM analysis for transition state of R,R-trans-stilbene oxide promoted by Shi's catalyst

The QTAIM analysis was conducted to calculate the orientation of R,R-trans-stilbene oxide in respect to Shi's catalyst. All the non-covalent bond critical points from weak interaction associated with weak interaction between oxygen and hydrogen were assigned (Figure 11).
Suggesting new candidates for investigations
An epoxide called cis R-(+)-pulegone oxide were found to have a optical rotatory power of 853.9o in ethanol at 324 nm [12]. Considering its high optical rotatory power (far more than 300o)and simple structure, this molecule is suggested to be a new candidates for investigations.
untitled.mol |
References
- ↑ S. W. Elmore and L. Paquette, Tetrahedron Letters, 1991, 319; DOI:10.1016/S0040-4039(00)92617-0 10.1016/S0040-4039(00)92617-0 10.1016/S0040-4039(00)92617-0
- ↑ W. F. Maier, P. Von Rague Schleyer, J. Am. Chem. Soc., 1981, 103, 1891. DOI:10.1021/ja00398a003
- ↑ L. Paquette, N. A. Pegg, D. Toops, G. D. Maynard, R. D. RogersJ. Am. Chem. Soc. , 1990, 112, 277-283. DOI:10.1021/ja00157a043
- ↑ C. Braddock and H. S. Rzepa, J. Nat. Prod., 2008, 71, 728-730. DOI:10.1021/np0705918
- ↑ Zhi-Xian Wang, S.M.Miller, O.P.Anderson, Yian Shi, J.Org.Chem. , 2001, 66, 521. DOI:10.1021/jo001343i
- ↑ J.W.Yoon, T.-S.Yoon, S.W.Lee, W.Shin, Acta Crystallogr.,Sect.C:Cryst.Struct.Commun. , 1999, 55, 1766. DOI:10.1107/S0108270199009397
- ↑ DOI:10.1021/jp8111556
- ↑ Pedragosa-Moreau, S.; Archelas, A.; Furstoss, R. Tetrahedron 1996, 52, 4593
- ↑ Lin, H.; Qiao, J.; Liu, Y.; Wu, Z.-L. Journal of Molecular Catalysis B: Enzymatic 2010, 67, 236
- ↑ Niwa, T.; Nakada, M. Journal of the American Chemical Society 2012, 134, 13538
- ↑ Wong, O. A.; Wang, B.; Zhao, M.-X.; Shi, Y. Journal of Organic Chemistry 2009, 74, 6335
- ↑ Reusch; Johnson Journal of Organic Chemistry 1963, 28, 2557
