Rep:Mod:TS0606
The Cope Rearrangement
Antiperiplanar Conformation
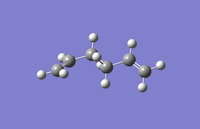
1,5-hexadiene was originally optimised with the intention of finding an antiperiplanar conformation. A molecule was drawn in what was expected to be a low energy antiperiplanar conformation and this molecule was optimised.
1,5-Hexadiene Optimisation DOI:10042/20999
| File Name | 1,5 hexadiene app opt |
| File Type | .fch |
| Calculation Type | FOPT |
| Calculation Method | RHF |
| Basis Set | 3-21G |
| Charge | 0 |
| Spin | Singlet |
| Total Energy | -231.69260235 a.u. |
| RMS Gradient Norm | 0.00001824 a.u. |
| Dipole Moment | 0.2021 Debye |
| Point Group | C2 |
 Item               Value     Threshold  Converged?
 Maximum Force            0.000435     0.000450     YES
 RMS     Force            0.000069     0.000300     YES
 Maximum Displacement     0.001576     0.001800     YES
 RMS     Displacement     0.000522     0.001200     YES
 Predicted change in Energy=-9.100268D-07
 Optimization completed.
    -- Stationary point found.
The summary and item table show that the molecule was successfully optimised.
The energy and point group match that of the anti 1 conformation[1]. This is the lowest energy antiperiplanar conformation due to the steric effects, the two alkene groups are antiperiplanar to each other which reduces the steric interaction between them and hence stabilises the molecule.
Gauche Conformation
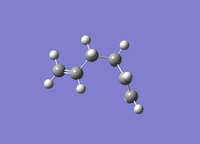
Similar to the anitperiplanar conformation a guess structure of the lowest energy gauche conformation was drawn and then optimised.
1,5-Hexadiene Gauche Optimisation DOI:10042/21001
| File Name | 1,5 hexadiene gauche opt |
| File Type | .fch |
| Calculation Type | FOPT |
| Calculation Method | RHF |
| Basis Set | 3-21G |
| Charge | 0 |
| Spin | Singlet |
| Total Energy | -231.68771613 a.u. |
| RMS Gradient Norm | 0.00001461 a.u. |
| Dipole Moment | 0.4550 Debye |
| Point Group | C2 |
 Item               Value     Threshold  Converged?
 Maximum Force            0.000040     0.000450     YES
 RMS     Force            0.000007     0.000300     YES
 Maximum Displacement     0.000612     0.001800     YES
 RMS     Displacement     0.000151     0.001200     YES
 Predicted change in Energy=-2.473769D-08
 Optimization completed.
    -- Stationary point found.
The summary and item table show that the molecule was successfully optimised.
The energy and point group match the gauche 1 conformation[1]. This is actually the highest energy gauche conformation, due to the two terminal carbon atoms being close together there is likely to be steric strain.
The gauche conformation was redrawn in an attempt to find the lowest energy conformation and then was optimised.
Gauche 3 Optimisation DOI:10042/21355
| File Name | gauche3 |
| File Type | .log |
| Calculation Type | FOPT |
| Calculation Method | RHF |
| Basis Set | 3-21G |
| Charge | 0 |
| Spin | Singlet |
| Total Energy | -231.69266122 a.u. |
| RMS Gradient Norm | 0.00000357 a.u. |
| Dipole Moment | 0.3405 Debye |
| Point Group | C1 |
 Item               Value     Threshold  Converged?
 Maximum Force            0.000012     0.000450     YES
 RMS     Force            0.000003     0.000300     YES
 Maximum Displacement     0.001094     0.001800     YES
 RMS     Displacement     0.000281     0.001200     YES
 Predicted change in Energy=-3.416150D-09
 Optimization completed.
    -- Stationary point found.
The summary and item table show that the molecule was correctly optimised.
The energy and point group of the newly optimised molecule matches that of the gauche 3 conformation[1] and is the lowest energy conformation. It is normally expected that one of the anti conformations will have the lowest energy because there is much less steric repulsions than in the gauche conformations. There is also very little Van der Waal's or Pauli effects. In this case it was found that the lowest energy conformation was a gauche conformation due to the π orbital overlap between the alkene group and the vinyl proton.
Anti 2 Conformation
The anti 2 conformation had not been found in the original calculation, so an additional calculation was run.
Anti2 Optimisation DOI:10042/21005
| File Name | 1,5 hexadiene anti 2 |
| File Type | .fch |
| Calculation Type | FOPT |
| Calculation Method | RHF |
| Basis Set | 3-21G |
| Charge | 0 |
| Spin | Singlet |
| Total Energy | -231.69253521 a.u. |
| RMS Gradient Norm | 0.00003619 a.u. |
| Dipole Moment | 0.0000 Debye |
| Point Group | Ci |
 Item               Value     Threshold  Converged?
 Maximum Force            0.000074     0.000450     YES
 RMS     Force            0.000019     0.000300     YES
 Maximum Displacement     0.001453     0.001800     YES
 RMS     Displacement     0.000540     0.001200     YES
 Predicted change in Energy=-7.570432D-08
 Optimization completed.
    -- Stationary point found.
The point group and energy match the anti 2 conformation.
The molecule was then reoptimised using the 6-31G* basis set.
Anti 2 Reoptimisation DOI:10042/21008
| File Name | 1,5 hexadiene anti 2 reopt |
| File Type | .fch |
| Calculation Type | FOPT |
| Calculation Method | RB3LYP |
| Basis Set | 6-31G(D) |
| Charge | 0 |
| Spin | Singlet |
| Total Energy | -234.61171856 a.u. |
| RMS Gradient Norm | 0.00001217 a.u. |
| Dipole Moment | 0.0000 Debye |
| Point Group | Ci |
 Item               Value     Threshold  Converged?
 Maximum Force            0.000014     0.000450     YES
 RMS     Force            0.000006     0.000300     YES
 Maximum Displacement     0.000190     0.001800     YES
 RMS     Displacement     0.000077     0.001200     YES
 Predicted change in Energy=-1.458658D-08
 Optimization completed.
    -- Stationary point found.
The summary and item table show that the molecule was successfully optimised.
The geometry changes very little when changing to a higher basis set, but the energy differs quite significantly. The change in energy from using the 3-21G basis set to the 6-31G basis set is -231.69253521 a.u. to -234.61171856 a.u. This gives a difference of 2.91918335 a.u. or 1831 kcal mol-1. This is a very large difference in energy due to a better basis set being used, giving a more accurate representation of the energy of the conformation.
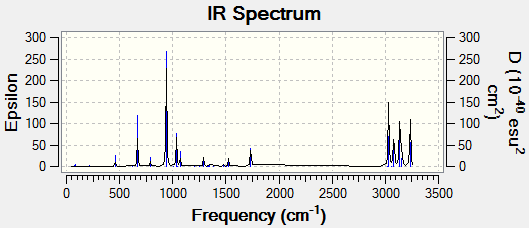
A frequency calculation was run to view the vibrations of the molecule and produce an IR spectrum.
Anti 2 Frequency DOI:10042/21012
Low frequencies --- -10.6330 -0.0007 -0.0006 -0.0006 8.1799 35.7303
Low frequencies --- 71.0594 81.2098 121.4252
No negative frequencies are observed which shows that all of the vibrations are real, as expected for a ground state molecule. An imaginary, or negative, frequency is expected in a molecule that is a transition state.
The thermochemistry data can be seen below:
Sum of electronic and zero-point Energies= -234.469198
Sum of electronic and thermal Energies= -234.461846
Sum of electronic and thermal Enthalpies= -234.460901
Sum of electronic and thermal Free Energies= -234.500807
Optimising the "Chair" and "Boat" Transition Structures
An allyl fragment was optimised as it is essentially one half of the transition states and can therefore be used to build both the chair and the boat transition states when the two fragments are correctly orientated with a distance of approximately 2.2Å between the terminal Carbon atoms..
Allyl Fragment Optimisation DOI:10042/21018
 Item               Value     Threshold  Converged?
 Maximum Force            0.000048     0.000450     YES
 RMS     Force            0.000018     0.000300     YES
 Maximum Displacement     0.000142     0.001800     YES
 RMS     Displacement     0.000070     0.001200     YES
 Predicted change in Energy=-1.277268D-08
 Optimization completed.
    -- Stationary point found.
The item table shows that the molecule was successfully optimised.
Chair Transition State
The chair transition state was built using two allyl fragments, with the terminal Carbon atoms approximately 2.2Å apart.
Force Constant Matrix
The chair transition state was optimised by calculating the force constant matrix. For this method to work the guess of the transition structure has to be similar to the optimised output.
Chair TS Guess Optimisation TS (Berny) DOI:10042/21021
 Item               Value     Threshold  Converged?
 Maximum Force            0.000008     0.000450     YES
 RMS     Force            0.000001     0.000300     YES
 Maximum Displacement     0.000167     0.001800     YES
 RMS     Displacement     0.000035     0.001200     YES
 Predicted change in Energy=-2.513811D-09
 Optimization completed.
    -- Stationary point found.
The item table shows that molecule was optimised successfully.
Low frequencies --- -817.9475 -1.3131 -1.0053 -0.0007 0.0006 0.0007
Low frequencies --- 1.1224 209.5401 396.0042
****** 1 imaginary frequencies (negative Signs) ******
1 imaginary frequency was found at 818cm-1 and from the above animation it can be seen that this corresponds to the Cope Rearrangement where one bond is being formed whilst at the opposite end of the fragment a bond is being broken. The bond breaking/forming distance is approximately 2.02Å.
Frozen Coordinates
The transition state was also computed using the frozen coordinate method, where the two terminal Carbons of the transition state were frozen at 2.2Å apart.
Chair Optimisation Frozen Coordinate DOI:10042/21032
  Item               Value     Threshold  Converged?
 Maximum Force            0.000037     0.000450     YES
 RMS     Force            0.000013     0.000300     YES
 Maximum Displacement     0.001492     0.001800     YES
 RMS     Displacement     0.000267     0.001200     YES
 Predicted change in Energy=-4.668955D-07
 Optimization completed.
    -- Stationary point found.
The item table shows that the molecule was optimised successfully.
The frozen bonds were then changed to derivative and the transition state was reoptimised using the force constant method.
Chair Optimisation Frozen Coordinate 2 DOI:10042/21043
 Item               Value     Threshold  Converged?
 Maximum Force            0.000026     0.000450     YES
 RMS     Force            0.000008     0.000300     YES
 Maximum Displacement     0.001110     0.001800     YES
 RMS     Displacement     0.000197     0.001200     YES
 Predicted change in Energy=-3.494538D-07
 Optimization completed.
    -- Stationary point found.
The item table shows the molecule was optimised successfully.
Low frequencies --- -817.9060 -4.4511 -3.8316 0.0002 0.0002 0.0006
Low frequencies --- 3.0445 209.5148 396.2539
****** 1 imaginary frequencies (negative Signs) ******
1 imaginary frequency was found and it is clear that is corresponds to the same Cope Rearrangement as the optimised structure using the force constant matrix method. The bond breaking/forming distance is approximately 2.02Å which again is the same as for the force constant matrix method. There is no obvious change in geometry between the frozen coordinates structure and the force constant structure. This is expected as the original guess for the chair transition structure was close to the actual transition structure.
Boat Transition State Optimisation
The boat transition structure was optimised using the QST2 method. The reactant and product were both the anti 2 conformer that had been previously optimised.
QST2 Optimisation Fail DOI:10042/21297
The calculation fails as the reactant and product are not close enough to the transition state for the calculation to find the boat structure. The molecule was then edited to closer resemble the transition state and the calculation was re-run.
Boat QST2 Optimisation DOI:10042/21313
 Item               Value     Threshold  Converged?
 Maximum Force            0.000145     0.000450     YES
 RMS     Force            0.000035     0.000300     YES
 Maximum Displacement     0.001201     0.001800     YES
 RMS     Displacement     0.000283     0.001200     YES
 Predicted change in Energy= 3.644196D-08
 Optimization completed.
    -- Stationary point found.
The item table shows that the molecule was successfully optimised.
Low frequencies --- -840.1357 -0.0023 0.0001 0.0005 1.3923 6.4842
Low frequencies --- 8.4751 155.5449 381.9632
****** 1 imaginary frequencies (negative Signs) ******
1 imaginary frequency was found and this corresponds to the Cope Rearrangement, where one bond is being formed whilst another is being broken. It is very similar to the chair conformation Cope Rearrangement and therefore occurs at a similar frequency. The bond breaking/forming distance is 2.14Å.
Intrinsic Reaction Coordinate
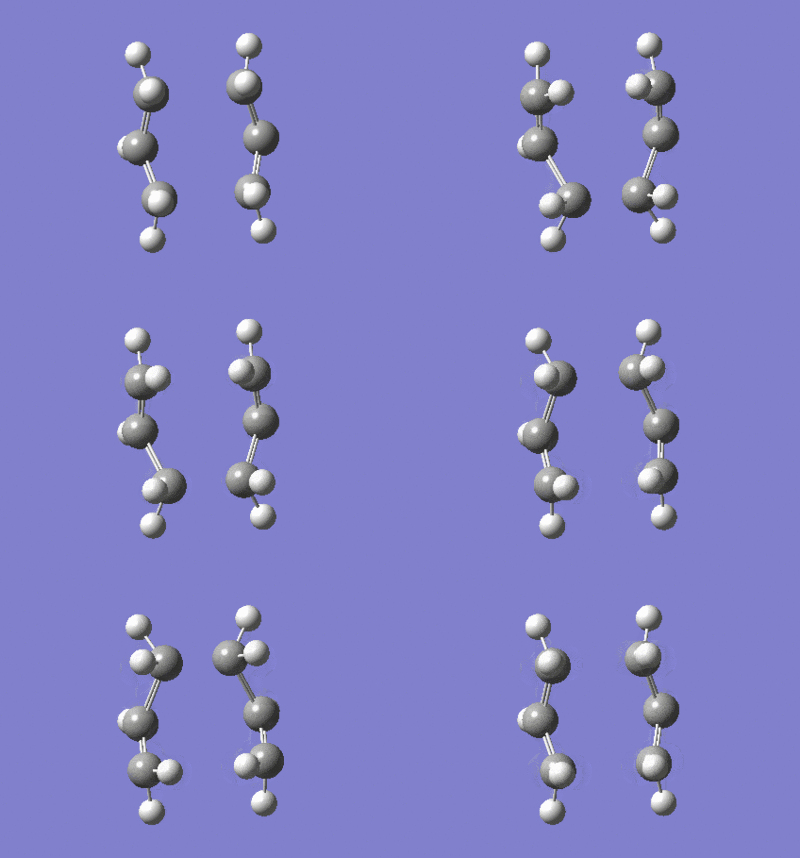
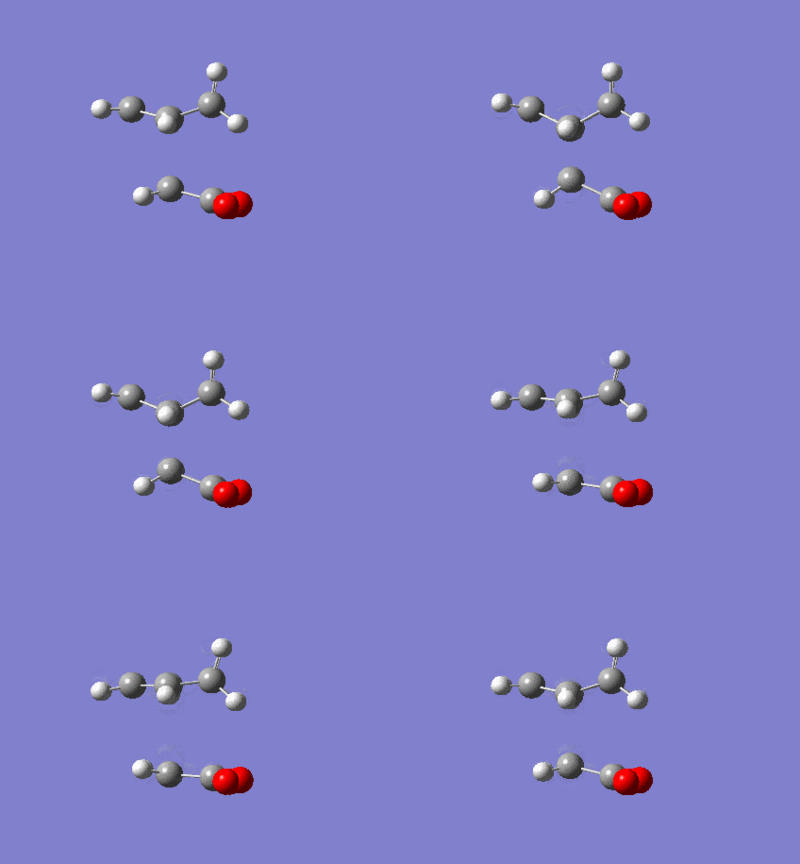
The IRC was originally calculated using 50 points, however the output file shows that only 26 points were computed. There also appears to be an error on the second step as it does not fit the pattern.
| IRC | Molecule Vibrations |
|---|---|
 |
 |
An optimisation was completed on the last point of the IRC using the 6-31G* basis set, as this is expected to be close to the minimum.
Chair IRC Optimisation DOI:10042/21138
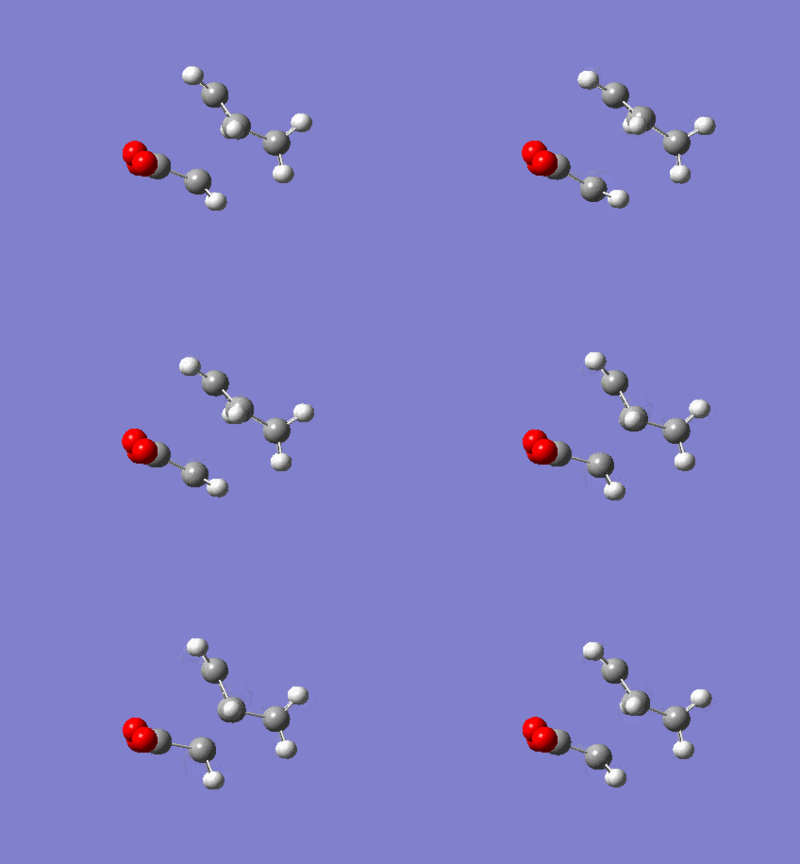
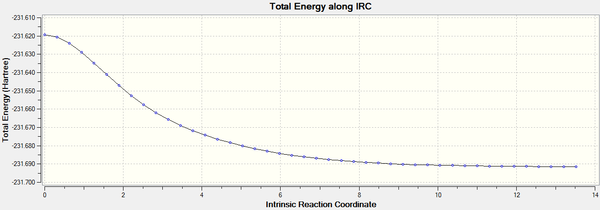
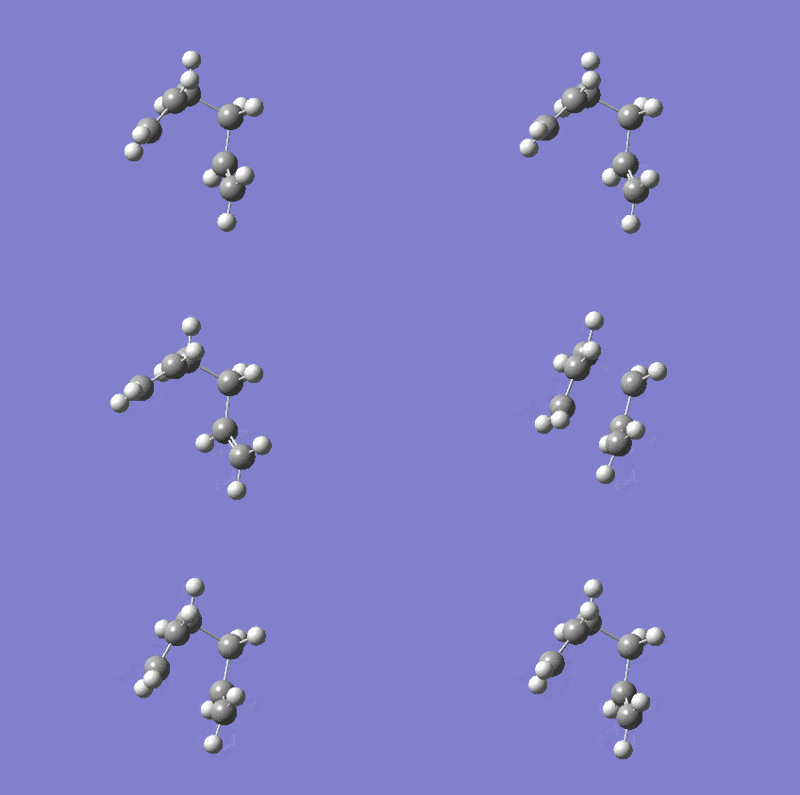
The IRC was re-run using 100 points and again the output file shows less points were computed, only 46. The anomaly in the IRC calculate using only 50 points is not carried through to the IRC with 100 points.
| IRC | Molecule Vibrations |
|---|---|
 |
 |
By comparing the IRC with 50 points to the IRC with 100 points it is clear to see that is was appropriate to optimise the last point form the IRC with 50 points as this is close enough to the minium value shown in the IRC with 100 points.
Activation Energies
The transition state optimised using the frozen coordinate method was re-optimised using the 6-31G* basis set.
Chair Activation Energy Optimisation DOI:10042/21190
 Item               Value     Threshold  Converged?
 Maximum Force            0.000016     0.000450     YES
 RMS     Force            0.000006     0.000300     YES
 Maximum Displacement     0.000894     0.001800     YES
 RMS     Displacement     0.000158     0.001200     YES
 Predicted change in Energy=-4.049382D-08
 Optimization completed.
    -- Stationary point found.
The item table shows the molecule has been successfully optimised.
Low frequencies --- -569.0992 -21.5412 -7.1927 -0.0008 -0.0006 -0.0005
Low frequencies --- 25.5105 195.1486 262.5505
****** 1 imaginary frequencies (negative Signs) ******
The imaginary frequency corresponds to the bond breaking/forming vibration of the transition state. The bond breaking/forming distance is 1.97Å.
Thermochemistry data:
Sum of electronic and zero-point Energies= -234.414881
Sum of electronic and thermal Energies= -234.408953
Sum of electronic and thermal Enthalpies= -234.408009
Sum of electronic and thermal Free Energies= -234.443121
The boat that had originally been optimised using the QST2 method with the 3-21G basis set was reoptimiesd using the 6-31G* basis set.
Boat Activation Energy Optimisation DOI:10042/21203
 Item               Value     Threshold  Converged?
 Maximum Force            0.000145     0.000450     YES
 RMS     Force            0.000035     0.000300     YES
 Maximum Displacement     0.001201     0.001800     YES
 RMS     Displacement     0.000283     0.001200     YES
 Predicted change in Energy= 3.644196D-08
 Optimization completed.
    -- Stationary point found.
The item table shows the molecule was successfully optimised.
Low frequencies --- -533.9244 -16.2044 0.0005 0.0007 0.0008 1.3065
Low frequencies --- 10.0658 133.6793 258.4286
****** 1 imaginary frequencies (negative Signs) ******
The imaginary frequency again corresponds to the bond breaking/forming vibration of the transition state as it does for the chair conformation. The bond breaking/forming distance is 2.20Å.
Thermochemistry data:
Sum of electronic and zero-point Energies= -234.402331
Sum of electronic and thermal Energies= -234.395985
Sum of electronic and thermal Enthalpies= -234.395041
Sum of electronic and thermal Free Energies= -234.431760
Energy Comparisons
| Structure | HF/321-G (a.u.) | B3LYP/6-31G* (a.u.) | Activation Energy, ΔE (kcal/mol) |
|---|---|---|---|
| Boat TS | -231.60280242 | -234.54307810 | 43.072(5750546) |
| Chair TS | -231.61932180 | -234.55693214 | 34.379(0264142) |
| Anti2 (reactant) | -231.69253521 | -234.61171856 | --- |
Although the geometries change very little when optimised with a higher basis set, it is clear to see that the energies vary quite a lot. The energies calculated using the higher basis are more accurate and for that reason the activation energies were calculated using the values from the 6-31G* basis set. The calculated activation energies fall within the error range given for the experimental energies[1] at 0K. The activation energy of the boat conformation is much higher than that of the chair conformation, this is as expected due to the chair conformation having less steric strain and being the lower energy conformation.
The Diels Alder Cycloaddition
Cis-Butadiene
The AM1 semi-empirical molecular orbital method was used to optimise the molecule of cis-butadiene.
Cis-Butadiene Optimisation DOI:10042/21143
| File Name | cis-butandiene opt |
| File Type | .log |
| Calculation Type | FOPT |
| Calculation Method | RAM1 |
| Basis Set | ZDO |
| Charge | 0 |
| Spin | Singlet |
| Total Energy | 0.04879719 a.u. |
| RMS Gradient Norm | 0.00001745 a.u. |
| Dipole Moment | 0.0414 Debye |
| Point Group | C1 |
 Item               Value     Threshold  Converged?
 Maximum Force            0.000030     0.000450     YES
 RMS     Force            0.000011     0.000300     YES
 Maximum Displacement     0.000382     0.001800     YES
 RMS     Displacement     0.000162     0.001200     YES
 Predicted change in Energy=-9.691123D-09
 Optimization completed.
    -- Stationary point found.
The summary and item table show that the molecule was successfully optimised.
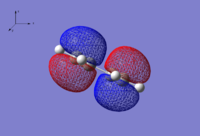
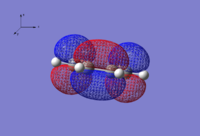
| HOMO | LUMO |
|---|---|
 |
|
| Anti-symmetric wrt. yz plane | Symmetric wrt. yz plane |
Transition Structure
The transition structure was calculated using the force constant matrix method as was used for the first determination of the transition state for the chair conformation. The estimated bond distance was originally set at 2.25Å as this is close to the expected bond distance.
Transition State Optimisation DOI:10042/21205
 Item               Value     Threshold  Converged?
 Maximum Force            0.000044     0.000450     YES
 RMS     Force            0.000006     0.000300     YES
 Maximum Displacement     0.001167     0.001800     YES
 RMS     Displacement     0.000227     0.001200     YES
 Predicted change in Energy=-1.936170D-08
 Optimization completed.
    -- Stationary point found.
The item table shows the molecule was successfully optimised.
Low frequencies --- -818.6295 0.0007 0.0008 0.0008 2.4128 3.9865
Low frequencies --- 4.3768 166.5547 284.3601
****** 1 imaginary frequencies (negative Signs) ******
The imaginary frequency corresponds to the bond breaking/forming vibration of the Diels-Alder reaction.
Structure
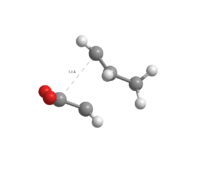
The ethene molecule can be seen to be approaching the face of the butadiene molecule from above or below the plane. This allows the two new sigma bonds to be formed at either end of the ethene molecule in a concerted fashion.
The partially formed σ C-C bond length is: 2.209Å
Typical C-C sp3-sp3 bond length[2]: 1.53Å
Typical C-C sp2-sp2 bond length[2]: 1.46Å
Van der Waals radius of Carbon[3]: 1.70Å
The partially formed σ C-C bond is less than 3.4Å which is the value for two Carbon Van der Waals radii, this means there is some orbital overlap between the two molecules in the transition state and therefore displays some bonding character. The partially formed σ C-C bond is however much longer than both the typical C-C sp3-sp3 and C-C sp2-sp2 bond lengths for a stable molecule. This shows that in the transition state the bond formation is not yet complete, which is as expected.
Molecular Orbitals
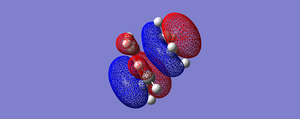
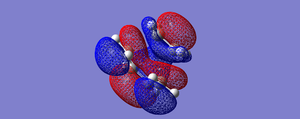
| HOMO | LUMO |
|---|---|
 |
|
| Anti-symmetric wrt. plane | Symmetric wrt. plane |
The HOMO at the transition structure is antisymmetric with respect to the the plane. The MO's that have formed the HOMO of the transition state are the the HOMO of the butadiene molecule and the LUMO of the ethene molecule. Both of these orbitals are antisymmetric and give the antisymmetric HOMO. The reaction is allowed because during the formation of the two new σ C-C bonds by the interaction of the butadiene HOMO with the ethene LUMO the symmetry is conserved.
Reaction Pathway
| Imaginary Frquency (-818.63 cm-1) | Lowest Positive Frequency (166.55 cm-1) |
|---|---|
 |

|
The imaginary frequency corresponds to the bond forming reaction in the transition state and therefore the reaction pathway, it is clear to see form the animation that the forming of the two new σ C-C bonds is a synchronous process. The lowest positive frequency shows the butadiene molecule and the ethene molecule vibrate as individual molecules rather interacting to form the transition state. There is no interaction between the two fragments in the the lowest positive frequency as there was in the imaginary frequency.
Regioselectivity of the Diels Alder Reaction
Both the endo and exo transition state were calculated using the 6-31G* basis set and the TS Berny method for finding a transition state. The "Opt=NoEigen" term was added as the force constants were being calculated once.
Exo Transition State
Exo Transition State DOI:10042/21345
 Item               Value     Threshold  Converged?
 Maximum Force            0.000030     0.000450     YES
 RMS     Force            0.000003     0.000300     YES
 Maximum Displacement     0.000383     0.001800     YES
 RMS     Displacement     0.000101     0.001200     YES
 Predicted change in Energy=-2.439873D-09
 Optimization completed.
    -- Stationary point found.
The item table shows the molecule was successfully optimised.
Low frequencies --- -448.4756 -13.9333 -11.7572 0.0007 0.0009 0.0014
Low frequencies --- 3.0477 53.2974 109.0854
****** 1 imaginary frequencies (negative Signs) ******
The imaginary frequency corresponds to the bond breaking/forming vibration of the Diels-Alder reaction.
Endo Transition State
Endo Transtition State DOI:10042/21347
 Item               Value     Threshold  Converged?
 Maximum Force            0.000020     0.000450     YES
 RMS     Force            0.000003     0.000300     YES
 Maximum Displacement     0.000843     0.001800     YES
 RMS     Displacement     0.000213     0.001200     YES
 Predicted change in Energy=-6.289740D-09
 Optimization completed.
    -- Stationary point found.
The item table shows the molecule was successfully optimised.
Low frequencies --- -446.9904 -14.3290 -0.0010 -0.0009 -0.0006 4.2809
Low frequencies --- 11.2860 59.6264 118.3320
****** 1 imaginary frequencies (negative Signs) ******
Similarly to the exo conformation, the imaginary frequency corresponds to the bond breaking/forming vibration of the Diels-Alder reaction.
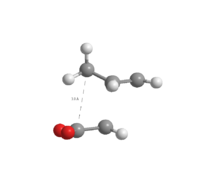
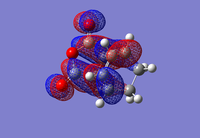
Comparison
| HOMO | LUMO | Energy | Bond Lengths | Through Space Distance | |
|---|---|---|---|---|---|
| Exo |  |
 |
-612.67931096 a.u. | 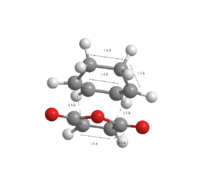 |
|
| Endo | 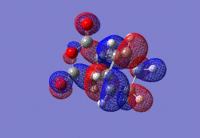 |
 |
-612.68339678 a.u. |  |
|
For both the Exo and the Endo form the HOMO of the diene and the LUMO of the dienophile combine to give an asymmetric orbital with only one nodal plane. The overall symmetry is expected to be asymmetric due to the HOMO of the diene and the LUMO of the dienophile both being asymmetric, therefore the symmetry of the reaction is conserved.
The σ C-C bond forming distance for both the exo and endo form is 2.3Å, all of the other bond lengths are the same in both conformations. The main structural difference between the exo and endo form is that in the exo form the anhydride section of the diene lies away from the alkene bond of the dienophile whereas in the endo form the anhydride section of the diene lies beneath the alkene bond, this gives a positive orbital overlap, known as the secondary orbital overlap effect. This additional orbital effect stabilises the molecule and is the main reason why the endo conformation is the lowest energy conformation.
The steric repulsions between the anhydride and the -CH2-CH2- group is greater than that of the -CH=CH- group this means that the exo product has greater steric repulsions and is therefore more strained. The steric effects combined with the secondary orbital overlap between the π systems of -CH=CH- and -(C=O)-O-(C=O)- fragment show that the endo form is expected to be the thermodynamically most stable product. The relative energies for the exo and endo form, 0.00409 a.u. and 0.00000 a.u. respectively, show that this is in fact the case.
References
- ↑ 1.0 1.1 1.2 1.3 M.Bearpark., (2012)., Moecule 3, Physical (Computational Lab)., [Lab Script]., Imperial College London., Autumn 2012., Lab Script
- ↑ 2.0 2.1 F.H. Allen, O. Kennard, D.G. Watson, et.al., Tables of Bond Lengths determined by X-Ray and Neutron Diffraction. Part 1. Bond Lengths in Organic Compounds., J. Chem. Soc. Perkin Trans. 2., 1987, S1-S19., DOI:10.1039/P298700000S1
- ↑ A. Bondi., Van der Waals Volumes and Radii., J. Phys. Chem., 1964, 68 (3) pp 441-451., DOI:10.1021/j100785a001

