Rep:Mod:TKMORG
Conformational analysis using Molecular Mechanics
The Hydrogenation of Cyclopentadiene Dimer
Figure 1 shows that cyclopentadiene can dimerises to form an endo or exo dimer. However, in reality only the endo dimer is formed in this reaction. Figure 2 shows that hygrogenation of the endo dimer yields molecule 3 or 4. In this computational exercise, the geometries of molecules 1-4 were optimised to calculate their minimum energies by Avogadro using MMFF94(s) force field with conjugate gradients algorithm. The energies calculated were summerised in Table 1 and their optimised structures were presented in Table 2.
| Type of energy | Molecule 1 (kcal/mol) | Molecule 2 (kcal/mol) | Molecule 3 (kcal/mol) | Molecule 4 (kcal/mol) |
|---|---|---|---|---|
| Total bond stretching energy | 3.54308 | 3.46774 | 3.31232 | 2.82301 |
| Total bond angle bending energy | 30.77280 | 33.18887 | 31.93152 | 24.68561 |
| Total stretch bending energy | -2.04142 | -2.08214 | -2.10236 | -1.65715 |
| Total torsional energy | -2.73094 | -2.94977 | -1.46698 | -0.37827 |
| Total out of plane bending energy | 0.01477 | 0.02184 | 0.01309 | 0.00028 |
| Total van der waals energy | 12.80147 | 12.35918 | 13.63859 | 10.63699 |
| Total electrostatic energy | 13.01367 | 14.18495 | 5.11949 | 5.14702 |
| Total energy | 55.37342 | 58.19067 | 50.44566 | 41.25749 |
| Molecule 1 | Molecule 2 | Molecule 3 | Molecule 4 | ||||||||||||
|---|---|---|---|---|---|---|---|---|---|---|---|---|---|---|---|
|
|
|
|
It is observed that the endo dimer is less stable then the exo dimer as the total energy of the endo dimer is higher. The difference in energy is mainly due to the total bond angle bending energy. The bond angle bending energy of the endo dimer is 2.41607 kcal/mol higher than that of the exo dimer. The ideal hybridisation bond angle for sp3 C-C-C bond is 109.5o. The sp3 C bond angles, labelled in purple, of the exo and endo dimer were measured to be 114.9o and 117.8o respectively. The more deviation from the ideal hybridisation bond angle, the larger the bond angle bending energy. Thus, the total bond angle bending energy of the endo dimer is expected to be higher since that bond angle deviate the most between the exo and endo dimer. Since the dimerisation of cyclopentadien specifically form the endo dimer, this reaction is under kinetic control as the less stable dimer is expected to formed as the only product. By comparing the total energy of molecule 4 and 3, the total energy of molecule 4 is 7.24591 kcal/mol lower than that of molecule 3, mainly due to the difference in the total bond angle bending energy. Thus, if the hydrogenation of the endo cyclopentadiene dimer is controlled thermodynamically, molecule 4 is expected to be the major product as it is more stable then molecule 3.
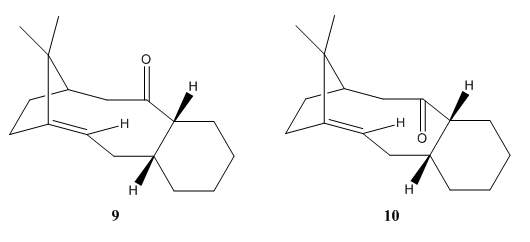
Molecules 9 and 10 (Figure 3) are intermediates in the synthesis of Taxol, a drug to treat ovarian cancers, suggested by Paquette.[1] They are atropisomers as the only difference in their conformation is the geometry of the carbonyl group.[2]
The objective in this exercise is to investigate which conformation is more stable. Since it is reported that hydrogenation of 9 and 10 proceeded at a slow rate, parent hydrocarbons of molecules 9 and 10 were included in this study to investigate this observation.[3] Therefore, molecules 9, 10 and their parent hydrocarbons were optimised and determine their minimum energies using MMFF94(s) force field with conjugate gradients algorithm. The results were summerised in Table 3 and their structures after optimisation were enclosed in Table 4.
| Type of energy | Molecule 9 (kcal/mol) | Parent hydrocarbon 9 (kcal/mol) | Molecule 10 (kcal/mol) | Parent hydrocarbon 10 (kcal/mol) |
|---|---|---|---|---|
| Total bond stretching energy | 7.67604 | 6.96339 | 7.76385 | 6.46303 |
| Total bond angle bending energy | 28.30686 | 32.11748 | 19.04178 | 23.97309 |
| Total stretch bending energy | -0.06277 | 0.31787 | -0.12882 | 0.40154 |
| Total torsional energy | 0.18764 | 9.40806 | 3.68911 | 12.36862 |
| Total out of plane bending energy | 0.96559 | 0.24642 | 0.95032 | 0.10212 |
| Total van der waals energy | 33.16164 | 32.72664 | 35.03855 | 32.72128 |
| Total electrostatic energy | 0.30338 | 0.00000 | -0.06696 | 0.00000 |
| Total energy | 70.53838 | 81.77985 | 66.28783 | 76.02967 |
| Molecule 9 | Parent hydrocarbon 9 | Molecule 10 | Parent hydrocarbon 10 | ||||||||||||
|---|---|---|---|---|---|---|---|---|---|---|---|---|---|---|---|
|
|
|
|
The energies calculated show that molecule 10 is much more stable then molecule 9 as it has a much lower total energy. By comparing their different types of energy, it is observed that the lower in energy mainly due to much lower total bond angle bending energy of molecule 10. This is because the measured sp2 bond angles of molecule 10 show less deviation from the ideal bond angle compared to molecule 9.
Furthermore, it is observed that molecule 9 and 10 are more stable then their parent hydrocarbons as their total energies are lower. This indicates that they are thermodynamically more stable then their parent hydrocarbons, resulting in low reaction rate during hydrogenation. The stabilisation effect is suggested to be due to the high strain energies of the tri-substituted bridgeheaded alkenes.[3]
Spectroscopic Simulation using Quantum Mechanics
In this section, the 1H and 13C spectra of molecule 17 were computed and compared with literature spectra to verify if the the latter have been assigned and interpreted accurately.
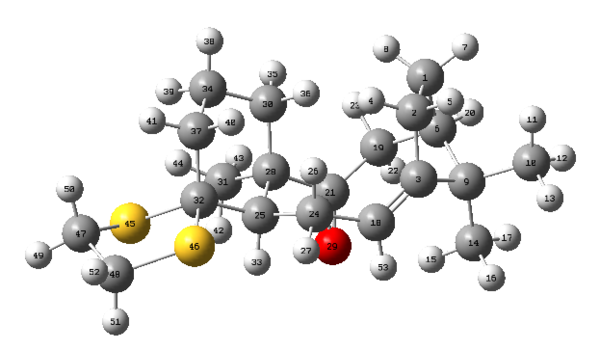
Molecule 17 is a derivative of molecule 9 and it was optimised using the MMFF94s mechanics force field at B3LYP level of theory with 6-31G(d,P) basis. The calculated thermodynamic data and the structure of molecule 17 were summarized in Table 5.
| Type of energy | (Hartree/Particle) | Molecule 17 | |||
|---|---|---|---|---|---|
| Zero-point correction | 0.468010 |
| |||
| Thermal correction to Energy | 0.489497 | ||||
| Thermal correction to Enthalpy | 0.490441 | ||||
| Thermal correction to Gibbs Free Energy | 0.421221 | ||||
| Sum of electronic and zero-point Energies | -1651.414397 | ||||
| Sum of electronic and thermal Energies | -1651.392911 | ||||
| Sum of electronic and thermal Enthalpies | -1651.391966 | ||||
| Sum of electronic and thermal Free Energies | -1651.461186 |
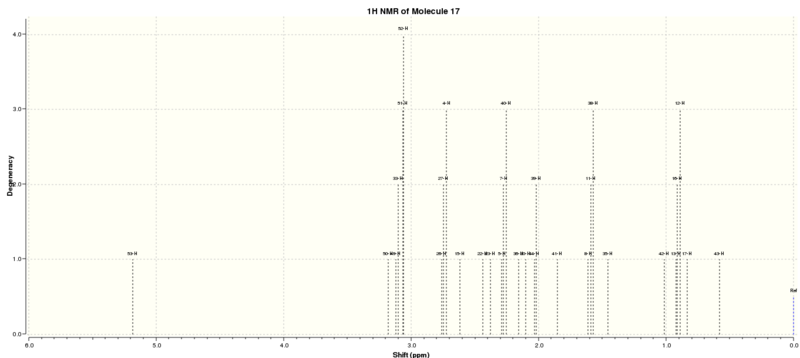
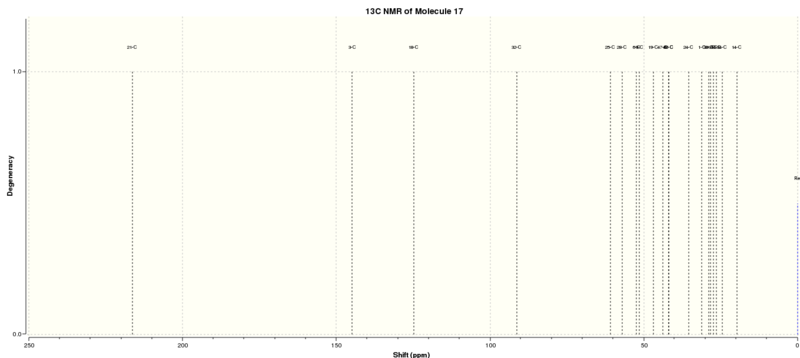
After that, the 13C and 1H NMR spectra were computed with chloroform as the solvent. The NMR spectra generated were referenced with TMS B3LYP/6-31G(d,p) Chloroform. The NMR results were summarised in Tables 6 and 7 and Figure 4 indicates the label of the atoms.
The 1H NMR (300MHz,C6D6) of this molecule was reported as follow: δ 5.21 (m, 1H), 3.00-2.70 (m, 6H), 2.70-2.35(m, 4H), 2.20-1.70 (m, 6H), 1.58 (t, J=5.4 Hz, 1H), 1.50-1.20 (m, 3H), 1.10 (s, 3H), 1.07 (s, 3H), 1.03 (s, 3H).[4] By comparing the data with the literature values it is observed that the computed 1H NMR does not match with experimental data very well.
13C NMR (75MHz, C6D6) of this molecule was reported with peaks at the following ppm: 221.49, 148.72, 120.90, 74.61, 60.53, 51.30, 50.94, 45.53, 43.28, 40.82, 38.73, 36.78, 35.47, 30.84, 30.00, 25.56, 25.35, 22.21, 21.39, 19.83.[4] In this case most of the chemical shifts are slightly higher than the experimental data but, however, it generally matches with the literature data. The difference in chemical shift could be due to the different temperatures as well as the solvent used as C6D6 was used in the literature.
Analysis of the properties of the synthesised alkene epoxides
The crystal structures of the Shi and Jacobsen catalysts
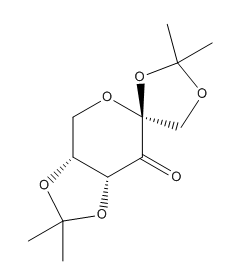
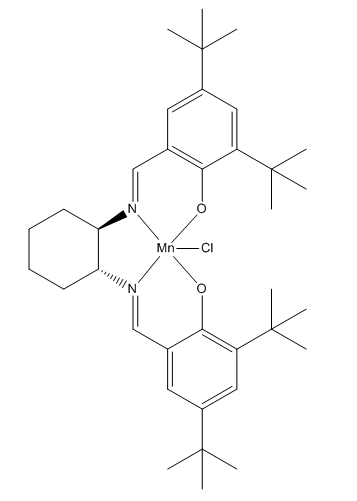
The Shi and Jacobsen catalysts (Molecules 21 and 23) were found from the Cambridge crystal database using Conquest and their 3D structure was viewed and analysed in Mercury.
The Shi Catalyst
The structure of the the Shi catalyst was illustrated in Table 8.[5]
| Molecule 21 | 3D Structure | |||
|---|---|---|---|---|
 |
|
All the C-O bond lengths were measured. It is observed that for the two anomeric centers there is one C-O bond which is shorter then the sum of covalent radii (142 pm) while another C-O bond is longer. This is due to the lone pair donation from the oxygen to the σ* orbital of the C-O bond. This shorten a C-O bond and lengthen another C-O bond as there are more electron density on the anti-bonding orbital. The shortened bond is due to the inductive withdrawing effect of the carbonyl group. Figure 5 illustrates the electron donation from the oxygen and the inductive withdrawing effect due to the carbonyl group.
The Jacobsen Catalyst
Table 9 shows the structure of the Jacobsen catalyst. [6]
| Molecule 23 | 3D Structure | |||
|---|---|---|---|---|
 |
|
In organic compounds, attraction between non-bonding H atoms is maximum at 2.4Å and repulsion predominates at a distance smaller than 2.1Å. Thus, the structure of the Jacobsen catalyst shows that there are three attractive and one repulsive interactions between two adjacent t-butyl groups. As a result, the attractive interactions stabilise the structure. It is observed that at the Mn center the molecule has a square based pyramidal structure with the chlorine atom bonded at the axial position. In order to minimise the torsion strain in this molecule, the ligand groups connected on the ring system are attached at the equatorial positions and the molecule adopts a square based pyramidal instead of trigonal bipyramid.
Calculated NMR properties of the epoxides
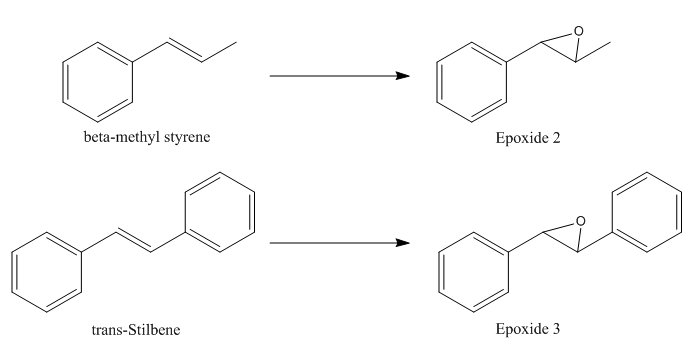
β-methyl styrene and trans-Stilbene were selected and their epoxidation reaction scheme was presented in Figure 6.
The epoxides were optimised using the MMFF94s mechanics force with 6-31G(d,P) basis sets at B3LYP level of theory and their 13C and 1H NMR spectra were computed using TMS B3LYP/6-31G(d,p) Chloroform as the solvent.
Epoxide 2
Epoxidation of β-methyl styrene gives an epoxide that could be with RR or SS conformations. The optimised structurs of epoxide 2 were summarized in Table 10.
| Epoxide 2 (RR) | Epoxide 2 (SS) | ||||||
|---|---|---|---|---|---|---|---|
|
|
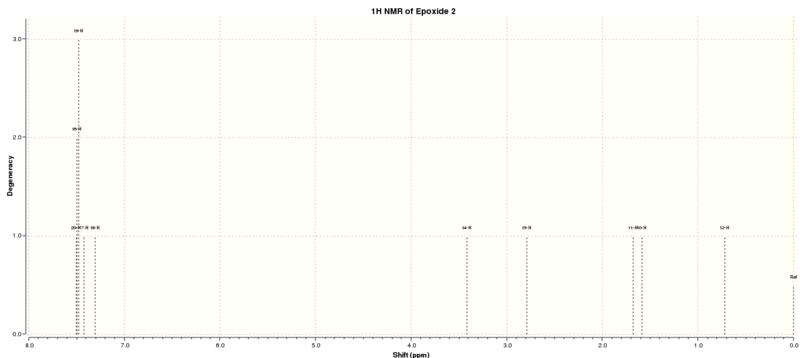
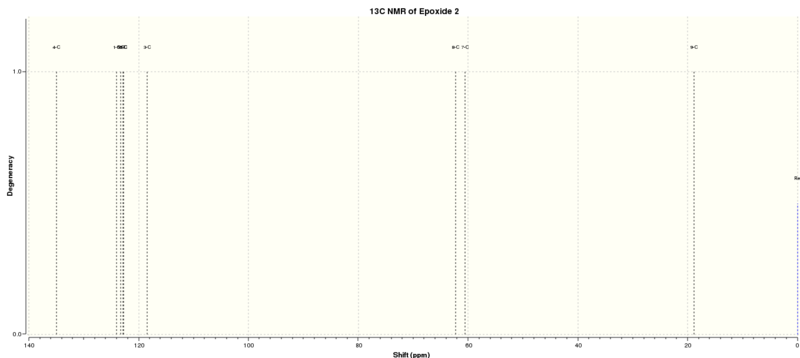
The NMR results were summarised in Tables 11 and 12 and Figure 7 indicates the label of the atoms.
Epoxide 3
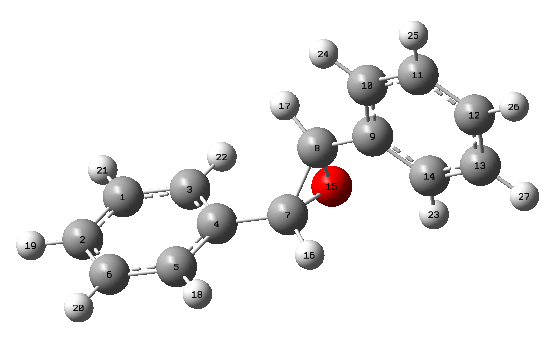
The optimised structures of epoxide 3 were summarized in Table 13.
| Epoxide 3 (RR) | Epoxide 3 (SS) | ||||||
|---|---|---|---|---|---|---|---|
|
|
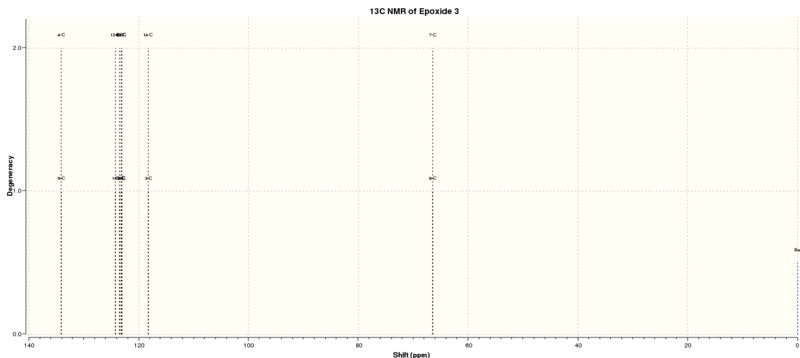
The NMR results were summarised in Tables 14 and 15 and Figure 8 indicates the label of the atoms.
| Calculated 1H NMR Spectrum | Atom (H) | Shift (ppm) | Degeneracy |
|---|---|---|---|
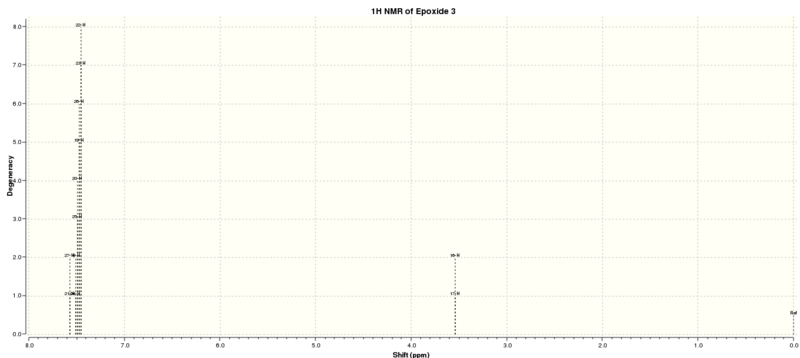 |
21, 27 | 7.5705347632 | 2 |
| 18, 19, 20, 22, 23, 24, 25, 26 | 7.5068914252 | 8 | |
| 16, 17 | 3.5377553022 | 2 |
Assigning the absolute configuration of the product
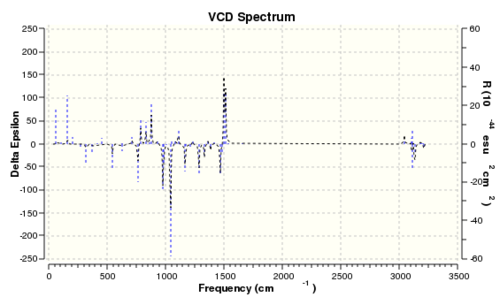
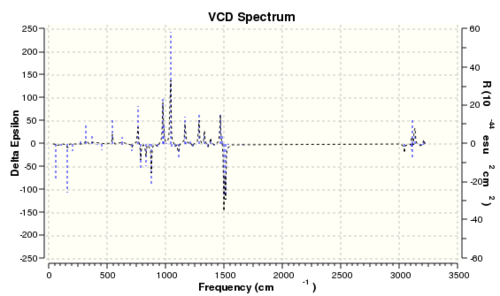
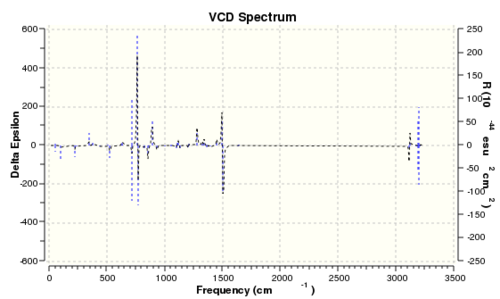
Since epoxides have two possible enantiomers, the RR or SS conformation, and they are indistinguishable by analysing their 1H and 13C NMR spectra, further investigation using different approaches must be conducted in order to identify their absolute configuration. There are three chiroptical properties that could be measured or computed in which each enantiomer produce different results, namely the optical rotation, the electronic circular dichroism (ECD) and the vibrational circular dichroism (VCD). However, the ECD is not useful in this case as there is no appropriate chromophore exists for epoxides. Thus, the optical rotation and the VCD of the epoxides were computed and compared.
The optical rotations
The optical rotation at 589 nm for each epoxide was computed at CAM-B3LYP/6-311++g(2df,p) and the results were summarised and compared with the literature data in Table 16.
| Computational Data | Literature Data[7][8][9] | |||
|---|---|---|---|---|
| Molecule | Optical rotation (Degree) | Optical rotation (Degree) | Conditions | Enantiometric Excess (%) |
| Epoxide 2 (RR) | 46.78 | 44.3 | 25°C, Chloroform, 0.32g/100ml | 90 |
| Epoxide 2 (SS) | -46.77 | -41.8 | 25°C, Chloroform, 1g/100ml | 99 |
| Epoxide 3 (RR) | 297.92 | 334.6 | 25°C, Chloroform, 0.73g/100ml | 97 |
| Epoxide 3 (SS) | -297.96 | -205.2 | 20°C, Chloroform, 0.56g/100ml | 89 |
By comparing the computed results with the literature, it shows that this optical rotation calculation method is reliable as the magnitudes and signs were corrected. However, the computed results deviated from the experimental results slightly.
The vibrational circular dichroism
| Epoxide 2 (RR) | Epoxide 2 (SS) |
|---|---|
 |
|
| Epoxide 3 (RR) | Epoxide 3 (SS) |
|---|---|
 |
|
It is interesting to note that if the VCD spectrum of the RR enantiomer is reflected along the x-axis, the reflected spectrum is identical to that of the SS enantiomer. This is mainly due to the fact that their vibrational environments are opposite to each other. Thus, it is possible to determine the absolute enantiomeric form if the VCD spectrum of the product is recorded. However, the instrument to record VCD spectra is absence in the department. Therefore, measuring the optical rotation of the product is the best and easiest way to determine its enantiomeric form.
Thermodynamic properties
It is possible to determine the enantiomeric excess for Shi epoxidation of trans-β-methyl styrene by analysing their thermodynamic properties. By obtaining the sum of electronic and thermal free energies of the RR and SS epoxides, the value of K between those enantiomers could be calculated by using ΔG=-RTlnK and hence the enantiomeric excess. The energies were presented in Table 19.
| RR Epoxide 2 (Hartrees) | SS Epoxide 2 (Hartrees) | |
|---|---|---|
| Sum of electronic and thermal free energies 1 | -1343.022970 | -1343.017942 |
| Sum of electronic and thermal free energies 2 | -1343.019233 | -1343.015603 |
| Sum of electronic and thermal free energies 3 | -1343.029272 | -1343.023766 |
| Sum of electronic and thermal free energies 4 | -1343.032443 | -1343.024742 |
| Average sum of electronic and thermal free energies | -1343.02598 | -1343.020513 |
The free energy difference between the RR and SS energies is therefore -0.00546625 Hartrees. Thus, the value of K is 326.9 and the enantiomeric excess is 99.4% for the RR enantiomer of epoxide 2 over the SS form. The enantiomeric excess result matches with the literature result very well and this confirmed that the literature assignment was correct. Thus, the RR enantiomer is expected to be the major product if the Shi catalyst is used in the epoxidation process.
Investigating the non-covalent interactions in the active-site of the reaction transition state
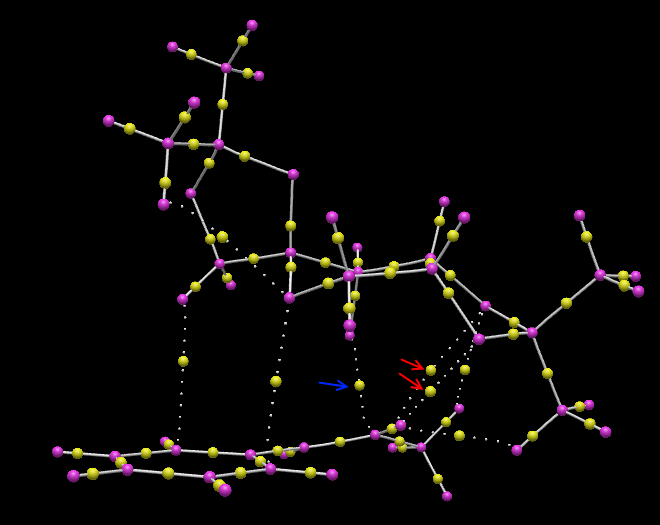
The transition state for Shi epoxidation of trans-β-methyl styrene with RR configuration was used to perform non-covalent-interaction (NCI) analysis. The result is shown in Figure 9.
Orbital |
It is observed that the catalyst binds to the substrate through the oxygen atoms, which are labelled in yellow. Thus, the substrate must position itself as shown in Figure 9 in order to maximise the interactions. To maximise the interactions, two of the oxygen atoms are directed to the methyl group of the alkene while the one of the oxygen atom is oriented to the phenyl group. This observation also illustrates the stereoselectivity of this reaction.
Investigating the Electronic topology (QTAIM) in the active-stie of the reaction transition state
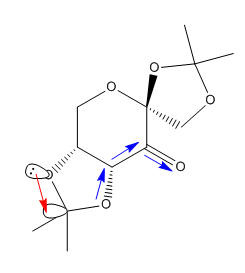
The R,R transition state for Shi epoxidation of trans-β-methyl styrene was subjected to a QTAIM anlysis. The result is displayed in Figure 10.
It is observed that the non-covalent interactions, indicated in red, between oxygen and hydrogen maintain the orientation of the reaction center. This ensures that when the covalent bond is formed between the oxygen and carbon atoms, which is indicated with a blue arrow, it will produce the epoxide with RR configuration.
Suggesting new candidates for investigations
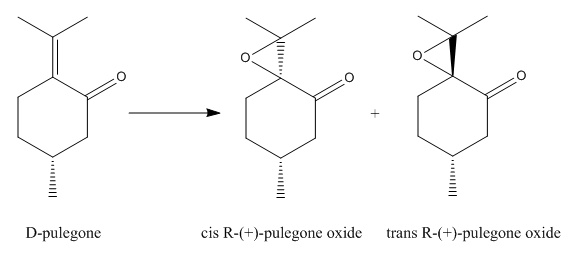
It was found that D-pulegone is a potential candidate for investigation. Epoxidation of D-pulegeon forms two enantiomers, cis R-(+)-pulegone oxide and trans R-(+)-pulegone oxide, in which one of the enantiomer has an optical roation of <-500 while the other is >500. The reaction scheme is shown in Figure 11.
Furthermore, D-pulegone is commercially available which makes the investigation feasible. The literature optical rotation of the enantiomers were listed in Table 20.[10]
| Molecule | Conditions | Optical rotation (Degree) |
|---|---|---|
| cis R-(+)-pulegone oxide | c=0.03; ethanol; 25oC | -1242.5 at 285nm |
| trans R-(+)-pulegone oxide | c=0.03; ethanol; 25oC | 562.3 at 290nm |
References
- ↑ S. W. Elmore and L. Paquette, Tetrahedron Letters, 1991, 319 (DOI:10.1016/S0040-4039(00)92617-0 10.1016/S0040-4039(00)92617-0 10.1016/S0040-4039(00)92617-0 )
- ↑ J. G. Vinter and H. M. R. Hoffman, J. Am. Chem. Soc., 1974, 96, 5466–5478 (DOI:10.1021/ja00824a025 )
- ↑ 3.0 3.1 W. F. Maier and P. V. R. Schleyer, Journal of the American Chemical Society, 1981, 103, 1891–1900. (DOI:10.1021/ja00398a003 )
- ↑ 4.0 4.1 L. A. Paquette, N. A. Pegg, D. Toops, G. D. Maynard, and R. D. Rogers, Journal of the American Chemical Society, 1990, 112, 277–283. (DOI:10.1021/ja00157a043 )
- ↑ Z.-X. Wang, S. M. Miller, O. P. Anderson, and Y. Shi, The Journal of Organic Chemistry, 2001, 66, 521–530. (DOI:10.1021/jo001343i )
- ↑ J. W. Yoon, T.-S. Yoon, S. W. Lee, and W. Shin, Acta Crystallographica Section C Crystal Structure Communications, 1999, 55, 1766–1769. (DOI:10.1107/S0108270199009397 )
- ↑ O. A. Wong, B. Wang, M.-X. Zhao, and Y. Shi, The Journal of organic chemistry, '2009, 74, 6335–8. (DOI:10.1021/jo900739q )
- ↑ H. Lin, Y. Liu, and Z.-L. Wu, Tetrahedron: Asymmetry, 2011, 22, 134–137. (DOI:10.1016/j.tetasy.2010.12.0228 )
- ↑ T. Niwa and M. Nakada, Journal of the American Chemical Society, 2012, 134, 13538–41. (DOI:10.1021/ja304219s )
- ↑ W. Reusch and C. K. Johnson, J. Org. Chem., 1963, 28, 2557–2560.


