Rep:Mod:TINGTINGTING
Module 2: Inorganic Chemistry
Part I - Required Exercises
Introduction Module
To begin with an introduction module was undertaken. This had the aim of demonstrating the usage of the programs involved and proved very useful in terms of familiarisation with the techniques involved.
The molecule created was BH3. The result of the first optimisation is summarised in the below summary file.
| BH3 Initial Optimisation | |
| Initial Output | 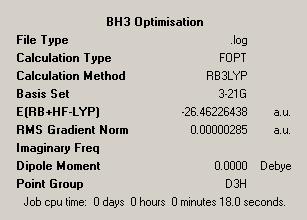
|
This initial optimisation was then analysed by looking at the log file. It could be seen that in the optimisation the B-H bond length has changed from the original artificially elongated distance of 1.5Å to an optimised value of 1.19Å. Additionally optimisation has occured to the H-B-H bond angle, however this has not changed from the original value of 120.0°.
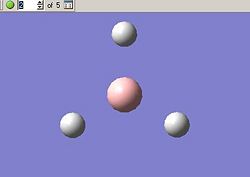
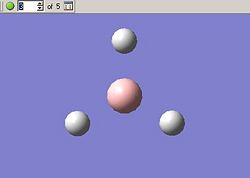
The optimisation can be followed both in 3D and graphically, these results are given in the below tables. First we can see all of the steps as the bond length decreases, this is given as a five step process by GaussView.
|
BH3 Optimisation With Gaussian | |||||
| Optimisation Step | 1 | 2 | 3 | 4 | 5 |
| Molecular Structure | 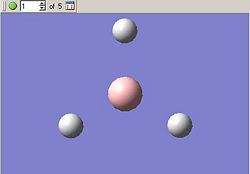
|
|
|
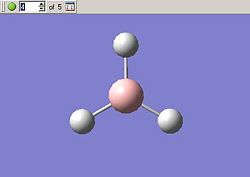
|
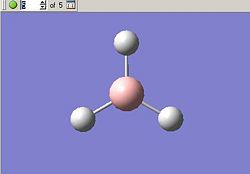
|
It is also possible to obtain plots of the change in the total energy as this moves to a minimum value which is the most stable structure and as such the ground state.
| Plot of Energy | 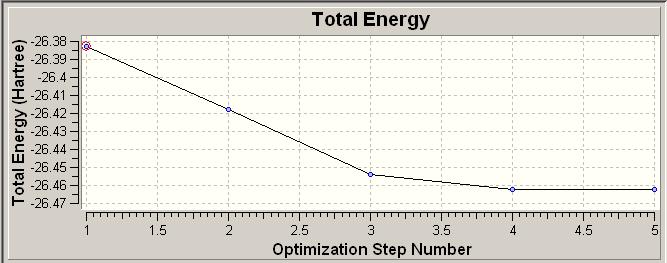
| |
A further plot of the change in Root Mean Square gradient can be seen. The physical meaning of such a plot will be discussed in the main part of the report.
| RMS Gradient | 
| |
Day One
BCl3 Optimisation
Following the introduction looking at BH3 a logical progression was to look at a related molecule in BCl3, which obviously differs from the original molecule by a change of the substituent atom. This will fundamentally cause an increase in the dipole of each bond, due to the electron withdrawing nature of Cl atoms. This is however not expected to change the overall dipole of the molecule due to the cancelling of the dipoles over the whole system.
Below we can see a summary of the key information relating to the optimisation carried out.
| BCl3 Initial Optimisation | |
| Initial Output | 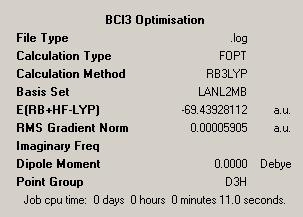
|
It is noticed that the point group of the molecule is given as D3H, this was ensured by constraining the symmetry of the molecule in GaussView. In addition to this the tolerance of the symmetry was set to "Very Tight". These were necesary measures to ensure that in the later calculations, for example when viewing the molecular orbitals, no problems were encountered.
A wealth of information can be taken from the summary file shown. Firstly the file type is demonstrated, this shows the Gaussian log file has been used to generate the information shown. The log file is the output file generated from the Gaussian calculation and contains details of the starting values and the optimised values as well as the iterations undertaken to get from start to finish.
The summary also displays the calculation type which is simply the calculation or 'job' which has been done, in this case this is FOPT, which is the optimisation. We could have carried out a wide range of calculations, such as the frequency, which gives details of the vibrational modes of the molecule, or NMR, which predicts the NMR spectrum of a the molecule in question. Both of these calculations prove very useful in theoretical studies.
The calculation method used is given as B3LYP, this is an acronym which stands for "Becke, three-parameter, Lee-Yang-Parr". This is one type of DFT, Density Functional Theory. This theory is based on the idea of predicting properties of a system by summing together other functionals which describe the distribution of electons in a system. This is a method which is more advanced than the Hartree Fock method and so DFT has come to the forefront as a more accurate technique for predicting properties of a system.
Further we can see the basis set which was employed. In this case this is LANL2MB. The basis set is the basic functions from which the molecular orbitals are built up. LANL2MB is an example of a medium level basis set and as such is more advanced than the 3-21G basis set we employed with BH3. This means we get more accurate results but the calculation will take slightly longer, though as the calculation only took 11 seconds to carry out we are happy to wait for this amount of time!
The energy of the molecule is also given, this is stated as -69.44 Hartrees, which corresponds to -43574kcal mol-1. This shows us that BCl3 is stable. As was briefly outlined before we expect to find no net dipole in the molecule and this is indeed what we see.
The other value which is given is the Root Mean Square Gradient. This is a very small value which is good. As we reach the equilibrium structure this value gets smaller and smaller, hopefully converging to a value of effectively zero. This is because the RMS gradient is the first derivative of the energy curve. As the energy reaches a minimum the gradient at this point is zero, due to the minimum being a stationary point. Hence this value is used by the program and those carrying out calculations to hopefully ensure a minimum has been found and that we have not been "stuck" at a local minima.
We can look at the output file in detail to see the physical impact of the optimisation. We can see that the initial parameters give the B-Cl bond length as 1.87Å and the Cl-B-Cl bond angle as 120°. We can then see that these have been optimised, within the relevent limits of accuracy, to 1.87Å and the Cl-B-Cl bond angle is given as 120°, as such the initial parameters were very close to the optimised values.
CHCl3 Optimisation
In order to investigate further these techniques a further small molecule was chosen and optimised. CHCl3 was chosen for this purpose.
| CHCl3 Initial Optimisation | |
| Initial Output | 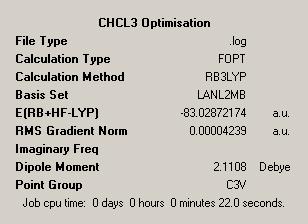
|
Again the summary file elutes a wealth of information. As the method of optimisation employed is the same as used for the previous molecule some of the information given is the same. We again have a log file as the output used and have used the B3LYP method with a LANL2MB basis set. Finally as expected we see a very small number for the RMS gradient, so we are confident we have optimised well to reach a minimum.
The energy is given as -83.03 Hartrees which corresponds to -52102kcal mol-1. The dipole moment due to the electron withdrawing effect of the Chlorine atoms is given as 2.1Debye, this is expected due to the fact that the dipoles do not cancel over space. Additionally the point group of the molecule is given, this is stated to be C3V which is indeed the point group of CHCl3.
The final piece of information given is the length of time taken to perform the calculation. At 22 seconds this is twice as long as the previous calculation for BCl3. An increased time might be expected due to the extra atoms and increased dipole moment. Additionally the RMS gradient is smaller in this case, implying the minimum is even closer to the lowest energy of the molecule.
Again we can use the output file to see the impact of the optimisation. The initial parameters give the C-H bond length as 1.07Å and the C-Cl bond length as 1.76Å. These have been found to optimise to 1.11Å and 1.92Å respectively which are both significantly higher than the starting values. The same can be done for the bond angles, which all start out at 109.5°. In the final output the H-C-Cl angle is given as 108.2°, while the Cl-C-Cl bond angle is given as 110.7°.
Further to this the output file can be used to tabulate the co-ordinates of the atoms in the molecules. This is given below:
| Co-ordinates of Atoms | |||
| Atom | X | Y | Z |
| C | 0.000000 | 0.000000 | 0.000000 |
| H | 0.000000 | 0.000000 | 1.070000 |
| Cl | 1.659344 | 0.000000 | (-)0.586667 |
| Cl' | (-)0.829672 | 1.437034 | (-)0.586667 |
| Cl | (-)0.829672 | (-)1.437034 | (-)0.586667 |
Again we can tabulate the bond lengths and bond angles to compare the original parameters to the final optimised values.
| Bond Angles and Bond Distances | |||
| Variable | Initial Value | Optimised Value | |
| C-H Bond Length | 1.07 | 1.11 | |
| C-Cl Bond Length | 1.76 | 1.92 | |
| H-C-Cl Bond Angle | 109.5 | 108.2 | |
| Cl-C-Cl Bond Angle | 109.5 | 110.7 | |
From this it has been seen that by the use of computational studies we can find and compare a number of variables relating to the molecule, its geometry and bonding. In all cases here we see as increase in the bond length with all of the substituents moving away from the carbon centre.
Additionally we see the bond angles all change. Before optimisation all of the bond angles are the same, in line with the structure being of perfect tetrahedral geometry. After optimisation the Cl atoms have all moved away from each other due to their repulsion from one another. The result of this is the increased Cl-C-Cl bond angle as all of the Cl atoms move upwards towards a more planar structure. This means that the H-C-Cl bond angle decreases as the Cl atoms being close to planarity results in the bond angle moving closer to 90°.
Vibrational Analysis
Having now looked at optimisation of a number of molecules the intention was now to look in more detail at the sheer power of computational studies and in doing so generating the predicted vibrations of a molecule. Again we return to BH3 as the molecule in question.
In a similar way to how it was possible to optimise a molecule it was possible to predict the vibrations of a molecule. In order to ensure that the vibrations predicted were as close as possible to the real situation the input for this calculation was the optimised molecule previously generated from the optimisation steps.
In order to calculate the vibrations the molecule was opened in GaussView and then the calculation of 'frequency' was then chosen and the input submitted for calculation.
The result of this was the predicted vibrational modes of BH3. This consisted of 6 vibrations for the stretching, scissoring and wagging of the molecule. This information is tabulated in the below table, along with the relevent frequency, intensity and symmetry of the vibration.
As was expected the vibrational modes of the molecule yields a lot of data about the molecule, which can be rationalised when looking at this from fundamental theory. On first assessment all of the vibrations are positive in nature, which allows us to be sure we have in fact found a ground state structure as opposed to a different local minima, such as a transition state.
We see the lowest frequency of the vibrations as being the so-called wagging of the bonds. As this is the lowest frequency vibration it is, due to the direct proportionality of frequency to energy, the lowest energy vibration. This is not unexpected as wagging of molecules generally occurs in or around the fingerprint region of IR spectra. This is the second most intense of the vibrations we see, an observation which can be rationalised by taking into account what the root of the intensity is. The fundamental need of an absorption in the IR spectrum is that it must involve a change in dipole moment. Hence the intensity of a vibration is dependent on the change in dipole moment involved in a vibration with the highest change in dipole moment being reflected in the most intense peak in an IR Spectrum. Returning to the Wagging vibration we can see that this is the most intense as we see a large dipole moment when the hydrogen atoms move away from the Boron centre and so this is an intense peak.
The second vibration we see is two degenerate vibrations for the scissoring of the molecule. This has low intensity due to the limited change in the overall dipole of the molecule.
Thirdly we see the symmetric stretch of the molecule. This is quoted as having an intensity of 0 which at first seems strange. Though relating again to the fundamentals of IR techniques we would have expected this as the symmetrical nature of the stretch means that all of the instantaneous dipoles cancel, leaving us with no net dipole and so zero intensity in the IR Spectrum.
The final stretch is the most intense, implying the largest change in dipole. It is the assymetric stretch of the molecule and so this would make sense that this requires the largest energy input.
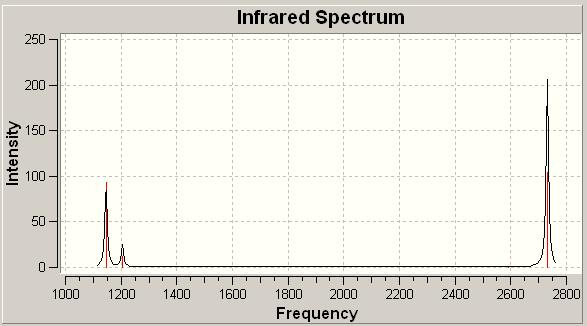
The complete predicted spectrum can be seen below, graphically demonstrating the relative intensities of the vibrations.
| BH3 IR Spectrum | |
| |
This has very good correlation with the spectra which are prevelent in the literature[1], and so the value of the computational study in predicting the spectrum has been shown. The possible uses of this in actual studies are large as this could be used to predict a spectra and may help us to understand why a spectrum looks the way it does.
Analysis of Molecular Orbitals
GaussView, with the aid of Gaussian is also able to predict the molecular orbitals of a given molecule. This means the electronic distibution around a molecule can be seen, as well as the orbitals. This can be extremely useful when we want to look at the HOMO of a molecule to see if it could act as a nucleophile or conversely if we have an orbital which could be attacked nucleophilically.
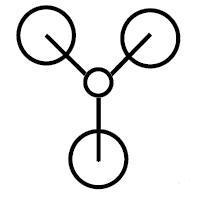
For this purpose it is useful to have a theoretical idea of the orbitals in questions to allow comparison with prediction and computation. The MO diagram of BH3 can be generated to show the theoretical orbitals of the molecule in question.
This results in the following diagram:

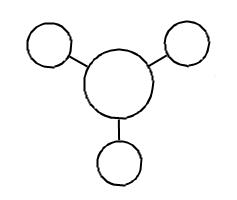
As discussed it is relatively easy to generate the Molecular Orbitals using Gaussian. It was then possible to tabulate the generated MOs as well as the theoretical predictions to allow easy comparison of the two. This is done below:
| Orbital Number | Computationally Generated MO | Theoretically Generated MO |
| 1 | 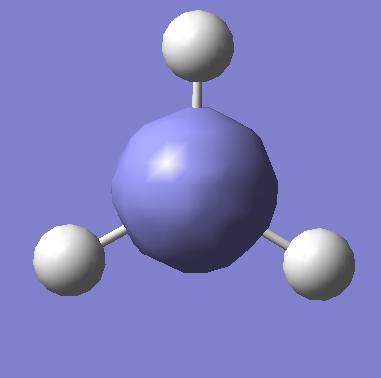
|
|
| 2 | 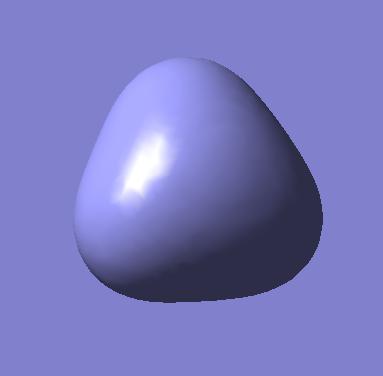
|
|
| 3 (HOMO) | 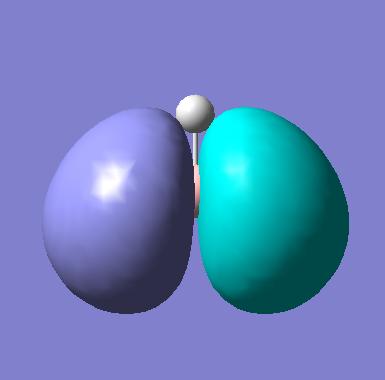
|

|
| 4 (HOMO) | 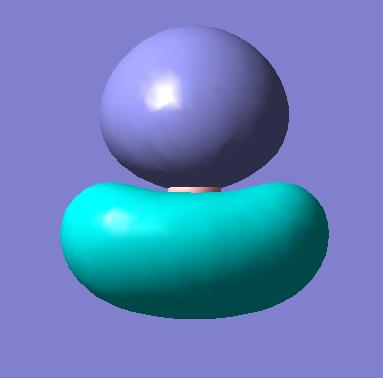
|

|
| 5 (LUMO) | 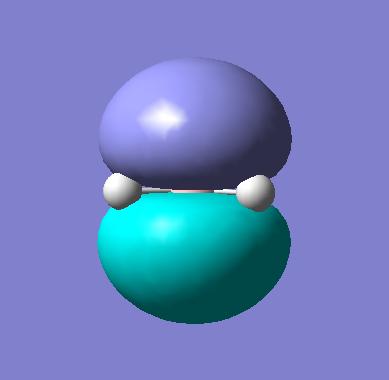
|

|
The first observation is the excellent correlation between the predicted orbitals and those generated by Gaussian. This shows the technique does in fact reflect basic MO theory, which is clearly a good thing! We can see, by the 3D predictions, how the actual orbitals would overlap. This is a fantastic tool as we have taken a 2D picture and in a very short space of time generated an interactive 3D picture which we can use to then rationalise the orbital interactions present in a molecule.
In order to understand the images generated we can think about actual MO theory. For example the proximity of an atomic orbital to the molecular orbital determines how much this AO contributes to the final MO and so indicates how close in structure the two will be. This can be used to provide a link between the quantitive orbitals which we have formed and the qualitative orbitals we have predicted from MO theory.
A further important observation is related to the LUMO. As this is unoccupied the calculation for this is less important as it contains no electron density. Additionally as this is the highest energy orbital and so will be furthest from the nucleus we can see why what is infact just the pz orbital is shown as such a large and diffuse orbital.
Day Two
Transition Metal Isomerisation
The aim of this study was to, by the use of computational techniques, predict the thermal stability and spectral characteristics of two isomers of the compound [Mo(CO)4(PMe3)2]. The basic idea was to optimise the two structures and obtain their relative energies, these would then be compared to see which of the structures is in fact the lowest in energy and so most stable thermally. It was then also intended to generate the IR Spectra of these spectra so these could then be compared with literature to see whether our predicted spectra match well with those found in experimental studies.
With the molecules being used being quite large in size and complex in terms of substituents in comparison with the previous simple structures it was important that the molecule was optimised step by step. Firstly a DFT calculation was carried out with a B3LYP hybrid functional and a LANL2MB pseudopotential to optimise to get a rough estimate of the geometry. We employ pseudopotentials only when we have molecules with a large number of electrons. These pseudopotentials are very important for second row elemetns and beyond, these use well defined and accepted approximations to describe the inner core electrons. By doing so they reduce the computational cost and improve the time taken to perform a calculation by allowing the calculation to only take account of the valence electrons. The LANL2MB pseudopotential as such uses different levels of accuracy for different atoms, the first row elements are modelled using STO-3G, the most basic level of Gaussian modelling, the elements Na-La and Hf-Bi are modelled with Los Alamos ECP (Effective Core Potential). The MB in this case describes the simple basis set used here.
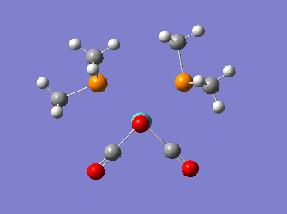
Additionally the convergence criteria were set as loose to ensure that the calculation will actually converge. The result of this was the cis DOI:10042/to-1776 and trans DOI:10042/to-1817 isomers which could then be further optimised. The structures from these first optimisations can be seen in the below table, along with the summary files with information about the calculations performed.
| Optimisation 1 | |||
| Cis Optimised Structure 1 | Cis Summary File | ||
|

| ||
| Trans Optimised File 1 | Trans Summary File | ||

|

| ||
The first thing we can see is a difference in the two relative energies. This is 0.00933395 Hartree in favour of the cis isomer being the most stable, this is equivalent to almost 25kJ mol-1. The reason for this difference is not immediately apparent as initially, from a steric point of view one might have expected the trans isomer to be more stable. As this is not clear the idea of performing further calculations is very worthwhile as this may help us to understand further the results we see.
The other big difference between the two molecules is the dipole moment. The trans isomer being symmetric has no net dipole as over 3 dimensions all of the bond dipoles cancel, leaving zero dipole. The same is obviously not true for the cis form where the two PMe3 groups are on the same side of the molecule. This therefore means the bond dipoles, due to the CO groups do not cancel over 3 dimensions and so in contrast to the trans case here we will see a net dipole.
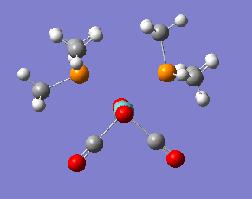
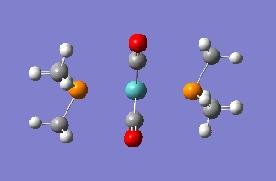
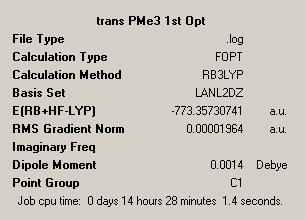
From this we haven't estabilished a huge amount of information about the two isomers. These crude initial approximations could then be taken further with additional computational modelling. This was done by employing a LANL2DZ psuedopotential which improved the accuracy of the calculations. This is very similar to the LANL2MB option but instead of using the basic MB basis set we use a DZ basis set which is a much more accurate method. The result was again two seperate outputs for both the cis DOI:10042/to-1842 and transDOI:10042/to-1843 form of the complex.
| Optimisation 2 | |||
| Cis Optimised Structure 2 | Cis Summary File | ||
|

| ||
| Trans Optimised File 2 | Trans Summary File | ||
|
| ||
Again the cis isomer can be seen to be of lower energy, though this is now only a difference of 0.00293227 Hartree. In this case this is approximately 8kJ mol-1. The realtionships and data regarding each of the isomers generated in this optimisation does not differ hugely from the data from the original optimisation.
In analysing the output for these two isomers we see an alarming message which tells us that that the P atoms "may be hypervalent but have no d-functions". This is a note referring to the fact that the d-orbitals may take some part in the bonding and connectivity of the molecule but this is unknown as they are not accounted for in the calculations. In order to rectify this it is possible to perform a further calculation using Gaussian. This is done by altering the input file to # opt b3lyp/lanl2mb geom=connectivity extrabasis. This was done to generate the most accurate structures possible with which to work.
Again the results are tabulated:
| Final Optimisation | |||
| Cis Final Optimised Structure DOI:10042/to-1878 | Cis Summary File | ||

|

| ||
| Trans Final Optimised Structure DOI:10042/to-1879 | Trans Summary File | ||

|
| ||
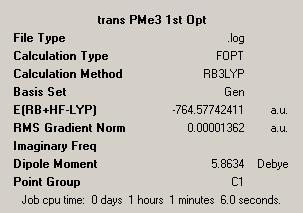
In researching the literature we see this type of study is prevalent. Interest in this field is due to the possibility of seeing both isomers. The cis is reported to be kinetically favoured, while the trans is thermodynamically favoured. The result of our final optimisation is that we see the trans structure is in fact the lowest in energy by 0.00260749 Hartree (7kJ mol-1). This is in fact as predicted and given in the literature[2].
The Literature gives a large amount of information which can be compared to our computationally generated values to see how accurate we have been. The literature comparison we have is of a closely related compound, that of [Mo(CO)4(PPh3)2]. This slight difference is expected to be noticed in the P-C bond lengths as the substituents will be different and so the bond length will not be identical. This should not affect the Mo-P or Mo-CO bond lengths in any noticeable way. The tabulated comparison is given below:
| Trans Comparison[3] | |||
| Property | Literature | Computation | |
| Mo-P Bond Length | 2.500 | 2.54 | |
| Mo-C Bond Length | 2.005 | 2.05 | |
| P-C Bond Length | 1.828 | 1.91 | |
| C-O Bond Length | 1.164 | 1.20 | |
| P-Mo-P Angle | 180.0 | 180.0 | |
| P-Mo-C Angle | 87.2 | 88.9 | |
| C-Mo-C Angle | 180.0 | 180.0 | |
We find a very good correlation between the bond lengths and angles. The Mo-P and Mo-C bond lengths are very close to the literature values, this is as expected due to the close nature of the molecules compared. The P-C bond length is slightly different. This can be explained due to the differences in the carbon substituents. The phenyl group in the literature compound has a larger electron density, as such this could explain why we see a smaller bond length for the P-C bond length. The final bond length we compare is the C-O bond length. This is close to the literature value but not exactly correct. The literature value is shorter meaning the C-O bond is stronger in the literature example. This may be could be explained by considering the effect of synergic bonding. If there is a smaller amount of back donation from the metal centre into the C-O antibonding orbital this will result in a stronger C-O bond and so a shorter bond distance.
We can do a similar analysis of the bonding angles. We see 180° bond angles for the P-Mo-P bond in both literature and computation. The identical situation is seen for the C-Mo-C bond. This is consistent with a fairly planar structure with quite a large amount of symmetry in the trans structure. The final angle reported is that of the P-Mo-C bond angle. In both cases this is given as less than 90°. As such we see a good correlation between literature and computation. This means we can be confident of the results we have obtained.
We can also research the literature and produce a similar comparision for the data from the cis isomer. In contrast to the situation in the trans isomer we can now find the exact compound with which to compare our computational study.
| Cis Comparison[4] | |||
| Property | Literature | Computation | |
| Mo-P Bond Length | 2.522 | 2.62 | |
| Mo-C Bond Length | 2.032 | 2.00 | |
| P-C Bond Length | 1.85 | 1.92 | |
| C-O Bond Length | 1.14 | 1.20 | |
| P-Mo-P Angle | 97.54 | 95.110 | |
| P-Mo-C Angle | 89.6 | 90.0 | |
| C-Mo-C Angle | 89.4 | 89.2 | |
The Mo-P bond length is long in both cases, this is longer than the trans isomer. We see some difference between the literature and the computation though this does not seem so large to cause concern. The d-orbitals on phosphorous have been shown to be important by the computational study though they are still not fully taken into account, this could be the reason why the bond lengths seen are not identical. We see good correlation between the Mo-C bond lengths in the molecule which again gives us confidence in the computation.
The P-C bond length is longer in the computation than in the literature, this could be explained by d-orbital contribution which has not been modelled in the computation. Similarly we see a difference with the C-O bond length which was again the case in the former trans isomer. Again as we have not fully accounted for the d-orbitals this difference can be attributed as being a possible effect of this igonorance of the d-orbitals.
The bond angles can also be considered. Possibly the most important bond angle is the P-Mo-P angle. This is given as 95.1° in the computational study this matches well to the 97.54° given by the literature. This is notably different from 90° as would be given for a planar structure. This is an effect due to the Phosphorous atoms, with their large steric bulk and their d-orbitals.
Finally we have the P-Mo-C and C-Mo-C bond angles both of which show good correlation between the computation and the literature. In total the correlation between computation and literature is very good in this case
As can be seen the geometry has an effect on the compound generated, its bond lengths and angles as well as its relative energy and stability, thus justifying the large importance put upon geometry in studies. Both of the isomers have been well modelled, with neither being less accurate or useful than the other. We can be confident of the use of computational modelling as this gives us a good fit to literature values.
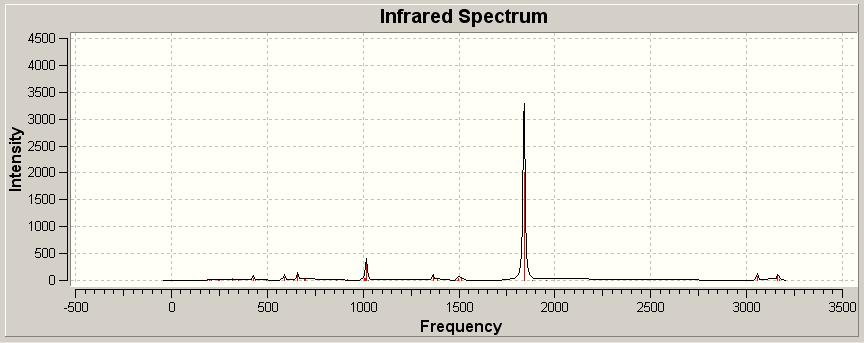
These highly optimised structures could then be used to predict the infrared spectra of the two isomers. The resulting spectra are given below:
| Tabulated IR Spectra | |||
| Cis Optimised Structure IR DOI:10042/to-1792 | |||

| |||
| Trans Optimised Structure IR DOI:10042/to-1791 | |||
| |||
The dominant stretches in both spectra are the CO stretches, and as these are the main differences between the two spectra these are the stretches which we compare to analyse the spectra. The tabulated stretches are given in the below table.
| Tabulated IR Absorptions | |||
| CIS CO IR STRETCHES | ' | TRANS CO IR STRETCHES | ' |
| Frequency | Intensity | Frequency | Intensity |
| 1960.51 | 321.778 | 1954.58 | 0 |
| 1870.02 | 666.711 | 1882.86 | 0.0001 |
| 1850.78 | 1960.96 | 1839.36 | 2009.16 |
| 1848.52 | 1068.11 | 1839.16 | 1998.08 |
Again the literature can provide useful comparison for these spectra. The literature values are tabulated below:
| Tabulated Literature IR Absorptions | |||
| CIS CO IR STRETCHES | TRANS CO IR STRETCHES | ||
| Frequency | Frequency | ||
| 2019 | |||
| 1922 | |||
| 1905 | |||
| 1899 | 1895 | ||
The IR spectra are in fact similar, this is not exactly unexpected since the two compounds are isomers of one another.
The main difference as previously highlighted is the CO stretches. These are really what allows us to tell the two apart from a spectral point of view. Notably the cis spectrum has 4 stretches, where as the trans has only one. The reason for this difference is the need for a change in dipole moment for a vibration to be IR active. The trans isomer has no net dipole and is more symmetric than the cis isomer this means that fewer of the vibrations are in fact IR active. This means that we see fewer vibrations as IR active and so fewer are present in the spectrum observed.
The difference in symmetry and so the number of IR active bands is explained well by the psuedo symmetries of the two molecules, the trans isomer has a pseudo symmetry of D4H showing it is fairly symmetric and so will have fewer vibrations resulting in a change in dipole moment and so being IR active. In contrast the cis isomer has a C2V psuedosymmetry, indicative of it having more IR active bands and so visible absorptions. If we did wish to see evidence of all of these CO stretches we would need to employ Raman Spectroscopy.
Though the number of IR stretches and their relative intensities in the computation agrees with literature this is not the case for the actual frequencies of the stretches. In all cases the computation values are approximately 50cm-1 lower than the literature values. Going back to first principles again the wavenumber of a stretch is directly related to the energy required to cause vibration of the bond and so the strength of the bond. All of the literature values are higher than the predicted values. This means that all of the CO bonds reported in the literature are in fact stronger than the predicted CO bonds. Reasons for this are not immediately clear. A stronger CO bond can be seen as having a larger electron density in the CO bonding orbitals, or a smaller amount of electron density in the CO antibonding orbitals. More bonding electron density is gained by a smaller donation of electron density into the metal d-orbitals, less antibonding density is given by a reduction in backbonding from the d-orbitals into the CO p* orbitals. Both of these involve the metal d-orbitals and so the limited consideration of these orbitals may be the reason behind the difference in computation and literature.
In summary we can now look at the initial aims of this study and see what our computational study has allowed us to conclude. We began with the intention of optimising the structures and so seeing which is in fact the lowest in energy and so most stable thermally. Gaining an accurate picture, which agreed with what may have been expected from simple steric considerations as well as literature observations, required the use of more advanced techniques than originally intended. This was due to the need to include d-orbitals in our approximations. The result of this was that the trans isomer was the more stable by a value of approximately 7kJ mol-1.
Additionally we looked at the computationally generated IR Spectra of these isomers and compared these findings with literature. Here literature confirmed what our computation had predicted.
This cis/trans favourability could be altered by changing the ligands used. In literature the trend appears that the cis form is more stable with poor pi-acceptor ligands while the trans form is preferred with good pi-acceptor ligands. This is proven by the trans preference with the Phosphine substituents which are good pi acceptors due to the d-orbitals on phosphorous.
As such by altering the pi accepting nature of the ligands used we can change between cis and trans selectivity.
Day Three
Ammonia Inversion
With the confidence in applying the techniques and calculations of GaussView from the previous exercises the more optimistic aim of following an actual reaction pathway was now set. The chosen pathway was the inversion mechanism of ammonia which moves from the C3V ground state, through a planar transition state with supposed D3H, to the inverted structure.
The first thing that needed to be done was to draw and optimise these structures. This was done with a B3LYP method, as had been used for previous optimisations, with a 6-31G basis set. This was a more advanced basis set than that which had been used before. 6-31G is a more advanced version of the fairly basic 3-21G basis set. Both of these are examples of STOs, Slater Type Orbitals, which use varied numbers of Gaussian functions to make up the orbitals. The first number, in our case 6, describes the number of Gaussian functions which are used to make up the inner shell orbitals. The second and third numbers also describe the number of Gaussian functions used in the approximation. In this case the second number, in our basis set 3, is the number of fucntions which make up the first Slater Type Orbital, where as the third number, in both cases 1, describes the number of functions used to make up the second STO.
As well as this ground state structure two other structures were modelled and subsequently optimised. The first of these involved lengthening the bond length of one of the NH bonds. The effect of this was to reduce the symmetry of the molecule and was made by possible by choosing to 'Ignore Symmetry' in the optimisation.
Finally a planar transition state like NH3 molecule was modelled. This again required additional work in GaussView in the addition of a 'Dummy Atom' which allowed the structure to attain (and maintain) a planar structure when optimised.
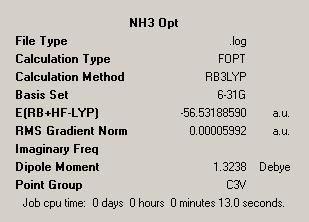
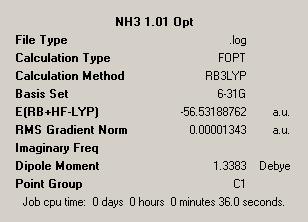
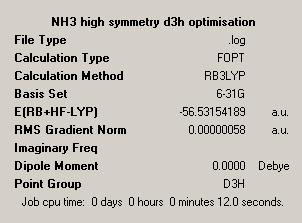
The results of these optimisations are given in the below table with the summary files and the relevent point groups included for easy reference and comparison.
| Symmetry Study of NH3 | |||
| NH3 Optimisation | NH3 1.01 Optimisation | Dummy Atom NH3 Optimisation | |
|
|
| |
| Symmetry = C3V | Symmetry = C1 | Symmetry = D3H | |
The first observation we can make is the point groups of each of the molecules. This is a simple way to see if anything out of the ordinary or unexpected has happened in the optimisations. The point groups meet the predictions, which give the ground state structure as C3V, which is considered as the point group for ground state ammonia. The reduced symmetry version, with one artificially lengthened bond has a C1 point group. This makes sense as from a symmetry point of view C1 is a sub group of C3V and so shows that this structure is a lower symmetry version of the ground state ammonia structure.
Finally we see that the point group of planar NH3 is given as D3H. This follows from the observation that this planar structure is analogous to the BH3 structure which was well defined as D3H by the previous studies. As such the point groups of the structures generated fit with the expectations we have of them meaning our predictions about the structures were correct.
The symmetry of the structures has in fact had an effect on the structures obtained. Comparing the C3V ground state and the D3H supposed transition state we see a clear difference in that the former is non-planar while the latter is planar. This means the ground state is much less symmetrical than the transition state, an observation in line with the fact that C3V is a sub-group, and so in essence a reduced symmetry version of the D3H point group.
In comparing the first and second, i.e. C3V and C1 structures, we see few differences. A notable difference is that fact that the C1 structure is less symmetric than the C3V structure which can be explained when one considers that, as previous, C1 is a sub-group of C3V.
We can also look at these summaries to see the time taken to complete the optimisation. In doing so we can see that the symmetry does appear to have had an effect on the time taken to complete the optimisation with the highest symmetry structure taking the least time to optimise, while the lowest symmetry molecule has taken the longest time to run. When considering this phenomena it can be understood by taking into account how the optmisation will run. In the high symmetry case this will need to go through fewer iterations than the ground state case and so as the calculation will be completed in fewer steps it will be faster in completing and so we see the most symmetrical structure will optimise fastest.
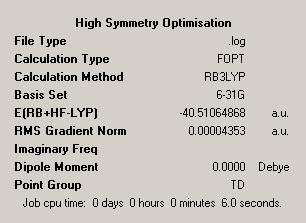
In order to test this hypothesis more completely a small control study was undertaken. To do this a both a high and low symmetry molecule was optimised, the molecules chosen were methane and then a tri-substituted analogue in bromochlorofluoro-methane. The results are given in the below table.
| Symmetry Study | |||
| Methane Optimisation | Bromochlorofluoro-methane Optimisation | ||
|

| ||
| Symmetry = TD | Symmetry = C1 | ||
| Time Taken = 6s | Time Taken = 70s | ||
Here we see, even in what is admittedly an extreme example that in fact a lack of symmetry does indeed result in an increase in the time taken to optimise a molecule. Hence optimisation is dependent on the symmetry with an increase in symmetry causing a decrease in optimisation time.
It is not simple for a molecule to break symmetry during an optimisation, presumably due to high symmetry modes optimising most quickly though here it has been possible for NH3 to break symmetry, albeit via a manual option of ignoring symmetry. This means that when optimising a high symmetry structure it will generally retain a high symmetry structure which is not necessarily the lowest energy structure.
This has been demonstrated by the fact that the C1 is in fact lower in energy than the C3V structure and so is in theory more stable by what is approximately 0.00000172 Hartree. This lowest energy geometry is 0.00034573 Hartree lower than the D3H. When converting this energy to kJ mol-1 we arrive at a value of 0.908 which can be approximated to 1kJ mol-1, this is the energy barrier of inversion. This energy is clearly lower than standard conditions where RT = 2.48kJ mol-1 and leads us to arrive at the prediction that ammonia undergoes ready inversion at room temperature.
It was now clear that in order to take these conclusions further it would be necessary to perform higher accuracy calculations. As such the MP2 method was employed along with the 6-311+G(d,p) basis set. MP2 methods are named as such as they are based on Møller-Plesset perturbation theory, the 2 in this case denoting the fact that these are second order. The idea behind this is that Hartree Fock methods are taken and improved by the consideration of electron correlation effects. The 6-311+G(d,p) is a further advanced version of the previous Pople type basis sets. In this case we have used a quadruple basis set and chosen to include functions to describe both the polarization and diffuse nature of the orbitals.
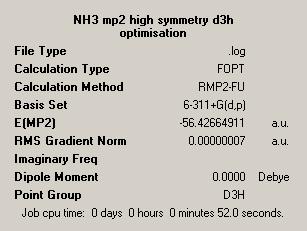
These calculations were run for both the C3V and D3H structures described. The results are given in the below table:
| Symmetry Study of NH3 | |||
| NH3 MP2 Optimisation | Dummy Atom NH3 MP2 Optimisation | ||

|
| ||
| Symmetry = C3V | Symmetry = D3H | ||
From the outset it is clear that these higher level calculations take significantly longer than the lower level calculations. This is due to the increased time required to carry out the calculations to the higher accuracy level of these calculations.
It is possible again to calculate the energy difference, and so the barrier to inversion. This is given as 0.007796 Hartree which corresponds to 20.5kJ mol-1. This is much higher than the previous value generated using the B3LYP method. The reason for this is based in the two different calculation methods and the way they compute the energy of the molecule. The MP2 method takes into account much more the electronic distribution around the molecule as well as the effect of electronic correlation in the structure.
The extra computational time is however deemed worthwhile in the extreme when we compare the computational results with those generated in the experimental literature. The experimentally calculated value is 24.3kJ mol-1 and so the value of 20.5kJ mol-1 falls short by a value of 3.8kJ mol-1, which is less than 16% of the total value and so we can see that this value is far more accurate than the original value calculated from B3LYP. In addition to these effects we have also used a more advanced basis set which has helped us to reach a more accurate value.
In theory we could employ even further advanced techniques to ensure that we get even closer to this experimental value. However there is of course a fine balance between the computational time and cost in performing a calculation and the accuracy when compared to a literature value. In this case we have managed to get to a good approximation of a value in little over a minute which is very useful. Higher computations will of course take much longer and so whether these are worthwhile would need to be considered on a case by case basis.
Notably, in both the computational result and the experimental studies we see a very high energy barrier to inversion. This suggests that inversion is very unfavourable due to this high energy transition state. This makes no sense as we know from experience that inversion of ammonia is a ready process even at room temperature.
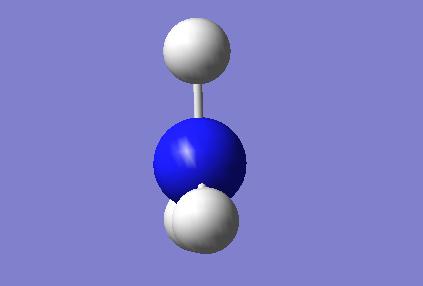
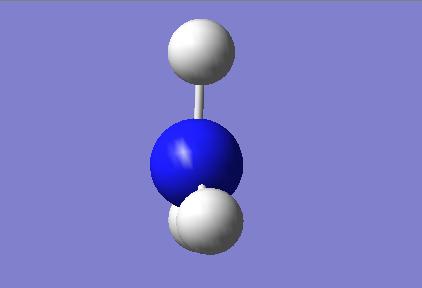
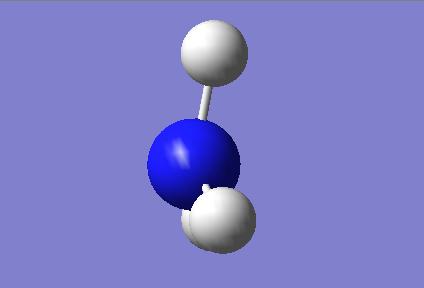
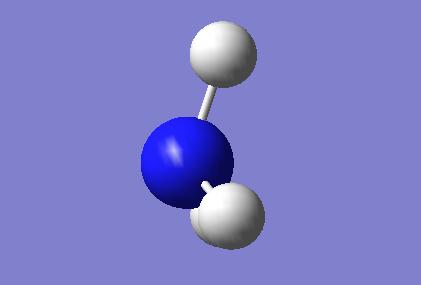
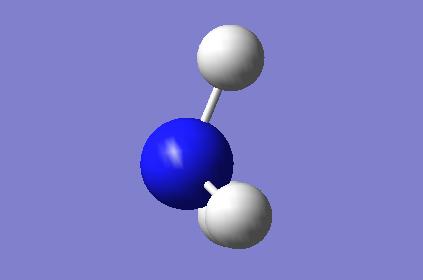
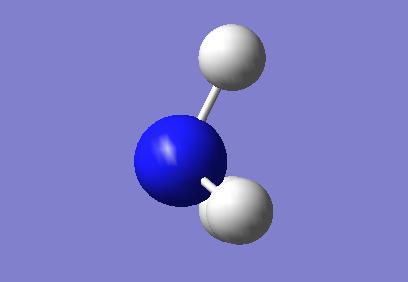
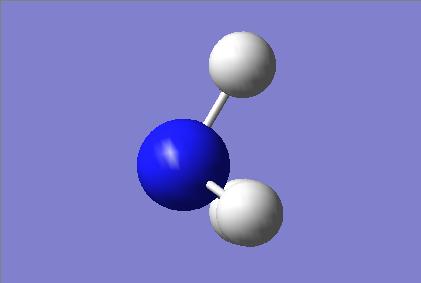
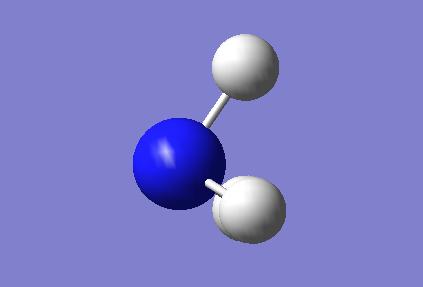
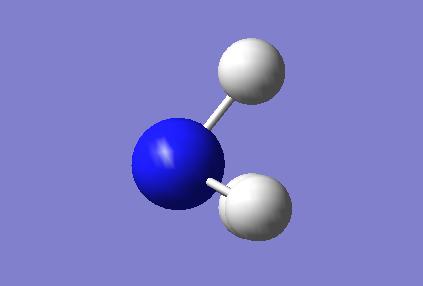
It was possible model the inversion of ammonia using Gaussian. This allowed us to model the movement of the molecule from the ground state structure to the transition state and so model the inversion mechanism. This is shown pictorially in the below table:
| Model Of Inversion Mechanism | |||
|
| ||

|
| ||
|
| ||
|
| ||
|
| ||
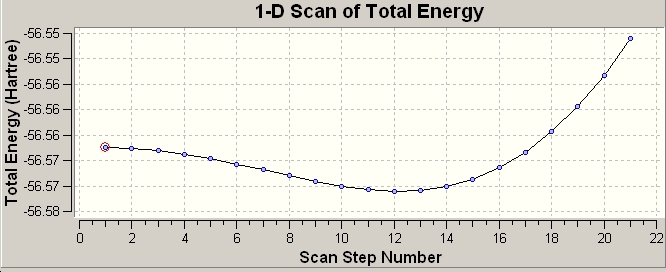 | |||
Though we can now see pictorially and graphically how this inversion takes place we are still no closer to understanding how and why it can occur.
We see a minima in energy at step 12 in the mechanism, this is the C3V umbrella type structure.
An answer to this question is not difficult to find when one searches in the literature. An answer is quick to be found in the shape of quantum mechanical tunnelling, a phenomena which is very important.
This is where the line between classical and quantum mechanics becomes clear, in this quantum mechanics explains why a classically forbidden process is actually observed.
Quantum tunneling describes the ability of a particle to escape from a potential energy well[5]. This means that while in classical mechanics a particle would be forbidden from overcoming an energy barrier and so remain at the minimum of the energy well, this is not the case in quantum processes. In quantum tunnelling a particle can effectively tunnel through a barrier and emerge on the other side with the same energy.
This process has a number of implications and can be used to describe a number of key processes, for example alpha emission in decay of a nucleus. As such in Ammonia quantum mechanical tunneling[6] explains why ready inversion can indeed occur. This is because the molecule never actually has to overcome the energy barrier as it can tunnel from one structure to the other, as such it leaves the idea of symmetry behind as it moves from one structure to the other with no need to overcome the huge potential energy barrier. As such this is why we can see ready inversion of ammonia. This is shown diagrammatically below[7]:

Here we a very simplified diagram describing how quantum mechanical tunnelling allows the particle to move through an energy barrier as opposed to over it.
Vibrational Spectra
In order to further study the two structures we could model their vibrational spectra. GaussView was again the vital tool used to take our analysis to the next level and model the vibrations of the structure. This was done as before by choosing the frequency option in GaussView and using Gaussian to perform the calculation. The result is the below tabulated results.
Firstly for the C3V ground state structure:
Secondly for the D3H transition state.
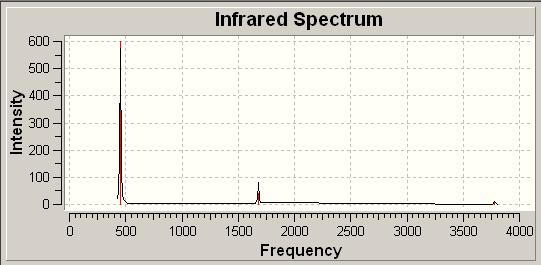
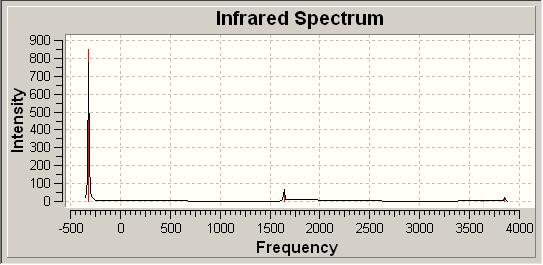
As before the IR spectra could be generated to allow direct comparison between the overall spectra in each case. The two spectra are tabulated below.
| Tabulated IR Spectra | |||
| C3V IR Spectrum | |||
| |||
| D3H IR Spectrum | |||
| |||
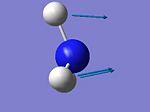
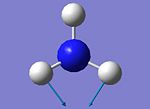
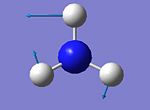
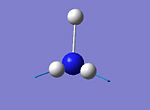
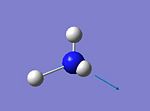
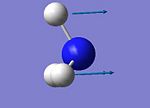
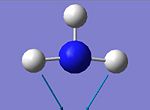
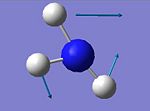
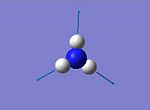
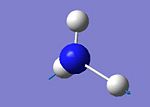
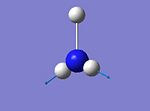
In comparing the two sets of vibrations we can gain a large amount of information. Firstly each of the two structures have 6 identical vibrational modes. These include a wagging vibration, 2 scissoring actions, a symmetric stretch and 2 asymmetric stretches.
The two spectra differ however in the positions of these vibrations. As such the C3V has 6 positive frequencies, where as the D3H structure has 5 positive vibrations and 1 negative vibration. From this the idea that the C3V structure is the ground state structure makes sense as this has all positive vibrations, a neccessity for a ground state structure.
Additionally the D3H structure can be seen as the transition state due to it having one negative vibration, indicative of a transition state. This negative vibration is given for the wagging of the molecule at -318cm-1. The fact this is negative suggests it requires negative energy for this to occur, as such it could be inferred that we would have to remove energy from the system to stop it from wagging like so. By wagging the molecule returns to the C3V ground state and so this in some senses agrees with what we expect to see.
The wagging vibrations are the vibrations which follow the inversion mechanism and allow the molecule to move to the transition state and back down to the group state.
We can finally compare the IR results calculated to those in the literature. This is given below:
| IR Comparison with Literature[8] | ||||
| Literature Comparison/cm-1 | Computational/cm-1 | |||
| 1139 | 452 | |||
| 1765 | 1681 | |||
| 1765 | 1681 | |||
| 3534 | 3575 | |||
| 3464 | 3776 | |||
| 3464 | 3776 | |||
The literature values are shown to match fairly well with the computational values. We see the biggest difference at the lowest frequency, the wagging of the molecule. As established above this is in fact the mode related to the inversion of the molecule and is subject to quantum effects. These are not included in our model and so we can understand the large difference.
To summarise what we have established from our work on ammonia we look back on what we set out to study, which was the inversion mechanism of ammonia. We have studied this and found this to be a complicated phenomena which is classically forbidden and requires quantum effects to occur. We have seen the effect, and the need, for more advanced techniques by the much better fit to literature data by the more advanced approach of MP2 calculations compared to DFT methods.
With regard to the mechanism we wanted to study we have been able to confirm, by calculations and frequency analysis, the ground state and transition state of the molecule. We have studied the energy of the molecule and found the lowest energy state and in doing so understood the importance of symmetry in calculations.
From this we now move on to study more advanced systems!
Part II - Mini Project
This is given on an additional webpage due to the size of this page exceeding a sensible limit, hence the mini project can be found on the following link [2]
Mja06 13:40, 18 February 2009 (UTC)
References
- ↑ Observation of the gas-phase infrared spectrum of BH3 Kentarou Kawaguchi, J. E. Butler, Chikashi Yamada, S. H. Bauer, Tatsuya Minowa, Hideto Kanamori, and Eizi Hirota, J. Chem. Phys. 87, 2438 (1987), DOI:10.1063/1.453135
- ↑ G. Hogarth, T. Norman, Inorganica Chiraica Acta, 254, 1997, 167-171DOI:10.1016/S0020-1693(96)05133-X
- ↑ G. Hogarth, T. Norman, Inorganica Chiraica Acta, 254, 1997, 167-171DOI:10.1016/S0020-1693(96)05133-X
- ↑ F. Albert Cotton, Donald J. Darensbourg et al, Inorg. Chem., 21, 1982, p2661-2666DOI:10.1021/ic00137a026
- ↑ Encylopedia Britannica, Quantum Mechanics [[1]]
- ↑ R. Ikeda, C.A. McDowell, Molecular Physics, 1973, 25, 5, 1217-1229DOI:10.1080/00268977300101051
- ↑ http://en.wikipedia.org/wiki/File:QuantumTunnel.jpg
- ↑ http://www.chem.purdue.edu/gchelp/vibs/nh3.html


