Rep:Mod:THaywood/module two
Module 2
Set tasks
Optimization
BH3 Optimization
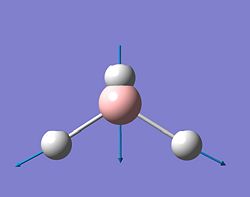
A planar BH3 molecule was created in Gausview, the bond lengths BH bond lengths were 1.18A and have a H-B-H bond angle of 120o. The bond lengths were then adjusted to 1.5A, the geometry was then optimised.
The BH bond lengths were then 1.19435A and the H-B-H bond angle was 120oafter optimisation.
| BH3 optimisation | ||
| File Name | TOM1_BH3_OPT | |
| File Type | .log | |
| Calculation Type | FOPT | |
| Calculation Method | RB3LYP | |
| Basis Set | 3-21G | |
| Charge | 0 | |
| Spin | Singlet | |
| E(RB3LYP) | -26.46226338 | a.u. |
| RMS Gradient Norm | 0.00020672 | a.u. |
| Imaginary Freq | ||
| Dipole Moment | 0.0000 | Debye |
| Point Group | D3H |
https://www.ch.imperial.ac.uk/wiki/images/3/32/TOM_BH3_MO.LOG
BCl3 Optimization
BH3 is a simple molecule so only requires a simple basis set in order to give a fairly more accurate geometry, more complex molecules i.e. containing more electrons, require a more advanced basis set.
This time a BCl3 molecule and the geometry optimised. However a (LANL2MB) basis set used instead of a (3-21G) basis set as used for the BH3.
| BCl3 optimisation | ||
| File Name | tom_bcl_opt | |
| File Type | .chk | |
| Calculation Type | FOPT | |
| Calculation Method | RB3LYP | |
| Basis Set | LANL2MB | |
| Charge | 0 | |
| Spin | Singlet | |
| Total Energy | -69.43928112 | a.u. |
| RMS Gradient Norm | 0.00005905 | a.u. |
| Imaginary Freq | ||
| Dipole Moment | 0 | Debye |
| Point Group | ||
BH3 MO's
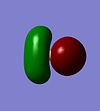
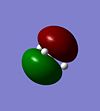
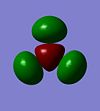
A further calculation was run predicting the location and geometry of the molecular orbitals of the BH3 molecule. These can be viewed and rotated, below are immages of the first 8 Molecular orbitals of BH3 .
 |
 |
 |
 |
 |
 |
 |
 |
NBO analysis of BH3
An NBO calculatio of BH3 was carried out which shows the respective charge on each atom of the molecule, this can be viewed in a number of different forms from colour to numerical.
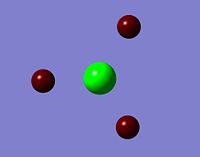 |
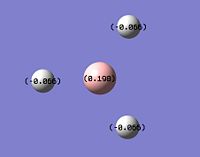 |
Vibrations
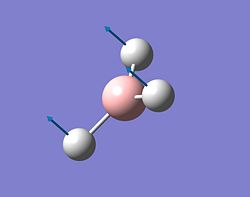
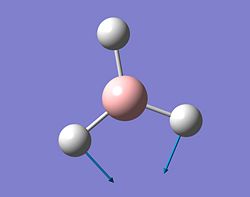
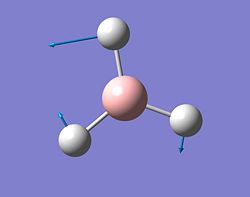
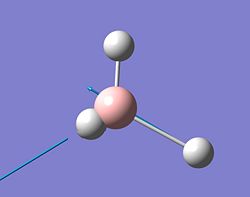
Next a frequency calculation was run to investigate the vibrations of BH3
| BH3 frequency | ' | ' |
| File Name | TH_bh3_freq | |
| File Type | .chk | |
| Calculation Type | FREQ | |
| Calculation Method | RB3LYP | |
| Basis Set | 3-21G | |
| Charge | 0 | |
| Spin | Singlet | |
| Total Energy | -26.46226338 | a.u. |
| RMS Gradient Norm | 0.00020662 | a.u. |
| Imaginary Freq | ||
| Dipole Moment | 0 | Debye |
| Point Group | ||
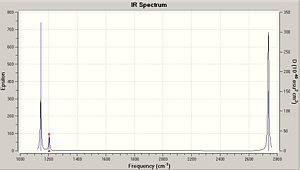
The table shows that there are 6 clear vibrations, however the IR spectrum indicates just 3. This is due to a couple of reasons. Firstly vibration No. 4 has no change in dipole moment, in order for a vibration to be seen on an IR spectra then there must be some change in the dipolemoment of the molecule. The other 2 missing peaks are due to degeneracy. Vibrations 2 and 3 have almost identical energy levels of 12.3 so merge into one peak. Also vibrations 5 and 6 are degenarate at 103.7 merging into one peak.
Optimization of BCl3
A planar BCl3 molecule was created in Gausview and the geometry optimised.
Frequency analysis was carried out in order to check that the BCl3 was infact at the minimum energy and not at a maxima.
The BCl bond lengths were 1.86592A and the ClBCl bond angle was 120oafter optimisation. The literature values for the bond length and bond angle are 1.742A[1] and 120o.
| BCl3 optimisation | ||
| File Name | tom_bcl_opt | |
| File Type | .chk | |
| Calculation Type | FOPT | |
| Calculation Method | RB3LYP | |
| Basis Set | LANL2MB | |
| Charge | 0 | |
| Spin | Singlet | |
| Total Energy | -69.43928112 | a.u. |
| RMS Gradient Norm | 0.00005905 | a.u. |
| Imaginary Freq | ||
| Dipole Moment | 0 | Debye |
| Point Group | ||
| BCl3 Frequency | ' | ' |
| File Name | TOM_BCL33_OPT | |
| File Type | .log | |
| Calculation Type | FOPT | |
| Calculation Method | RB3LYP | |
| Basis Set | LANL2MB | |
| Charge | 0 | |
| Spin | Singlet | |
| E(RB3LYP) | -69.43928112 | a.u. |
| RMS Gradient Norm | 0.00005905 | a.u. |
| Imaginary Freq | 0 | |
| Dipole Moment | 0 | Debye |
| Point Group | D3H | |
The basis set is the number of functions that are used in the calculation, if this is changed for different calculations then the acuracy and therefore results would differ giving incorect answeres.
The frequency analysis is essentially the second derivative of the potential energy surface, if the frequencies are all positive then we have a minimum, if one of them is negative we have a transition state which coresponds to a local maximum, therfore not an energy minimum which we are looking for.
Gaussview draws bonds based on a distance critera, so the fact that gaussview hasn't drawn bonds doesn't mean they are not there. Just that the distance exceeds some pre-defined value. Bonds in gausview are a structural convenience.
A chemical bond is an interaction between two (or more) atoms in a molecue, it represents an area of bonding orbital overlap and increased electron dencity.
You would expect the symetry point group of the ground state to be D3h, this is the point group which gaussian uses.
Calculation of the optimisation of the sturcture took 8.0seconds and the frequency calculation took 9.0 seconds.
The MO diagram of BH3

| Orbital | MO | LCOA |
|---|---|---|
| MO 1 |  |
 |
| MO 2 |  |
 |
| MO 3 degenerate, HOMO |  |
 |
| MO 4 degenerate, HOMO |  |
 |
| MO 5 LUMO |  |
 |
| MO 6 |  |
 |
| MO 7 degenerate |  |
 |
| MO 8 degenerate |  |
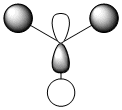 |
All of the calculated MO's and LCAO's have a fairly good correlation with no major differences, this shows that qualitative MO theory is very useful for predicting the orbitals of simple molecules at least.
CIS - TRANS
|
|
Trans DOI:10042/to-2628
Cis DOI:10042/to-2629
Trans Freq
DOI:10042/to-2630
Cis Freq DOI:10042/to-2631
The energy of the trans isomer is -1637198.994 kJmol-1. Compared to the energy of the cis isomer at -1637201.727 kJmol-1. These energies are remarkably close in energy with an energy difference of just 2.733 kJmol-1. Despite the energy difference being very small the cis isomer has a slightly lower energy than the trans isomer which means that it is more stable. If however the Cl atoms were replaced with phenyl groups then the trans isomer would be segnificantly more stable. This is because the phenyl groups are much more bulky so would have alot more steric clash in the cis form. It is likely that the trans isomer is slightly higher in energy becaus the Chlorines are elipsed. If one group was rotated by 60o then a lower energy geometry my be found.
The geometry of the trans isomer is interesting that the P-Mo-P bond angle is not quite 180o but 177o, this is due to the eclipsed nature of the Cl groups.
There is a similar situation in the cis isomer, the P-Mo-P angle is not quite the expected 90o but infact 94o, this is due to the repulsion between the Chlorines.
| Bond | Cis | Trans | Lit[2][3] |
|---|---|---|---|
| Mo-CO | 2.06 | 2.06 | 2.109 |
| Mo-P | 2.51 | 2.44 | 2.50 |
| P-Cl | 2.24 | 2.24 | 2.039 |
| C=O | 1.18 | 1.17 | 1.21 |
The literature bond lengths vary slightly from the calculated values which is to be expected, this is because the literature values are taken from different complexes and compounds to what has been computed. It is interesting to see the difference in bond lengths for the Mo-P between the two isomers. The shorter bond lenght of the trans is likely to be due to less steric clash of the PCl3 groups.
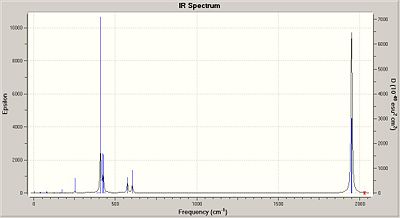 |
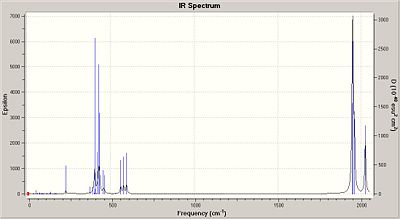 |
None of the IR values have a negative frequency which confirms that the structures are indeed at their minimized conformations. Some values however are very low, for trans these are both variations on the rotation of the Mo-P bond.
 |
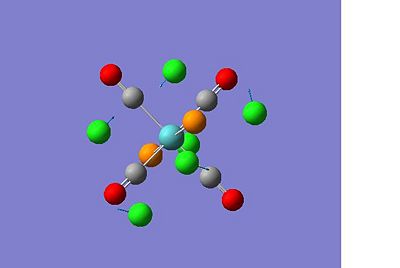 |
The low frequency values of the cis isomer is also a Mo-P rotation, the energies however are slightly higher due to the steric clash between the 2 Cl atoms on the two groups.
 |
As these values are at low frequency it means that very little energy is required, therfore at room temperature there is likely to be an excess of energy for them. Also as they are rotation the PCl3 group will be contiuously spinning on the Mo-P bond axis at room temperature.
Mini Project
In this mini project, the energies of different isomers of Me4Al2Cl2 compounds are calculated. Most importantly looking at the bridging group between the two Al atoms and the affect this has on the stability of the molecule.
Me4Al2Cl2 Bridging Cl
|
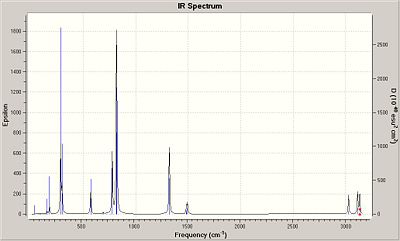 |
 |
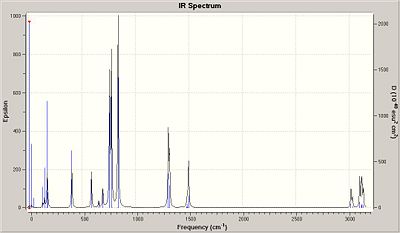
Here is a list of the key frequencies which involve vibrations of the bridging bonds between the Al and Cl given in cm-1. 28.54, 133.74, 175.87, 203.39, 203.86, 281.61, 297.35.
297.35 is the highest energy bridging vibration in the molecule suggesting that this is the highest energy vibration of an Al-Cl bond.
| Bond | Angle |
|---|---|
| Al-Cl-Al | 94.72 |
| Cl-Al-Cl | 85.28 |
| C-Al-C | 132.48 |
| C-Al-Cl | 107.24 |
The difference in the bond angles aroud the Al is dut to the repulsion of the two methyl groups attached, these force the other bonds closer together.
| Bond | Length |
|---|---|
| Al-Cl | 2.48 |
| Al-C | 1.96 |
The difference in bond length between the two is due to the electron dencity in the bonds, as Cl is bridging the elctron cloud is much more diffuse so the bonds are longer.
NBO analysis
    1. (1.96885) BD ( 1)Al   1 -Cl   3
               (  8.90%)   0.2984*Al   1 s( 13.93%)p 6.18( 86.07%)
                                           0.3717 -0.0345 -0.6004  0.0133 -0.0001
                                           0.0000 -0.7071 -0.0068
               ( 91.10%)   0.9544*Cl   3 s( 24.39%)p 3.10( 75.61%)
                                           0.4938  0.0016  0.7071 -0.0018  0.0001
                                           0.0000  0.5061 -0.0011
    2. (1.96886) BD ( 1)Al   1 -Cl   4
               (  8.91%)   0.2984*Al   1 s( 13.93%)p 6.18( 86.07%)
                                           0.3717 -0.0345 -0.6004  0.0133  0.0001
                                           0.0000  0.7071  0.0068
               ( 91.09%)   0.9544*Cl   4 s( 24.39%)p 3.10( 75.61%)
                                           0.4938  0.0016  0.7071 -0.0017 -0.0001
                                           0.0000 -0.5061  0.0011
    5. (1.96886) BD ( 1)Al   2 -Cl   3
               (  8.91%)   0.2984*Al   2 s( 13.93%)p 6.18( 86.07%)
                                          -0.3717  0.0345 -0.6004  0.0133  0.0002
                                           0.0000  0.7071  0.0068
               ( 91.09%)   0.9544*Cl   3 s( 24.39%)p 3.10( 75.61%)
                                          -0.4938 -0.0016  0.7071 -0.0017 -0.0001
                                           0.0000 -0.5061  0.0011
    6. (1.96885) BD ( 1)Al   2 -Cl   4
               (  8.91%)   0.2984*Al   2 s( 13.93%)p 6.18( 86.07%)
                                          -0.3717  0.0345 -0.6004  0.0133 -0.0001
                                           0.0000 -0.7071 -0.0068
               ( 91.09%)   0.9544*Cl   4 s( 24.39%)p 3.10( 75.61%)
                                          -0.4938 -0.0016  0.7071 -0.0018  0.0001
                                           0.0000  0.5061 -0.0011
These show the the bonding contributions from the Al and Cl, the figures show that 91.09% of the orbital contribution is from the Cl. Most importanly however is that there is an equal distribution from the Cl's to both aluminums.
Total energy: -508640.36890677 kJmol-1
The links below give details of the calculations run, Optimisation, Frequency and MO:
Opt: DOI:10042/to-2756
Freq: DOI:10042/to-2755
MO: DOI:10042/to-2753
Me4Al2Cl2 Bridging Me
|
 |
 |
Here is a list of the key frequencies which involve vibrations of the bridging bonds between the Al and Cl given in cm-1.
21.48, 48.03, 72.55, 175.41, 180.30, 587.68, 588.82, 695.02.
All of these frequencies are bridging Al-C vibrations.
297.35 is the highest energy bridging vibration in the molecule suggesting that this is the highest energy vibration of an Al-Cl bond.
tC=terminal carbon bC=bridging carbon
| Bond | Angle |
|---|---|
| Al-bC-Al | 99.25 |
| bC-Al-bC bridging | 80.75 |
| tC-Al-bC terminal | 129.48 |
| tC-Al-Cl | 116.07 |
| bC-Al-Cl | 114.34 |
| Bond | Length |
|---|---|
| Al-Cl | 2.24 |
| Al-tC | 1.96 |
| Al-b1C | 1.97 |
| Al-b2C | 3.50 |
The key point to notice here is that the bond lengths between the Al and the two bridging carbons is very different, this is because during calculation Gaussian has not fully delocalised the electrons in the bonds. This can be seen from the very simmilar bond lengths of the aliminum to bridging carbon and aluminum to terminal carbon.
NBO analysis
    3. (1.96427) BD ( 1)Al   1 - C  17
               ( 17.83%)   0.4222*Al   1 s( 37.80%)p 1.65( 62.20%)
                                          -0.6148 -0.0009 -0.5714 -0.0236  0.1696
                                           0.0162 -0.5143 -0.0370
               ( 82.17%)   0.9065* C  17 s( 26.48%)p 2.78( 73.52%)
                                          -0.0001 -0.5136  0.0319  0.5843  0.0222
                                          -0.1848 -0.0096  0.5984  0.0324
    6. (1.96427) BD ( 1)Al   2 - C  13
               ( 17.83%)   0.4222*Al   2 s( 37.80%)p 1.65( 62.20%)
                                           0.6148  0.0009 -0.5714 -0.0236  0.1694
                                           0.0162 -0.5143 -0.0370
               ( 82.17%)   0.9065* C  13 s( 26.48%)p 2.78( 73.52%)
                                           0.0001  0.5136 -0.0319  0.5844  0.0222
                                          -0.1845 -0.0096  0.5984  0.0324
    23. (0.11572) LP*( 1)Al   1           s(  0.00%)p 1.00(100.00%)
                                          -0.0021  0.0042 -0.6265  0.0644  0.1690
                                          -0.0152  0.7553 -0.0635
    24. (0.11571) LP*( 1)Al   2           s(  0.00%)p 1.00(100.00%)
                                          -0.0021  0.0042  0.6265 -0.0644 -0.1688
                                           0.0151 -0.7553  0.0635
Items 3 and 6 show the bonding interaction between each Al and C. It can clearly be seen that the geometry calculated is not symetrical and that some AL-C bonds are longer than the others. It is not to say however that there is no bonding interaction between the further spaced Al and C. Items 23 and 24 show that there is infact an important interaction. The values of 0.11527 and 0.11527 show that there is some delocalisation of the lone pair of the Aluminum towards the bridging methyl group. If there was no delocalisation then the value would be 0. This delocalisation therefore shows some bonding.
Total Energy: -508536.12848855 kJmol-1
Opt: DOI:10042/to-2766
Freq: DOI:10042/to-2769
MO: DOI:10042/to-2771
Me4Al2Cl2 Mixed Bridging
|
 |
 |
Here is a list of the key frequencies which involve vibrations of the bridging bonds between both the Al-Cl and Al-C given in cm-1.
32.99, 139.44, 161.32, 183.88, 238.14, 294.41, 332.26, 515.67
The frequency 294.41 is is very closer to 297.35 which is the highest bridging frequency in the Cl bridging molecule, this would suggest that the higher frequencies are due to vibrations of Al-C.
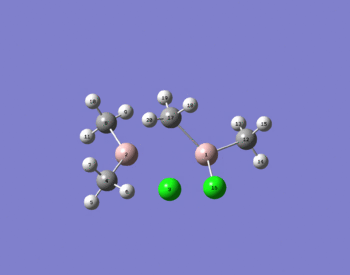
To make the nomenclature easier atom numbers are quoted from the immage right rather than symbols.
| Bond | Angle |
|---|---|
| 1-17-2 | 88.0 |
| 17-1-3 | 98.59 |
| 17-2-3 | 90.92 |
| 1-3-2 | 79.65 |
| 4-2-8 | 132.87 |
| 12-1-16 | 119.49 |
| 16-1-17 | 106.47 |
| 16-1-3 | 105.22 |
| 12-1-17 | 117.20 |
| 12-1-3 | 107.19 |
| 8-2-17 | 100.49 |
| 8-2-3 | 109.10 |
| 4-2-17 | 106.26 |
| 4-2-3 | 108.49 |
| Bond | Length |
|---|---|
| 1-3 | 2.48 |
| 1-17 | 2.06 |
| 1-12 | 1.96 |
| 1-16 | 2.24 |
| 2-3 | 2.41 |
| 2-17 | 2.43 |
| 2-4 | 1.96 |
| 2-8 | 1.96 |
It can be seen that the bridging bonds are not totaly equal however they are much closer in length than the above molecule, this is due to delocalisation of the Cl having an inductive affect on the delocalisation of the carbon.
NBO analysis
   1. (1.96038) BD ( 1)Al   1 -Cl   3
               (  9.00%)   0.3000*Al   1 s( 13.11%)p 6.63( 86.89%)
                                           0.3595 -0.0431 -0.4615 -0.0055 -0.0531
                                          -0.0077  0.8075  0.0302
               ( 91.00%)   0.9539*Cl   3 s( 20.75%)p 3.82( 79.25%)
                                           0.4555  0.0019  0.7110 -0.0016  0.0090
                                          -0.0004 -0.5356  0.0024
   4. (1.88731) BD ( 1)Al   1 - C  17
               ( 13.80%)   0.3715*Al   1 s( 26.54%)p 2.77( 73.46%)
                                           0.5149  0.0178 -0.6237 -0.0145  0.1094
                                           0.0048 -0.5763 -0.0346
               ( 86.20%)   0.9284* C  17 s( 33.23%)p 2.01( 66.77%)
                                           0.0003  0.5755 -0.0330  0.2569 -0.0105
                                          -0.0115 -0.0036  0.7736  0.0548
   5. (1.96753) BD ( 1)Al   2 -Cl   3
               (  9.96%)   0.3156*Al   2 s( 17.93%)p 4.58( 82.07%)
                                          -0.4217  0.0383 -0.5004 -0.0060  0.3013
                                           0.0087 -0.6922 -0.0165
               ( 90.04%)   0.9489*Cl   3 s( 22.47%)p 3.45( 77.53%)
                                          -0.4741 -0.0023  0.6762 -0.0001 -0.2795
                                           0.0002  0.4898 -0.0003
   24. (0.12911) LP*( 1)Al   2           s(  2.01%)p48.86( 97.99%)
                                           0.1405  0.0180  0.7184 -0.0480 -0.1397
                                           0.0156 -0.6645  0.0155
The NBOs above show the bonding interactions between the aluminums and bridging atoms. There is a slightly greater contribution to the carbon over the chlorine from the aluminum. Item 24 shows the delocalisation of its lone pair as discussed above.
Total Energy:-508565.21391104 kJmol-1
The links below give details of the calculations run, Optimisation, Frequency and MO:
Opt: DOI:10042/to-2776
Freq: DOI:10042/to-2774
MO: DOI:10042/to-2772
Ananysis
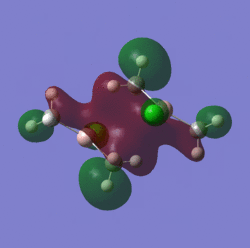
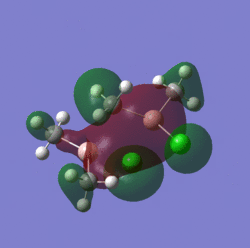
The MO immages chosen above are the particular MO's which are involved with the bridging bonding between the two orbitals, they show an area of delocalised electrons around the bridging and Aluminum atoms, indicating a bonding interaction in all examples. This is more acurately confirmed by inspecting the interactions using NBO analysis.
| Isomer | Total energy kJmol-1 | Energy difference kJmol-1 |
|---|---|---|
| Cl Bridging | -508640.37 | 0 |
| C Bridging | -508536.13 | 104.24 |
| Both bridging | -508565.21 | 75.16 |
The difference in energy shows that the most stable isomer is that with two bridging chlorine atoms, the next most stable is the molecule with one chlorine atom and one carbon atom bridging, with a difference of 75.16 kJmol-1. The molecule with two bridging carbon atoms is the least stable out of the 3 with an energy of 104.24kJmol-1. Both of these energies are reasonably large and are roughly equivelint to between 1/4 and 1/3 of a standard energy of a single covalent bond respectively.
It is not unexpected to find that the molecule with the chlorine bridging gives more stability, this can be understood by thinking about the electronegativity of Cl and its ability to sustain electron density. The carbon however does not sustain a charge so well, it does not like to be coordinated to more than 4 atoms.
Sterics also play a big part in the stability, the carbons have 3 methyls attached which, these clash with the orbitals on the aluminunm as well as the chlorine creating destabilisation.
By loking at the vibrations the relative bond energies can be compared, ideally the frequancys should be fairly high (suggesting a strong bond) but also all of the bridging bonds should have simmilar energies (suggesting good delocalisation).
Looking at the bridging Cl molecule which is shown to be the most stable, the highest frequancy is 297.35cm-1. The C bridging molecule has much higher frequencies which show strong bonds, these however are not even for all of the bridging bonds. So some Al-C bonds are stronger than others, which as mentioned above can be seen from the bond lengths. The molecule with both bridging atoms is unsuprisingly a mixture batween the two, it shares a number of simmilar frequencies with the Cl bridging. It also has some higher frequancies as seen in the C bridging molecule however the frequencies are fairly different, this shows that a certian degree of the Al-C bond has become delocalised into the bridging orbital.
References
- ↑ CRC Handbook of Chemistry and Physics, David R. Lide 89th edition
- ↑ CRC Handbook of Chemistry and Physics, David R. Lide 89th edition
- ↑ http://dx.doi.org/10.1016/S0020-1693(96)05133-X

