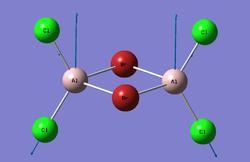
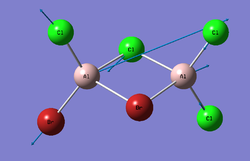
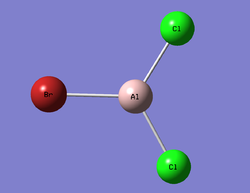
Rep:Mod:TF910
Module 2
Introduction
The aim of this course is to give a preview into the chemical structure and bonding present in molecules. Gaussview 5.0.9 linked to the Gaussian software was used to carry out calculations.
The first week consists of understanding the Gaussview 5.0.9 software and learning how to carry out calculations including optimisation, frequency and MO analysis of various molecules which include BH3, TlBr3 and BBr3. Kinetic and thermodynamic properties of the molecule can then able to be determined.
When a molecule is optimised on Gaussian the nuclei are assumed to be in fixed positions relative to the electrons - this allows the Schrödinger equation to be solved for the nuclei position - this corresponds to the OPT part of the calculation and the optimised molecule is the one with the lowest energy geometry.
Molecule Optimisation
BH3 - B3LYP, 3-21G optimisation
Initially, a minimal basis set (3-21G) was chosen along with a DFT method and B3LYP hybrid functional
File:BH3 OPTIMISATION Faber.LOG
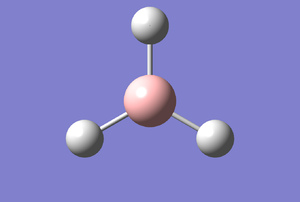 Figure 1: Gaussview Image of optimised BH3
Bond angle: 120°
H-B-H bond distance: 1.19 Å
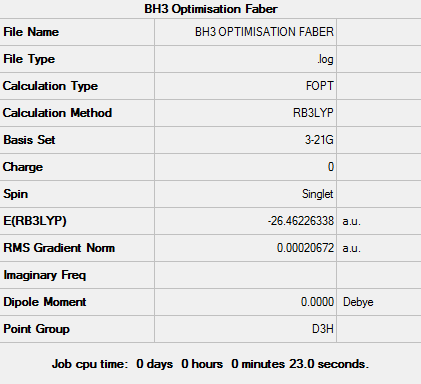 Figure 2: Summary of optimised BH3
     Item                  Value     Threshold  Converged?
Maximum Force            0.000090     0.000450     YES
RMS     Force            0.000059     0.000300     YES
Maximum Displacement     0.000352     0.001800     YES
RMS     Displacement     0.000230     0.001200     YES
The data indicates that the optimisation has been completed successfully this is further backed up by the fact that the RMS Gradient Normal is less than 0.001.
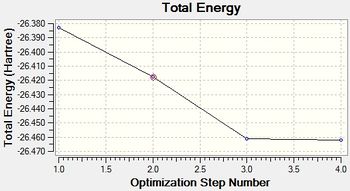
The first graph above has given the energy of the molecule at each step of the optimisation. The second shows the gradient of the energy of the BH3 molecule at each step of the optimisation.
BH3 - B3LYP, 6-31G d,p optimisation
Next a higher level 6-31G(d,p) basis set was used in conjunction with the DFT method and B3LYP hybrid function which was used initially.
File:BH3 OPTIMISATION 6-31G FABER.LOG
 Figure 3: Summary of optimised BH3 using 6-31G minimal basis set
      Item                 Value     Threshold  Converged?
Maximum Force            0.000005     0.000450     YES
RMS     Force            0.000003     0.000300     YES
Maximum Displacement     0.000019     0.001800     YES
RMS     Displacement     0.000012     0.001200     YES
Data indicates that the optimisation has been completed as the value for RMS Gradient Norm is less than 0.001.
Total energy comparison between the minimal basis sets
Total energy for the 3-21G optimised structure = -26.46226338 a.u.
Total energy for the 6-31G(d,p) optimised structure = -26.61532363 a.u.
Bond angle: 120°
H-B-H bond distance: 1.19 Å
TlBr3 - optimisations using pseudo-potentials
The optimisation was run with the addition of a point group restriction on the TlBr3 atom (D3h, 0.001 - very tight) and the basis set LanL2DZ was used with B3LYP hybrid. It was submitted to the HPC server.
The log file for the the TlBr3 optimisation can be seen below:
File:TLBR3 OPTIMISATION FABER.LOG
D-Space - http://hdl.handle.net/10042/23409
 Figure 4: A Gaussview image of optimised TiBr3
Bond angle: 120°
Br-Tl-Br bond length: 2.65 Å
        Item               Value     Threshold  Converged?
Maximum Force            0.000002     0.000450     YES
RMS     Force            0.000001     0.000300     YES
Maximum Displacement     0.000022     0.001800     YES
RMS     Displacement     0.000014     0.001200     YES
The calculated Tl-Br bond length after optimisation is 2.65 Å which compares to the literature for the experimentally obtained value of 2.52 Å [2]. Though there is a fairly good comparison betweeen the two values, the slight discrepancy could have been minimised by using a better basis set. On the whole, however, it is important to get the correct balance between a better optimisation and a more time consuming calculation.
BBr3 Optimisation using a mixture of basis sets and pseudo potentials
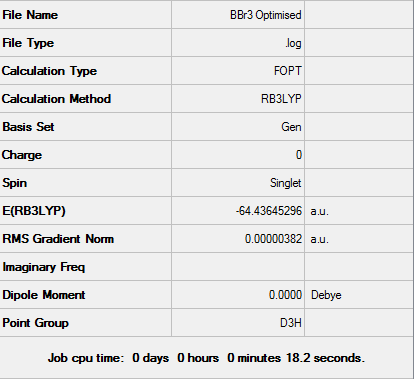
In this calculation both a 6-31G (d,p) basis set, together with a LanL2DZ basis set (B3LYP hybrid functional as before) was employed. The use of both basis sets is to take into account the imbalancein the B-Br bond.
The log file for the BBr3 optimisation can be seen below:
File:BBr3 Optimised log file.txt
D-space - http://hdl.handle.net/10042/23372
 Figure 5: A Gaussview image of optimised BBr3
Bond angle: 120°
Br-B-Br bond length: 1.93 Å
        Item               Value     Threshold  Converged?
Maximum Force            0.000008     0.000450     YES
RMS     Force            0.000005     0.000300     YES
Maximum Displacement     0.000036     0.001800     YES
RMS     Displacement     0.000023     0.001200     YES
The definition of a bond
Gaussview occasionally will not display bonds in structures where one would normally expect to see one. This is due to the fact that Gaussview principally uses bond lengths in organic molecules. For this reason a bond is not drawn when a calculated bond length is longer than usually would be expected - it is distance dependent.
In reality, bonds can be seen as a given interaction in an area of high electron density between two atoms. In an ionic bond the interaction can be defined as an electrostatic force of attraction between oppositely charged ions. Conversely, a covalent bond involves the attraction of molecular orbitals which have suitable symmetry. Practically speaking the true nature of a bond is found, on the whole, in between covalent and ionic with regards to bond character. A bond's strength increases as the two atoms approach each other from an infinite distance, and is not, as can be seen in Gaussview structures, formed at a set distance.
Comparison of bond lengths in BH3, TlBr3 and BBr3
| Bond | Optimised Bond length (Å) | Experimental Bond length (Å) | Basis set |
|---|---|---|---|
| B-H | 1.19 | 1.19 [1] | 6-31G(d,p) |
| Tl-Br | 2.65 | 2.52 [2] | LanL2DZ |
| B-Br | 1.93 | 1.88 [3] | GEN |
If you look at the variations in bond length between the molecules, conclusions can be made as to the role that different ligands as well as different periodicity of the central atom has on the strength of the bond.
In the case of comparing the BH3 and BBr3 molecules the effect of replacing the hydrogen atoms with bromine atoms is that the bond length is considerably increased (from 1.19 Å in BH3 to 1.93 Å in BBr3). Clearly the principal difference between to two ligands is their relative size. Bromine in considerably larger than hydrogen. Being much larger the bromine atom has a diffuse outer electron shell which restricts the efficiency of its electronic interaction with the central boron atom. When considering hydrogen, however, its size is similar to that of the boron atom meaning they can interact more strongly. Another factor which can be considered when comparing the bond lengths is the effect of electronegativity. Bromine is more electronegative than hydrogen meaning that the B-Br bond is more polar than B-H thus distortion of the shared electrons occurs lengthening the bond.
When looking at the differences in the bond length between TlBr3 and BBr3 the Tl-Br bond (2.65 Å) is much longer than the B-Br bond (1.93 Å). Both the thallium and boron are in the same group but thallium lies 4 periods below boron. Since it is a lot larger, thallium has a much poorer overlap with the bromine atoms as its 6p outer shell electrons are more diffuse than those of boron whose outer shell electrons are contained in a 2p orbital much closer to the nucleus. This results in a shorter B-Br bond than Tl-Br.
Frequency Analysis
BH3 vibrational analysis
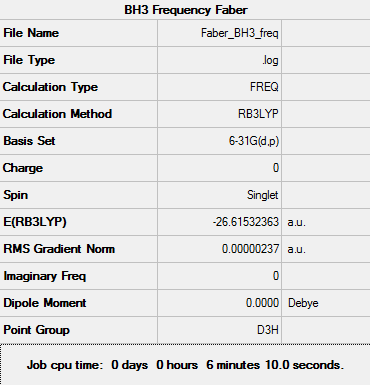
Vibrational analysis was performed using the BH3 structure which had already optimised (DFT, B3LYP, 6-31G (d,p)).
The log file can be seen here: File:FABER BH3 FREQ.LOG
       Item               Value     Threshold  Converged?
Maximum Force            0.000005     0.000450     YES
RMS     Force            0.000002     0.000300     YES
Maximum Displacement     0.000019     0.001800     YES
RMS     Displacement     0.000009     0.001200     YES
Frequency values have been taken from the log output file:
Low frequencies ---   -0.9033   -0.7343   -0.0054    6.7375   12.2491   12.2824
Low frequencies --- 1163.0003 1213.1853 1213.1880
The IR spectrum produced from Gaussview for BH3 can be seen below:
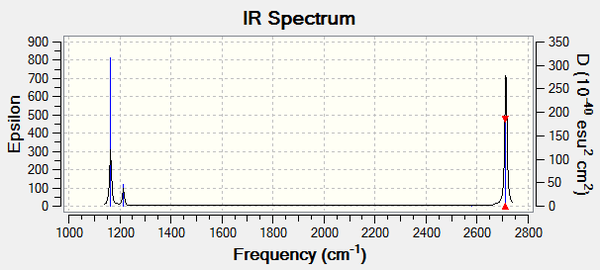 Figure ****: The IR Spectrum of BH3
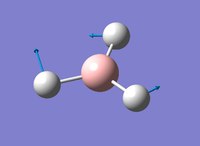
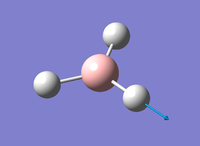
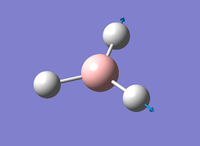
A description of the BH3 vibrations along with their corresponding Gaussview images can be seen in the table below:
Generally the number of vibrational modes is given by 3N-6 where N is the number of atoms in a molecule. So for BH3 with N=4 there are 6 modes expected.
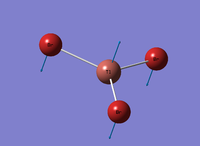
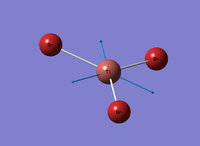
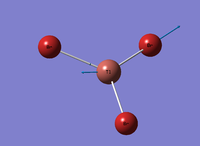
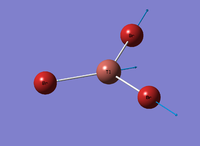
In the spectrum there are only 3 clear peaks although there are 6 vibrational modes. In order for a peak to be visible on an IR spectrum the molecule must have a change in dipole moment. Initially it is clear that because the A'1 stretch is completely symmetric with all the hydrogens moving in and out of the plane in a concerted manner, this stretch is IR inactive. In the A2 vibration there is a clear change in dipole moment and so this vibration is IR active. Of the last 4 vibrations, there are two sets of degenerate pairs and so only 2 peaks are seen contrary to the 4 one would expect. The three vibrations which lead to the peaks in the spectrum are the A'2' (1163 cm-1), E' (1213 cm-1), E' (2715 cm-1).
TlBr3 vibrational analysis
Vibrational analysis was performed using the TlBr3 structure which had already optimised (DFT, B3LYP, 6-31G (d,p)).
The log file can be seen here: File:FABER TLBR3 FREQ.txt
D-space - http://hdl.handle.net/10042/23409
        Item               Value     Threshold  Converged?
Maximum Force            0.000002     0.000450     YES
RMS     Force            0.000001     0.000300     YES
Maximum Displacement     0.000022     0.001800     YES
RMS     Displacement     0.000011     0.001200     YES
Frequency values have been taken from the log output file:
Low frequencies ---   -3.4213   -0.0026   -0.0004    0.0015    3.9367    3.9367
Low frequencies ---   46.4289   46.4292   52.1449
The IR spectrum produced from Gaussview for TlBr3 can be seen below:
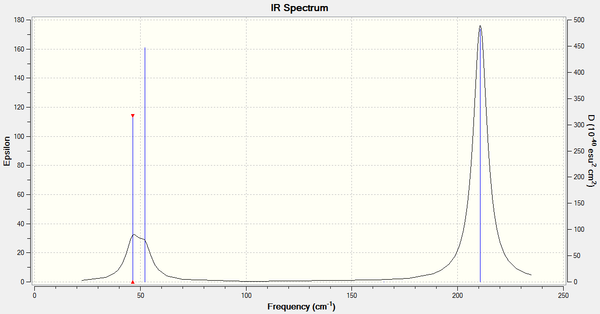 Figure 6: The IR Spectrum of TlBr3
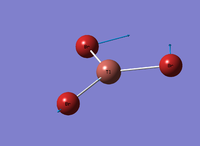
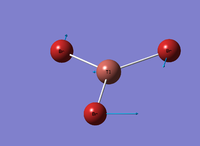
A description of the TlBr3 vibrations along with their corresponding Gaussview images can be seen in the table below:
As in the case of BH3, there are also three peaks in the infrared spectrum of TlBr3. One peak is at 46 cm-1 which is the lowest "real" normal mode. This corresponds to the degenerate vibrational modes of 1 and 2. The peak at 52 cm-1 is from vibrational mode 3 and the peak at 211 cm-1 again from a set of degenerate vibrations 5 and 6. Vibration 4 is totally symmetrical and hence is IR inactive.
Comparison of BH3 and TlBr3 Vibrational Frequencies
A table of the vibrational frequencies of BH3 and TlBr3 can be seen below:
| BH3 frequency (cm-1) | TlBr3 frequency (cm-1) |
|---|---|
| 1163 | 46 |
| 1213 | 46 |
| 1213 | 52 |
| 2582 | 165 |
| 2715 | 211 |
| 2715 | 211 |
When comparing the two molecules, the obvious thing to recognize is that the frequency values of BH3 are much larger than those of TlBr3. The reason for this is that the bond vibration frequency corresponds to the bond strength. For reasons mentioned earlier the B-H bond can be shown to be stronger than the Tl-Br bond. Another approach which can explain the lower frequencies present in TlBr3 is Hooke's Law. This inversely relates vibrational frequency with the reduced mass of the molecule. Since TlBr3 is much heavier it has a higher reduced mass and hence a lower vibrational frquency in comparison to BH3.
The vibrational modes order seen in the two molecules also differs slightly. In BH3 the modes are arranged in the order - A2’, E', E', A1', E', E' whereas for TlBr3 the order is E',E', A2’, A1' E', E'. A clear similarity is that both show 6 vibrational modes which is to be expected as the two molecules both have the same structure. Another interesting comparison is in the two IR spectra which both exhibit three peaks.
For both spectra two pairs of modes lie fairly close together, the A2 and E' modes and also the A1' and E' modes which are energetically higher. This could perhaps be explained by vibronic coupling between vibration modes in both molecules. In order for this to have a significant effect the two coupling vibration modes should share a bond or atom - this is clearly possible in the trigonal planar arrangement.
Throughout the calculations, the same method and basis set for both the optimisation and the frequency analysis was used. This is to ensure that comparisons can be made betweeen the two molecules. By using a different basis set and or method any comparisons made are not valid.
The main purpose of carrying out a frequency analysis is to verify that the structure which has been optimised is at a minimum. It can also be very useful to provide information such as the frequency of vibration and helps in the analysis of vibrational modes and the interpretation of IR spectra in comparable molecules.
The low frequencies represent the "-6" part in the equation for the number of vibrational modes: "3N-6". They are representative of the motions of the centre of mass of the molecule.
Population Analysis
BH3 Molecular Orbitals
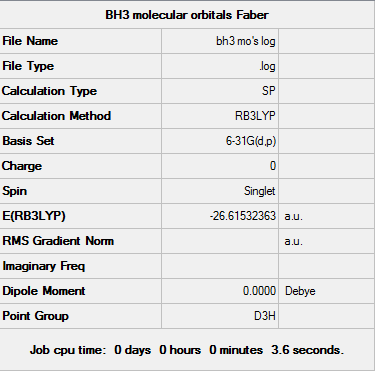
A further energy calculation was run using a previously optimised BH3 structure (DFT, B3LYP, 6-31G (d,p)).
The log file can be seen here: File:Bh3 mo's log.log
D-space - http://hdl.handle.net/10042/23439
The MO diagram constructed using the LCAO method is shown below:
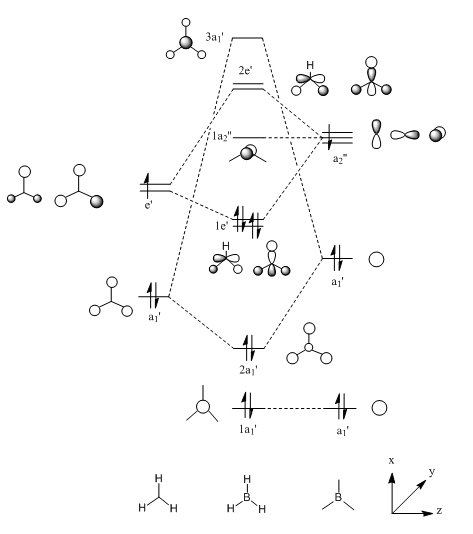
The following table shows the comparison between the LCAO orbitals and the real Gaussview produced molecular orbitals:
| Method | 1 | 2 | 3 | 4 | 5 | 6 | 7 | 8 |
|---|---|---|---|---|---|---|---|---|
| LCAO |  |
 |
 |
 |
 |
 |
 |

|
| Real (Gaussview) |  |
 |
 |
 |
 |
 |
 |

|
| Symmetry Label | a1' | a1' | e' | e' | a2 | a1' | e' | e' |
By comparing the two different sets of molecular orbitals, it is clear to see there is a very close match between the LCAO constructed MOs and the Gaussview calculated MOs. This proves the the Linear Combination of Atomic Orbitals is a valid approach for accurate construction of MOs in relatively small and uncomplicated molecules such as BH3.
NBO Analysis
NH3 Optimisation Practice
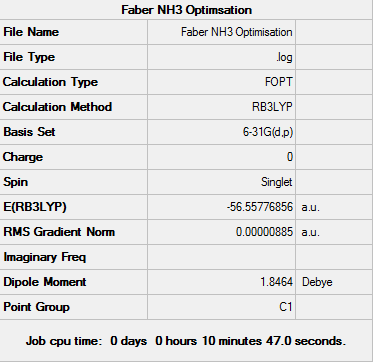
The optimisation of NH3 was carried out in Gaussview using the RB3LYP calculation method and a 6-31G basis set. The "nosymm" keyword was applied.
The log file can be seen here: File:FABER NH3 OPTIMISATION.LOG
        Item               Value     Threshold  Converged?
Maximum Force            0.000024     0.000450     YES
RMS     Force            0.000012     0.000300     YES
Maximum Displacement     0.000079     0.001800     YES
RMS     Displacement     0.000053     0.001200     YES
Frequency Analysis
A further frequency analysis for NH3 was performed using the previously optimised structure (DFT, B3LYP, 6-31G (d,p)).
The log file can be seen here: File:FABER NH3 FREQUENCY.LOG
        Item               Value     Threshold  Converged?
Maximum Force            0.000022     0.000450     YES
RMS     Force            0.000009     0.000300     YES
Maximum Displacement     0.000078     0.001800     YES
RMS     Displacement     0.000039     0.001200     YES
Low frequencies ---  -30.7927   -0.0019   -0.0018   -0.0014   20.2690   28.2324
Low frequencies --- 1089.5544 1694.1237 1694.1863
Population Analysis
An energy calculation was executed using the previously optimised NH3 structure (DFT, B3LYP, 6-31G (d,p)).
The log file can be seen here: File:FABER NH3 POPANALYSIS.LOG
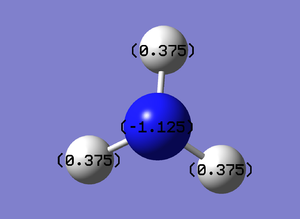
NBO Analysis of NH3
NBO visualisation on Gaussview:

The charge range is between -1.125 and 1.125:

The NBO charges were then shown using Gaussview:
Nitrogen NBO charge: -1.125 Hydrogen NBO charge: +0.375
NH3BH3 Analysis
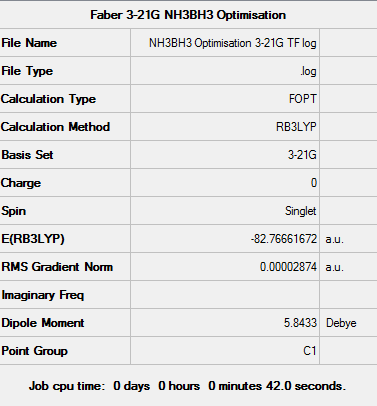
Optimisation using 3-21G basis set
Firstly, the 3-21G minimal basis set was chosen along with a DFT method and B3LYP hybrid functional.
The log file can be seen here: File:NH3BH3 Optimisation 3-21G TF log.txt
D-space - http://hdl.handle.net/10042/23470
        Item               Value     Threshold  Converged?
Maximum Force            0.000082     0.000450     YES
RMS     Force            0.000030     0.000300     YES
Maximum Displacement     0.000585     0.001800     YES
RMS     Displacement     0.000204     0.001200     YES
Optimisation using 6-31G(d,p) basis set
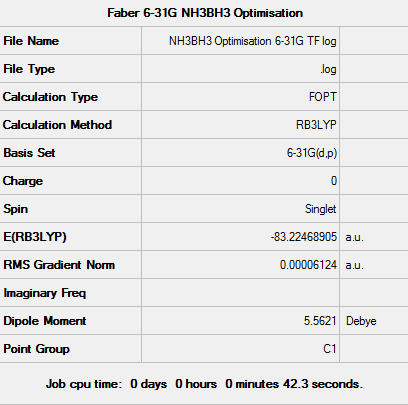
Following the initial optimisation a higher level basis set (6-31G, (d,p)) was chosen along with a DFT method and B3LYP hybrid functional.
The log file can be seen here: File:NH3BH3 Optimisation 6-31G TF log.txt
D-space - http://hdl.handle.net/10042/23474
        Item               Value     Threshold  Converged?
Maximum Force            0.000137     0.000450     YES
RMS     Force            0.000039     0.000300     YES
Maximum Displacement     0.000999     0.001800     YES
RMS     Displacement     0.000216     0.001200     YES
Frequency Analysis
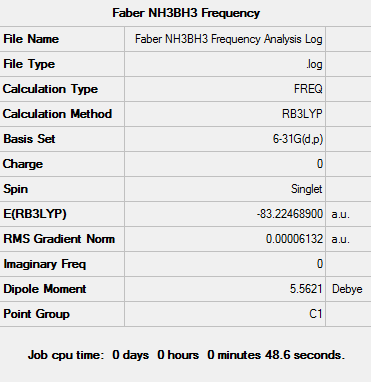
A frequency analysis was done using the NH3BH3 structure which had been previously optimised. (DFT, B3LYP, 6-31G (d,p)).
The log file can be seen here: File:Faber NH3BH3 Frequency Analysis Log.txt
D-space - http://hdl.handle.net/10042/23475
        Item               Value     Threshold  Converged?
Maximum Force            0.000276     0.000450     YES
RMS     Force            0.000061     0.000300     YES
Maximum Displacement     0.001504     0.001800     YES
RMS     Displacement     0.000378     0.001200     YES
Low frequencies ---  -18.4028   -0.0012   -0.0009   -0.0006   12.2831   16.7843
Low frequencies ---  262.4600  631.2099  637.6447
Determination of the dissociation energy
The energies calculated from the three optimised structures can be seen below:
E(BH3)= -26.61532363 a.u.
E(NH3)= -56.55776856 a.u.
E(NH3BH3)= -83.22468905 a.u.
ΔE = E(NH3BH3) - [E(NH3)+ E(BH3)]
ΔE = -83.22468905 - (-56.55776856 + (-26.61532363)]
ΔE = -0.05159686 a.u.
Energy of dissociation = -135.4 kJ/mol
Week 2 - Lewis Acids and Bases
Cl2Al(μ-Br2)AlCl2
Optimisation
The log file can be seen here: File:Al2Br2Cl4 6-31G GEN Optimisation TF log.txt
D-space - http://hdl.handle.net/10042/23558
| Parameters | |
|---|---|
| File Type | .log |
| Calculation Type | FOPT |
| Calculation Method | RB3LYP |
| Basis Set | GEN |
| Charge | 0 |
| Spin | Singlet |
| Total energy(a.u.) | -2352.40630798 |
| RMS Gradient(a.u.) | 0.00000396 |
| Dipole Moment(Debye) | 0.0000 |
| Point Group | D2h |
| Time taken | 3 minutes 22.1 seconds |
        Item               Value     Threshold  Converged?
Maximum Force            0.000007     0.000450     YES
RMS     Force            0.000003     0.000300     YES
Maximum Displacement     0.000170     0.001800     YES
RMS     Displacement     0.000059     0.001200     YES
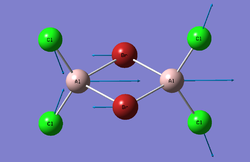
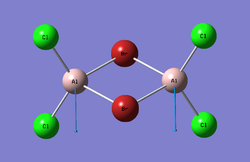
Frequency Analysis
The log file can be seen here: File:Al2Br2Cl4 6-31G GEN FREQ TF log.txt
D-space - http://hdl.handle.net/10042/23785
Low frequencies ---   -5.1798   -5.0280   -3.2282   -0.0033   -0.0026   -0.0014
Low frequencies ---   14.8293   63.2820   86.0840
        Item               Value     Threshold  Converged?
Maximum Force            0.000013     0.000450     YES
RMS     Force            0.000004     0.000300     YES
Maximum Displacement     0.000231     0.001800     YES
RMS     Displacement     0.000100     0.001200     YES
Cis-BrClAl(μ-Cl2)AlClBr
Optimisation
The log file can be seen here: File:Al2Br2Cl4 Isomer 2 6-31G GEN Optimisation TF log.log
D-space - http://hdl.handle.net/10042/23668
| Parameters | |
|---|---|
| File Type | .log |
| Calculation Type | FOPT |
| Calculation Method | RB3LYP |
| Basis Set | GEN |
| Charge | 0 |
| Spin | Singlet |
| Total energy(a.u.) | -2352.41626677 |
| RMS Gradient(a.u.) | 0.00001470 |
| Dipole Moment(Debye) | 0.1658 |
| Point Group | C2v |
| Time taken | 4 minutes 13.2 seconds |
        Item               Value     Threshold  Converged?
Maximum Force            0.000040     0.000450     YES
RMS     Force            0.000016     0.000300     YES
Maximum Displacement     0.001360     0.001800     YES
RMS     Displacement     0.000424     0.001200     YES
Frequency Analysis
The log file can be seen here: File:Al2Br2Cl4 Isomer 2 6-31G GEN FREQ TF log.txt
D-space - http://hdl.handle.net/10042/23797
Low frequencies ---   -3.8194   -2.2357   -0.0040   -0.0032   -0.0027    1.3863
Low frequencies ---   17.2011   50.9456   78.5393
        Item               Value     Threshold  Converged?
Maximum Force            0.000048     0.000450     YES
RMS     Force            0.000015     0.000300     YES
Maximum Displacement     0.001466     0.001800     YES
RMS     Displacement     0.000541     0.001200     YES
Trans-BrClAl(μ-Cl2)AlClBr
Optimisation
The log file can be seen here: File:Al2Br2Cl4 Isomer 3 6-31G GEN Optimisation TF loog.txt
D-space - http://hdl.handle.net/10042/23815
| Parameters | |
|---|---|
| File Type | .log |
| Calculation Type | FOPT |
| Calculation Method | RB3LYP |
| Basis Set | GEN |
| Charge | 0 |
| Spin | Singlet |
| Total energy(a.u.) | -2352.41629858 |
| RMS Gradient(a.u.) | 0.00001563 |
| Dipole Moment(Debye) | 0.0000 |
| Point Group | C2h |
| Time taken | 4 minutes 11.3 seconds |
        Item               Value     Threshold  Converged?
Maximum Force            0.000039     0.000450     YES
RMS     Force            0.000015     0.000300     YES
Maximum Displacement     0.000464     0.001800     YES
RMS     Displacement     0.000166     0.001200     YES
Frequency Analysis
The log file can be found here: File:Al2Br2Cl4 Isomer 3 6-31G GEN FREQ TF log.txt
D-Space - http://hdl.handle.net/10042/23821
Low frequencies ---   -4.8002   -0.0033   -0.0032   -0.0014    1.4545    2.2600
Low frequencies ---   18.1746   49.1207   73.0075
        Item               Value     Threshold  Converged?
Maximum Force            0.000050     0.000450     YES
RMS     Force            0.000016     0.000300     YES
Maximum Displacement     0.000572     0.001800     YES
RMS     Displacement     0.000254     0.001200     YES
BrClAl(μ-Br,Cl)AlCl2
Optimisation
File:Al2Br2Cl4 Isomer 4 6-31G GEN Optimisation TF log.txt
D-space - http://hdl.handle.net/10042/23768
| Parameters | |
|---|---|
| File Type | .log |
| Calculation Type | FOPT |
| Calculation Method | RB3LYP |
| Basis Set | GEN |
| Charge | 0 |
| Spin | Singlet |
| Total energy(a.u.) | -2352.41109944 |
| RMS Gradient(a.u.) | 0.00001563 |
| Dipole Moment(Debye) | 0.1385 |
| Point Group | C2 |
| Time taken | 4 minutes 6.4 seconds |
        Item               Value     Threshold  Converged?
Maximum Force            0.000035     0.000450     YES
RMS     Force            0.000014     0.000300     YES
Maximum Displacement     0.000524     0.001800     YES
RMS     Displacement     0.000183     0.001200     YES
Frequency Analysis
The log file can be seen here: File:Al2Br2Cl4 Isomer 4 6-31G GEN FREQ TF log.txt
D-space - http://hdl.handle.net/10042/23808
Low frequencies ---   -2.2898   -0.0026   -0.0014    0.0010    1.2536    3.3243
Low frequencies ---   17.1617   55.9535   80.0563
        Item               Value     Threshold  Converged?
Maximum Force            0.000034     0.000450     YES
RMS     Force            0.000016     0.000300     YES
Maximum Displacement     0.001340     0.001800     YES
RMS     Displacement     0.000523     0.001200     YES
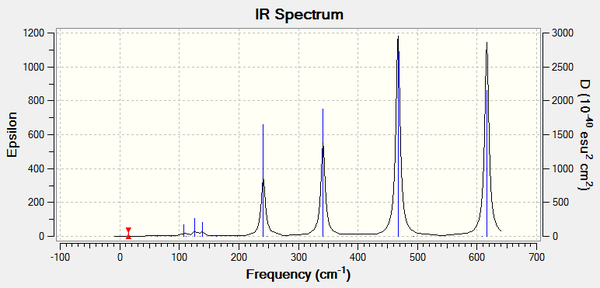
Infrared Spectroscopy
Cl2Al(μ-Br2)AlCl2
The IR spectrum for Cl2Al(μ-Br2)AlCl2 can be seen below:
Cis-BrClAl(μ-Cl2)AlClBr
The IR spectrum for Cis-BrClAl(μ-Cl2)AlClBr can be seen below:
Trans-BrClAl(μ-Cl2)AlClBr
The IR spectrum for Trans-BrClAl(μ-Cl2)AlClBr can be seen below:
BrClAl(μ-Br,Cl)AlCl2
The IR spectrum for BrClAl(μ-Br,Cl)AlCl2 can be seen below:
IR Analysis
The pre-requisite for a vibrational mode to be infrared active is that there must be a change in dipole moment associated with the molecule.
With the 4 isomers observed for Al2Br2Cl4 there are clearly 4 different spectra. The principle reason for the differences in the 4 spectra is the relative positions of the chlorine and bromine atoms. The position of these atoms is vital because it directly affects the molecular vibrations which in turn determines the nature of the dipole moment.
The large peaks which are clearly visible on the spectrum are caused by the various vibrational modes of each isomer which are infrared active (have a change in molecular dipole moment). Another factor which determines the number of peaks present in a spectrum is the symmetry of a molecule. The more symmetric a molecule is the fewer the number of peaks. These two factors can be best explained in the cis-BrClAl(μ-Cl2)AlClBr isomer and the trans-BrClAl(μ-Cl2)AlClBr isomer whose spectra are near identical.
When comparing the structure of the two molecules both have the two bridging chlorines so have fairly high symmetry - the only difference is the positions of the terminal bromine and chlorine. This leads to very similar stretches as illustrated by the two spectra. The peak at 461 cm-1 which is present in the -cis isomer does not appear in the -trans and this can be explained by the two different vibrations caused by slightly differing molecule symmetry. The -cis isomer vibrational mode at 461 cm-1 does appear because it results in a dipole moment change whereas this is not the case for the -trans equivalent.
If one compares the -cis and -trans to the other two isomers there are fewer intense peaks and this can also be explained by the highly symmetric nature of the former.
Relative Energies
The energies of the four optimised molecules can be seen in the table below:
| Molecule | Energy (a.u.) | Energy (kJ/mol) | Relative Energy (kJ/mol) |
|---|---|---|---|
| Cl2Al(μ-Br2)AlCl2 | -2352.40630798 | -6176242.762 | 26.23 |
| Cis-BrClAl(μ-Cl2)AlClBr | -2352.41626677 | -6176268.908 | 0.08 |
| Trans-BrClAl(μ-Cl2)AlClBr | -2352.41629858 | -6176268.992 | 0.00 |
| BrClAl(μ-Br,Cl)AlCl2 | -2352.41109944 | -6176255.342 | 13.65 |
By comparing the energies, it is possible to determine the most stable of the isomers. In this case, Trans-BrClAl(μ-Cl2)AlClBr has the most negative value for energy (the lowest) and is therefore the most stable (having verified that all of the isomers have been fully optimised).
Trans-BrClAl(μ-Cl2)AlClBr which is the most stable isomer (from the respective energies) consists of two molecular fragments. In each of the two identical fragments there is an atom which can act as the electron pair acceptor (Lewis acid) and an atom which can act as the electron pair donor (Lewis base).
The relative stability of the trans isomer to the other three could be explained by these Lewis acid and Lewis base fragment pairs. The formation of the adduct complex is stabilised by the interaction betweeen the electron donating atom and the electron accepting atom which is not present in the other three isomers.
AlBrCl2 Optimisation
The log file can be seen here: File:AlBrCl2 Monomer 6-31G GEN Optimisation TF log.txt
D-Space - http://hdl.handle.net/10042/23853
| Parameters | |
|---|---|
| File Type | .log |
| Calculation Type | FOPT |
| Calculation Method | RB3LYP |
| Basis Set | GEN |
| Charge | 0 |
| Spin | Singlet |
| Total energy(a.u.) | -1176.19013697 |
| RMS Gradient(a.u.) | 0.00000291 |
| Dipole Moment(Debye) | 0.1134 |
| Point Group | C2h |
| Time taken | 46.6 seconds |
        Item               Value     Threshold  Converged?
Maximum Force            0.000005     0.000450     YES
RMS     Force            0.000002     0.000300     YES
Maximum Displacement     0.000022     0.001800     YES
RMS     Displacement     0.000012     0.001200     YES
The energies calculated from the optimised monomer and adduct structures can be seen below:
E(monomer)= -1176.19013697 a.u. E(adduct)= -2352.41629858 a.u.
The Dissociation Energy can be calculated from the equation below:
ΔE = E(adduct) - [2 x E(monomer)]
Edissociation = -2352.41629858 - 2(-1176.19013697)
Edissociation = -0.03602464 a.u. = - 94.58 kJ/mol
The negative nature of this value is indicative of the fact that the adduct is favoured over the two dissociated monomers.
AlBrCl2 Frequency
The log file can be seen here: File:AlBrCl2 Monomer 6-31G GEN FREQ TF log.txt
D-space - http://hdl.handle.net/10042/23863
The low frequency values have been extracted from the corresponding output file and show that the frequency calculation is complete:
Low frequencies ---   -2.4223    0.0010    0.0034    0.0038    2.7465    2.9629
Low frequencies ---  120.5194  133.8347  185.7791
        Item               Value     Threshold  Converged?
Maximum Force            0.000008     0.000450     YES
RMS     Force            0.000003     0.000300     YES
Maximum Displacement     0.000021     0.001800     YES
RMS     Displacement     0.000009     0.001200     YES
Molecular Orbitals
References
[1] ↑ M. Schuurman, W. Allen, H. Schaefer, Journal of Computational Chemistry, 2005, 26, 1106
[2] ↑ J. Blixt et al., J. Am. Chem. Soc. , 117, 1995, pp 5089 - 5104
[3] ↑ C. Ballhausen, H. Gray, Inorg. Chem. , 1 (1), 1962, pp 111-122

