Rep:Mod:StuartFoot
Module 1 - Bonding (Ab initio and density functional molecular orbital)
Samuel Murphy
BH3
Optimisation of Energy
The BH3 molecule was sketched in GaussView 5.0 and each B-H bond alongated to 1.5 Å. An gjf input file was created to optimise (job type = OPT) the geometry of the molecule with the DFT/B3LYP method and basis set 3-21G. This BLYP method determines the type of approximations made in the Schrödinger equation and the basis set (3-21G) determines the accuracy. Due to the low accuracy of this particular basis set, the calculations did not take long (< 10s). The input file was submitted to SCAN (DOI:10042/to-10502 ) and the log file analysed. This optimisation calculated the optimum position of the nuclei of the given electronic configuration; the first step for any quantum mechanical calculation.
It was found that the optimised B-H bond distance was 1.19 Å (accurate to 0.01 Å) and the optimised H-B-H bond angle was 120o accurate to ≈ 0.1°. These measurements had good agreement with the literature [1] values of 1.20 Å and 120o. The results summary shown below (figure 1) lists important information about the calculation including the gradient (RMS Gradient norm) which is important to check that the molecule is fully optimised.
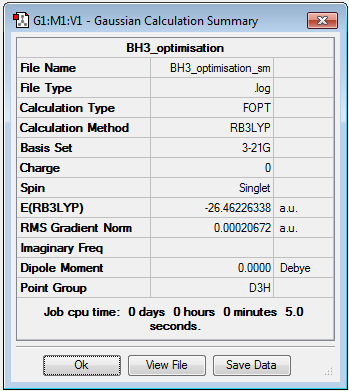
The gradient of 0.00020672 a.u is less than the 0.001 a.u needed to ensure optimisation but ideally the number should be as close to zero as possible. Further analysis of the .log file confirmed that job had really converged (figure 2):


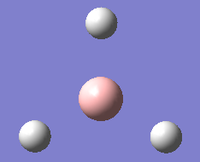
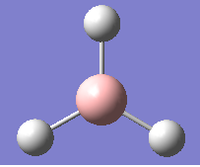
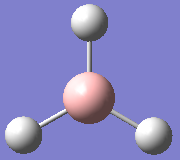
Figure 2 shows that the forces (gradient of energy vs. distance graph) are converged as well as the displacements meaning for a small displacement the energy does not change.The .log file also confirmed the optimised bond lengths and bond angles stated before (figure 3). The optimisation was further analysed by opening the .log file on GaussView 5.0 and viewing the optimisation results. The two graphs in figure 4 and 5 show how the energy and gradient respectively have changed over the optimisation. Table 1 shows the structure of the molecule corresponding to each of the four stages of the optimisation.
| Optimisation step | 1 | 2 | 3 | 4 |
|---|---|---|---|---|
| Molecular structure | 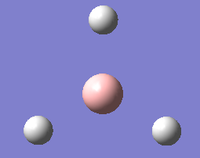 |
 |
 |
|
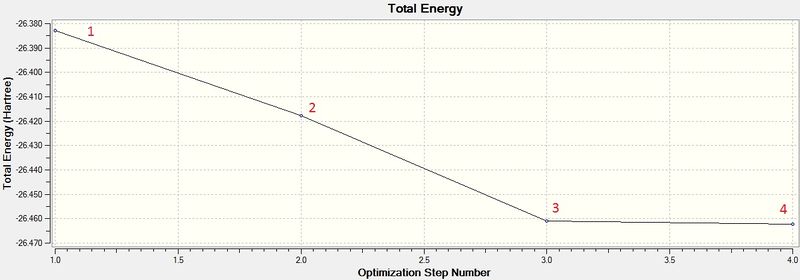
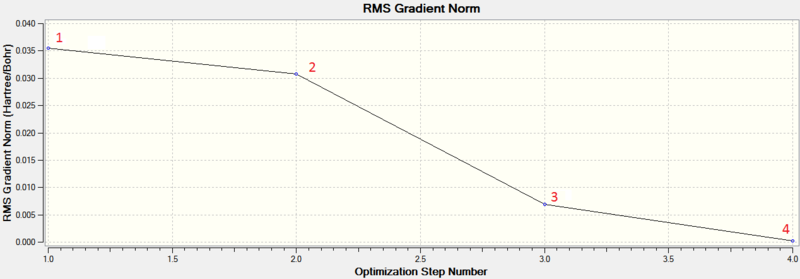
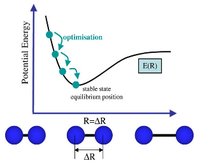
The first two structures are missing bonds due to the distances exceeding some pre-defined value GaussView uses but they are still there. It can be seen that the last structure has the most negative energy and also that the gradient is closest to zero at this minimum energy. This can be rationalised by looking at the dissociation curve of a diatomic representing a potential energy curve. When the distance between the nuclei is small they repel each other (raising the energy) but as this distance is increased a stable state is reached. Further elongation of the bond decreases the nuclear attraction which also increase the energy. The stable point mentioned is the equilibrium between these repelling and attractive forces where there is no net force acting upon the molecule. When optimising a molecule, this stable point is trying to be attained. The schrödinger equation is solved for a particular position of nucleus and electrons to obtain an energy E(R). It is then solved again with a slight change in the position of the nucleus and electrons to find a new energy E(R'). If this energy is lower than E(R), the process is continued until the energy stops decreasing as the stable state has been achieved (figure 6). This can be seen in figure 4 as the Total energy keeps decreasing until it is lowest for structure number 4. At this stable point (figure 6) the curve is neither increasing nor decreasing. This can be seen in figure 5, as the gradient of the last optimisation step is closest to zero.[2]
Molecular Orbitals (MO) analysis
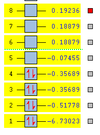
The checkpoint file (.chk) from the previous optimisation was opened on GaussView 5.0 and a new .gjf input file created. The method was changed from optimisation to energy but the method (DFT/B3LYP) and basis set (3-21G) kept the same. "pop=full" was added to the additional keywords as well as "Full NBO" being selected from the NBO tab. The .gjf input file was submitted to SCAN (DOI:10042/to-10504 ) and the .chk checkpoint file opened on GaussView 5.0. The MO option was selected under edit and molecular orbitals 1-8 analysed. The unoccupied orbitals are more diffuse and odd formed than the occupied ones but have still been included in the analysis. The Molecular Orbital diagram[3] for the trigonal planar D3h BH3 molecule was drawn on ChemDraw inlcuding the LCAOs for each energy level. The real molecular orbitals calculated on Gaussian were added to the diagram next to the corresponding LCAOs. This diagram is shown below in figure 7b (relative energies figure 7a):
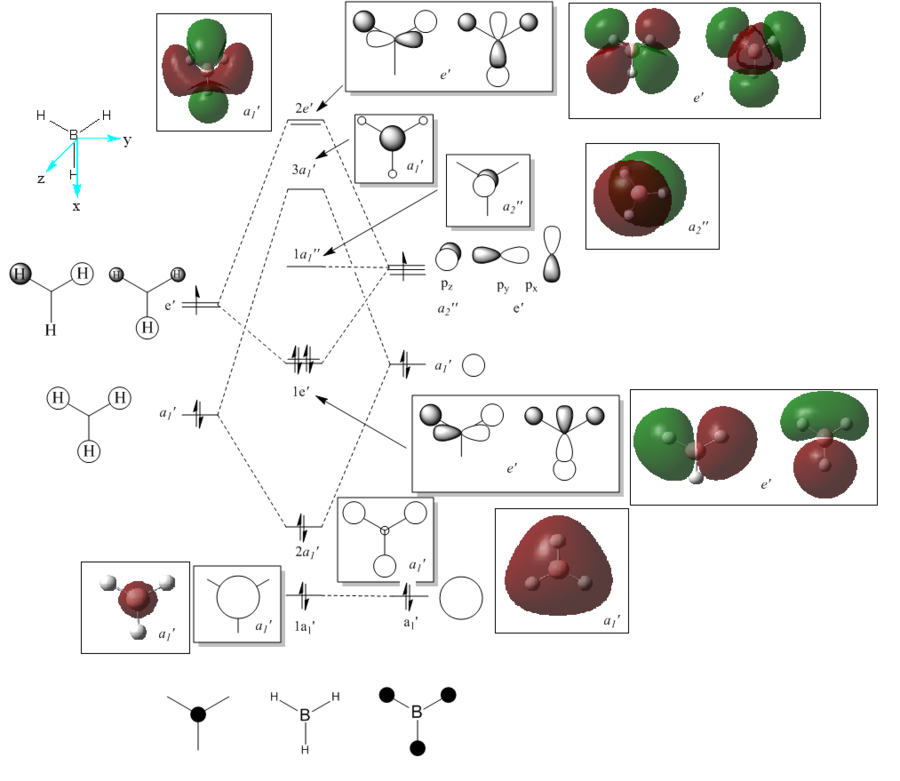
The real MOs were matched up with the LCAO orbitals in the order they were calculated on Gaussview. This presented a problem as not all of the orbitals matched up. However, there was excellent agreement between the real and LCAO MOs from 1-5 corresponding to the HOMO-3, HOMO-2, HOMO-1, HOMO and LUMO molecular orbitals (in increasing energy). It can be seen that the LUMO MO is the non-bonding pz orbital lying orthogonal to the BH3 plane. This shows the lewis acidic nature of the molecule as this low energy LUMO can accept electrons from higher energy HOMOs to form adducts. The significant difference between the real and LCAO MOs was for the 3a1' and 2e' orbitals. It is clear that the 3a1' orbital should be higher in energy than the 2e' orbital shown below in figure 8:

Now it can be seen that there is also agreement for MOs 6-8 which correspond to the LUMO+1, LUMO+2 and LUMO+3 molecular orbitals (in increasing energy). All of the MOs calculated have the correct phase patterns and nodes compared to the LCAOs and are similar size and shape apart from some of the unoccupied MOs which are a bit more diffuse. This shows that although MO theory is accurate and useful for simple diatomics like H2, as the molecule size and MO complexity increases, the accuracy and usefulness decreases. MO theory is qualitative whereas the quantitative MO calculations on Gaussian use quantum mechanics considering the electronic structure so are much more reliable.
Natural Bond Orbital (NBO) analysis
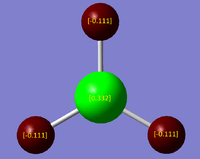
The .log file of the energy calculation used for the MO analysis was opened on GaussView 5.0 and the charge distribution selected from the results tab. The colour atoms by charge option was selected with bright green indicating highly positive charge and bright red indicating highly negative charge. "Show numbers" was also selected to find the NBO charges of the boron and hydrogen atoms. However, there seemed to be a glitch on GaussView 5.0 and the numbers would not all show together. Therefore the molecule was edited on paint to include the numbers shown (figure 9). These NBO charges shown were -0.111 D for the hydrogens and 0.332 D for the boron. However, the charge is only accurate to 0.01 D and so the actual charges are -0.11 D for the 3 hydrogens and 0.33 D for the boron.
To find more information from the NBO analysis than just "atomic charges", the .log file was opened on wordpad and analysed. Firstly though, these atomic charges shown in figure 9 were confirmed by looking at the numbers under the "Natural Charge" heading of the "Summary of Natural Population Analysis" section (figure 10).

The section with the heading "Bond orbital/ Coefficients/ Hybrids" describes the bonding in the molecule, shown below in figure 11:
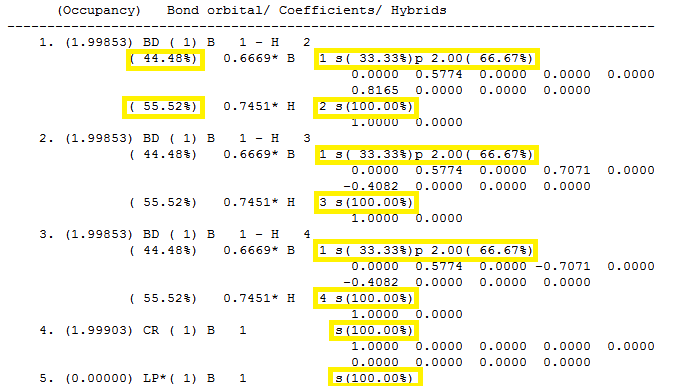
This Natural Population Analysis localises the electron density of the whole molecule into individual atomic orbitals which are then used to form 2c-2e bonds between atoms. The first bond (BD) is between boron (atom 1) and Hydrogen (atom 2) and shows that 44.48 % of the bond is attributed to the boron and 55.52 % to the hydrogen. The hybridisation of the boron is shown to be hybridised from 33.33 % s character and 66.67 % p character so is sp2 hybridised as expected. The hydrogen atom is shown to be 100 % s character. This is the same for second and third bonds which shows that boron has formed 3 sp2hybridised orbitals which interact with the 100% s atomic orbitals of each of the hydrogen atoms. The fourth orbital is the core 1s atomic orbital of boron so is 100% s character. Finally, the 5th orbital belongs to the boron lone pair (LP*) and is shown as 100 % s character. However, this is a flaw with the calculation as it it should be the 100 % p character of the pz orbital lying orthogonal to the trigonl planar molecule.
Second Order Perturbation Theory Analysis of Fock Matrix in NBO Basis Figure 12 below shows any mixing between MOs.The main interactions are from bonding NBOs into non-bonding or anti-bonding orbitals. All 3 values in the E(2) column (1.51 kcalmol-1 are less than 20 kcalmol-1 needed to be of interest so there is no useful information for this particular molecule.

Finally, the "Natural Bond Orbital (Summary)" shows the energy and population or ocupation of the different B-H bonds as well as the B lone pair.
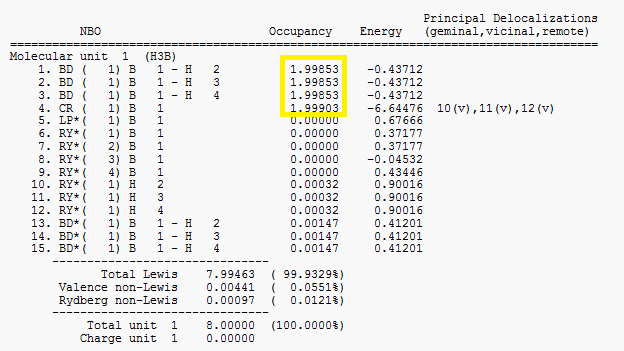
It can be seen that occupancy for the first 4 bonds is effectively 2 which agrees with the previous analysis of the 3 2c-2e B-H bonds and the core B orbital containing 2 electrons.
Vibrational analysis

The .log file of the previously optimised BH3 molecule was opened on GaussView 5.0 making sure the "Read Intermediate Geometries" tick-box was unchecked. A new .gjf file was created with job type = frequency, method = DFT/B3LYP, basis set = 3-21G as well as "pop=(full,nbo) added to the additonal keywords. The file was submitted to SCAN (DOI:10042/to-10514 ) and the resulting output .log file opened on Gaussview 5.0. The results summary (figure 14) shows that the summary energy is the same as that recorded for the previous BH3 optimisation (-26.46226388 a.u) showing that the structures are the same. The .log output file was opened on wordpad and the low frequencies found. Every molecule has 3N-6 vibrations with the '-6' being these low frequencies which are the motions at the center of the mass of the molecule. The better the calculation method used, the closer the values are to zero. However, they are always expected to be at least an order of magnitude smaller than the 1st vibrational stretch. These are shown below in figure 15 along with 6 vibrational modes.
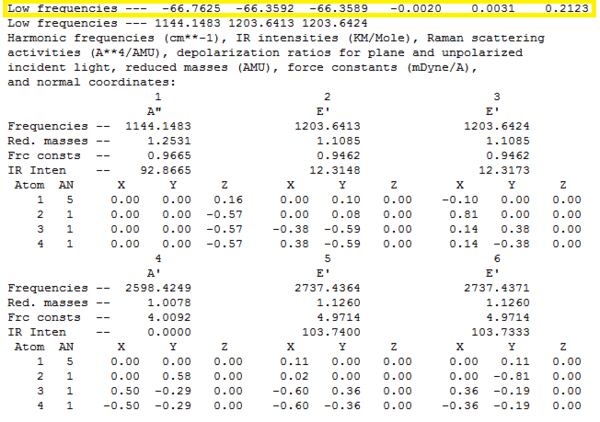
The .log file was opened on GaussView 5.0 and the vibrational results displayed. These are shown below in table 2 for the 6 vibrational modes including descriptions, frequencies, literature frequencies, intensities, symmetries and links to the animations.
| Vibrational mode number | Symmetry: D3h point group | Form of the Vibration | Vibrational description | Frequency/cm-1 | Literature[4] frequency/cm-1 | IR Intensity |
|---|---|---|---|---|---|---|
| 1 | a<sub>2</sub>'' | 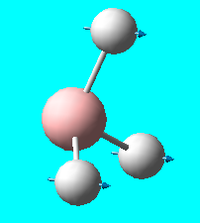 |
Wag (out of plane)): all 3 hydrogens move forward and backwards in a concerted process | 1144 | 1147.1 | 93 |
| 2 | e' | 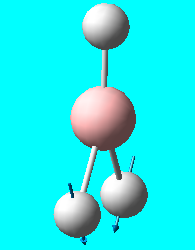 |
Scissor (in plane) : 2 hydrogens bend downwards together symmetrically - 3rd hydrogen does not bend | 1204 | 1196.3 | 12 |
| 3 | e' | 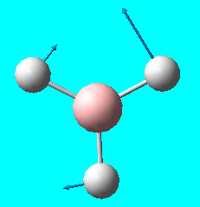 |
Rocking (in plane): 2 hydrogens rock in plane in one direction - 3rd hydrogen rocks in the opposit direction | 1204 | 1196.3 | 12 |
| 4 | a<sub>1</sub>' totally symmetric | 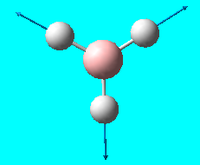 |
Symmetric stretch : all 3 hydrogens stretch backwards and forwards along the B-H bond together symmetrically | 2598 | 2497.4 | 0 |
| 5 | e' | 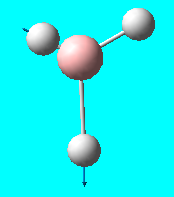 |
Asymmetric stretch (in plane) : As one hydrogen stretches away from the boron, the other hydrogen compresses towards asymmetrically - the 3rd hydrogen is stationary | 2737 | 2601.3 | 104 |
| 6 | e' | 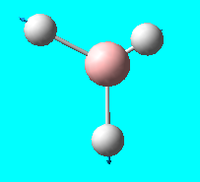 |
Asymmetric stretch (in plane): 2 hydrogens stretch away from the boron symmetrically - the 3rd hydrogen compresses towards the boron at the same time | 2737 | 2601.3 | 104 |
These frequency values show good agreement with literature which shows high accuracy for the calculation. The IR spectrum for these vibrations is shown below in figure 16.
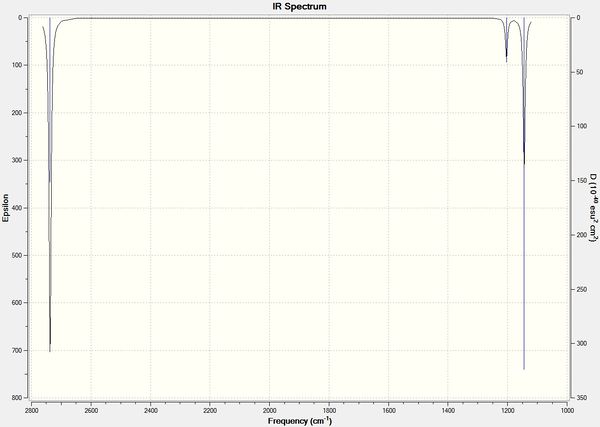
There are 4 degrees of freedom so 6 vibrational modes are expected according to the 3N-6 rule. However, there are only 3 stretches shown on the IR spectrum. Firstly, the stretch at 2598 cm-1 has an intensity of zero as it does not involve a change in dipole moment so does not show up on the spectrum. There are 2 sets of degenerate vibrational modes at 1204 and 2737 cm-1 both belonging to the e' symmetry so only 2 stretches are shown instead of 4. The a2 stretch is shown on the spectrum at 1144 cm-1 to make up the third visible stretch.
TlBr3
Optimisation of energy
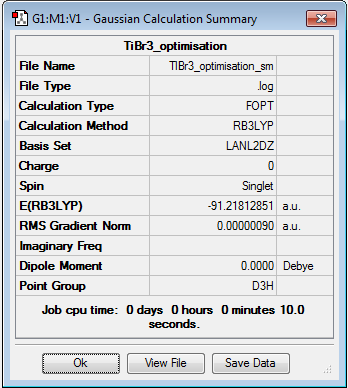
TlBr3 was sketched in GaussView 5.0 and the symmetry "point group" constrained to D3h with an increase in tollerance to "Very tight (0.0001)". A new .gjf input file was created with job type = optimisation, method = DFT/B3LYP and basis set = LANL2DZ. This is a medium level basis set which uses D95V on first row atoms and the pseudo potential Los Alamos ECP on heavier elements. The input file was submitted to SCAN (DOI:10042/to-10503 ) and the resulting .log output file opened to analyse on GaussView 5.0. The optimised Tl-Br bond distance and Br-Tl-Br bond angle were calculated at 2.65 Å and 120o respectively. These agree favourably with the literature[5] values of 2.52 Å and 120o. The results summary is shown below in figure 17:
Vibrational analysis
The optimisation of the TlBr3 stucture was confirmed by vibrational analysis. The .log outout file from the previous optimisation was opened and a .gjf input file created. The "job type" was changed to frequency but the method and basis set kept the same to DFT/B3LYP and LANL2DZ respectively. A different method and basis set would perform the calculations in a different way so it is important to keep them the same. It would affect the accuracy of the results meaning the optimisation results would be incomparable to the frequency results. Furthermore, if a more accurate method and basis set were used, a local minimum might be found instead of a true global minimum. The input file was submitted to SCAN (DOI:10042/to-10515 ) and the resulting .log out put final analysed on GaussView 5.0.
The low frequencies were found from the .log file as for the BH3 molecule shown below in figure 18.

These low frequencies are close to zero as expected but a more accurate method could make them closer still. The lowest "real" normal mode is 46 cm-1.
This frequency analysis is important to confirm that the optimisation has indeed reached the ground state. The vibrational frequencies were all positive which ensures that this minimum has been reached. The calculations effectively take the second derivative of the PES and so a positive value indicates a minimum and a negative value indicates a maximum. If negative values were calculated this would indicate a maximum ie. a transition state which is not any kind of minima. The 6 vibrational modes including descriptions, frequencies, literature frequencies, intensities, symmetries and links to the animations are shown below in table 3.
| Vibrational mode number | Symmetry: D3h point group | Form of the Vibration | Vibrational description | Frequency/cm-1 | Literature[6] | IR Intensity |
|---|---|---|---|---|---|---|
| 1 | e' | 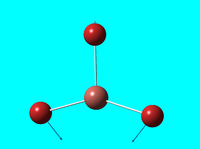 |
Scissor (in plane)Rocking (in plane): 2 hydrogens bend upwards and downwards together symmetrically - 3rd hydrogen does not bend | 46 | 47 | 4 |
| 2 | e' | 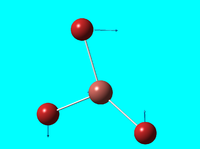 |
Rocking (in plane): 2 hydrogens rock in plane in one direction - 3rd hydrogen rocks in the opposit direction | 46 | 47 | 4 |
| 3 | a2'' | 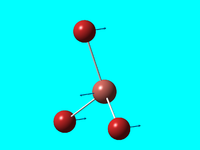 |
Wag (out of plane) : all 3 hydrogens move forward and backwards in a concerted process | 52 | 63 | 6 |
| 4 | a1' (totally symmetric) | 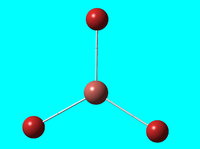 |
Symmetric stretch : The boron atom is stationary, the three hydrogen atoms move in and out at the same time | 165 | 185 | 0 |
| 5 | e' | 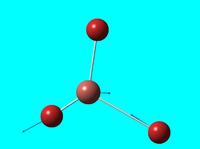 |
Asymmetric stretch (in plane) : One B-H bond has constant length, whilst the remaining two bonds move in and out asymmetrically. | 211 | 203 | 25 |
| 6 | e' | 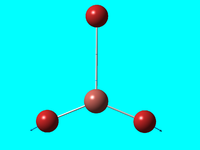 |
Asymmetric stretch (in plane): Two B-H bonds move in an out symmetrically, whilst the third stretches asymmetrically (with respect to the other two bonds). | 211 | 203 | 25 |
These frequencies have good agreement with the literature values which shows that the method used for calculation was accurate. The calculated IR spectrum for TlBr3 is shown below in figure 19.
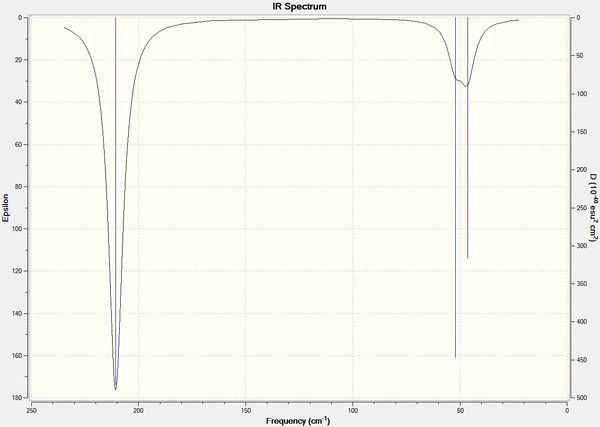
Like the BH3 molecule there are only 3 stretches present on the IR spectrum. Vibrational mode 4 (frequency = 165 cm-1) has an intensity of zero as it does not involve a change in dipole moment so does not show up on the spectrum. There are again 2 sets of degenerate vibrational modes at 46 and 211 cm-1 both belonging to the e' symmetry so only 2 stretches are shown instead of 4. The a2 stretch is shown on the spectrum at 52 cm-1 to make up the third visible stretch.
What is a bond?
In some structures GaussView does not draw the expected bonds between atoms but this does not mean that there is no bond. A bond is a region of electron density between two atoms electrostatically attracted to each of the nuclei. When this attraction is increased the distance between the nuclei decreases and when it is decreased the distance between the nuclei increases. GaussView sets some predefined limit on 'bond' lengths so if the two atoms pass this limit it appears that there is no bond between them but the electron density is still there. The description of a bond as an electrostatic attractive force between two nuclei differs to MO theory which delocalises this electron density throughout the whole molecule. The energy level and charge density of MOs are considered along with their size and shape which all affect the orbital overlap to form the "bond" between atoms/molecules.
Isomers of Mo(CO)4L2
It was found from the second year inorganic synthesis labs that the cis isomer of Mo(CO)4(PPh3)2 contained 4 vibrational carbonyl bands while trans isomer of Mo(CO)4(PPh3)2 only contained 1 vibrational carbonyl band. The two isomers were optimised and the vibrational modes analysed to shed more light on this observation. However, the bulky phenyl groups were replaced with chlorines to reduce the computational demand of the calculations. Chlorines have similar electronic contribution as the phenyls to bonding so this a valid swap.
Optimisation of Energy
Both isomers were sketched on GaussView 5.0 and .gjf input files created. Firstly they were loosely optimised (job type = OPT), method = B3LYP with basis set LANL2MB and additonal keyword opt=loose. The cis and trans input files were submitted to SCAN (cis (DOI:10042/to-10516 ) & trans (DOI:10042/to-10517 ) and the resulting .log files analysed on GaussView 5.0. This low level optimisation is useful in finding bond lengths and bond angles but falls short for dihedral angles affecting the P-Cl geometry. If these bonds are not in their optimsed geometry then a local minimum may be found instead of the required global minimum. Therefore, the two loosely optimised structures were altered on GaussView 5.0 shown below in figures 20 and 21. For the cis- isomer, on one P atom one Cl is pointing up parallel to the axial bond whereas on the other P atom one Cl is pointing down parallel to the axial bond. This ensures a torsion angle of 180o(figure 20). For the tran- isomer, the two PCl3 groups are eclipsed ensuring that one of the P-Cl bonds aligns with one of the Mo-C bonds (figure 21).
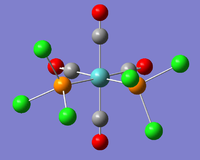 |
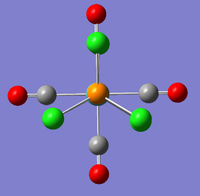 | |||
Both of these structures were then optimised again but this time using the more accurate LanL2DZ pseudo-potential and basis set. The method was still B3LYP but the "opt=loose" was replace by "int=ultrafine scf=conver=9" in the additional key words. The .gjf input file was submitted to SCAN (cis -(DOI:10042/to-10518 ) & trans - (DOI:10042/to-10519 )) and the resulting .log output files analysed on GaussBiew 5.0.
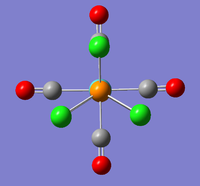
The new optimised structures and corresponding results summaries are shown below for the cis- and trans- isomers in figures 22 & 23 and figures 24 & 25 respectively.
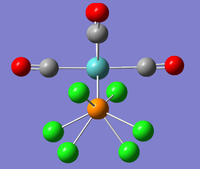 |
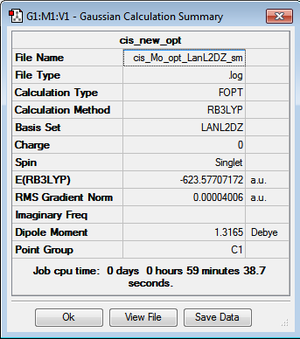 |
 |
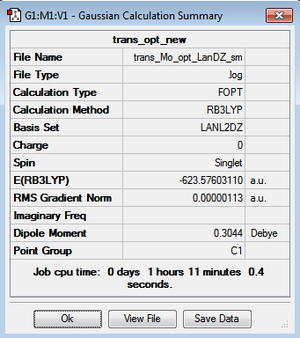 | ||
It can be seen that the cis energy (-623.57707172 a.u)is lower than the trans energy (-623.57603110 a.u) by 0.00104 a.u which corresponds to 2.73 KJmol-1. This suggests the cis- isomer is more thermodynamically stable than the trans isomer.
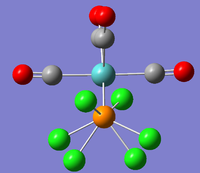
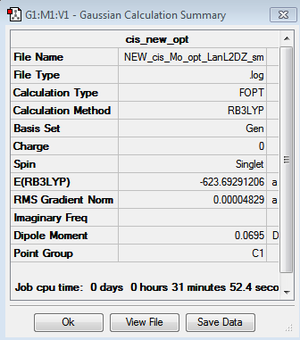
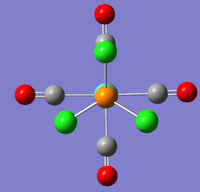
However, the LanL2DZ pseudo potential and basis sets are still inaccurate for the phosphorus as they only take into account a minimal basis ie. s and p valence orbtial functions. Phosphorus has low lying d orbitals which explain its tendency to form hypervalent compounds. Therefore, the optimised structures were again optimised but with the additional dAO functions. The adulterated .gjf input file was submitted to SCAN (cis - (DOI:10042/to-10624 ) & trans - (DOI:10042/to-10625 )) and the .log file analysed on GaussView 5.0. These newly optimised structures taking into account dAO interactions and their results summaries are shown below for the cis- and trans- isomers in figures 26 & 27 and figures 28 & 29 respectively.
 |
 |
 |
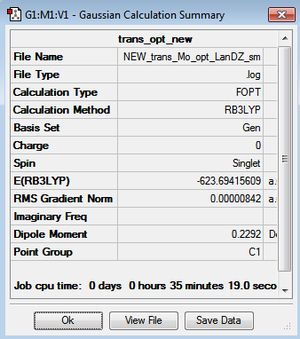 | |
It can now be seen that trans energy (-623.69415609 a.u) is lower in energy than the cis energy (-623.69291206 a.u) by 0.00124 a.u which corresponds to 3.26 KJmol-1. So, the new method taking into account the dAO functions has calculated that the trans- isomer is now the more thermodynamically isomer which agrees with the literature [7]. However, there is an error on the calculation of +/- 10 KJmol-1 so a more accurate method is needed to tell which is the more stable isomer. The trans isomer is more stable than the cis isomer as there are less steric clashes in the trans form due to the large PCl3 groups being positioned trans-to each other. Therefore if the size of the L=PR3 ligands was changed the cis form may be more favourable as teh steric clashes would be reduced. Due to time constraints, this was not able to be investigated.
| Bond | Calculated Bond Length (Å) | Literature[8] Bond Length (Å) |
|---|---|---|
| Mo-P | 2.48 | 2.57 |
| Mo-C | 2.05 | 2.02 |
| C-O | 1.18 | 1.15 |
| P-Cl | 2.12 | |
| Bond angle (o) | Calculated Bond Angle (o) | Literature[8] Bond Angle (o) |
| P-Mo-P | 94.3 | 104.6 |
| C-Mo-C | 178.7 & 90.0 | 179 & 89 |
| Bond | Calculated Bond Length (Å) | Literature[7] Bond Length (Å) |
|---|---|---|
| Mo-P | 2.42 | 2.50 |
| Mo-C | 2.06 | 2.01 |
| C-O | 1.17 | 1.16 |
| P-Cl | 2.12 | |
| Bond angle (o) | Calculated Bond Angle (o) | Literature[7] Bond Angle (o) |
| P-Mo-P | 176.7 | 180 |
| C-Mo-C | 178.4 & 89.2 | 83 |
It can be seen that the large majority of the bond lengths and angles have good agreement with the literature values. However, the Mo-P bond for both isomers is not as accurate which could be due to the fact the phenyl groups were replaced with chlorines. It can be seen that the C-O bond is slightly longer in the cis isomer than the trans isomer (1.18 vs 1.17 Å) but that the Mo-C bond for the cis isomer is shorter than in the trans isomer (2.05 vs. 2.06 Å). These can be explained by considering the different geometries of the two isomers. In the cis isomer, the PCl3 ligands lie trans to the carbonyl ligands. Electron density is donated from the phosphorus to the Mo which increases the back-bonding into the C-O π* anti-bonding orbital. This strengthens the Mo-C hence making it shorter and weakens the C-O carbonyl bond hence making it longer.
Vibrational analysis
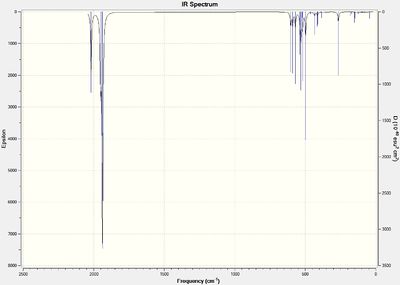
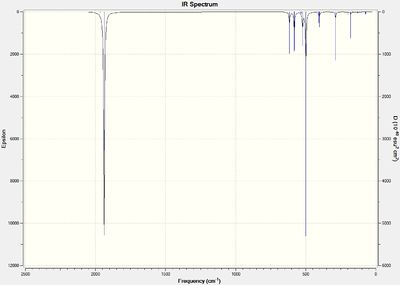
The .log files of the previously optimised molecules were saved as .gjf files on GaussView 5.0. The job type was changed to frequency but the method and basis set kept the same and the additional keywords kept the same. The two files were submitted to SCAN (cis-(DOI:10042/to-10626 ) & trans-(DOI:10042/to-10627 )). The .log files were opened on GaussView and the vibrations analysed. The IR spectrums for the cis- and trans- isomers are shown below in figures 30 and 31 respectively.
 |
 | |||
The first 5 vibrations for the cis-isomer are all negative frequencies whilst only the first 4 frequencies of the trans isomer are negative. These frequencies were animated on GaussView 5.0 and screenshots taken clearly showing the movement of relative groups with displacement vectors. These vibrational frequencies are shown below in tables 6 and 7 for the cis- and trans- isomer respectively.
| Vibrational mode number | Form of the Vibration | Frequency (cm-1) | Intensity |
|---|---|---|---|
| 1 | 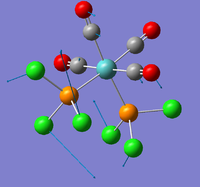 |
-76 | 0.0515 |
| 2 | 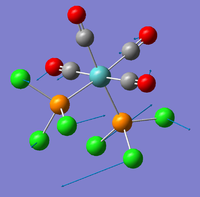 |
-76 | 0.0734 |
| 3 | 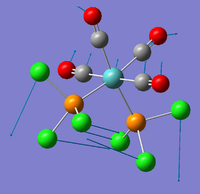 |
-42 | 0.3250 |
| 4 | 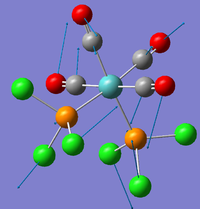 |
-26 | 1.3481 |
| 5 | 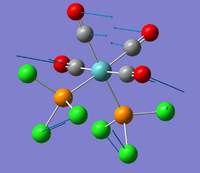 |
-16 | 0.0086 |
| Vibrational mode number | Form of the Vibration | Frequency (cm-1) | Intensity |
|---|---|---|---|
| 1 | 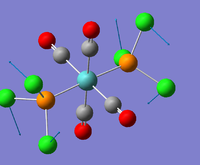 |
-82 | 0 |
| 2 | 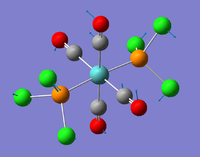 |
-64 | 0.4458 |
| 3 | 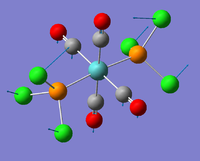 |
-56 | 0.9515 |
| 4 | 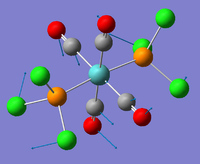 |
-48 | 0.4762 |
These negative frequencies show that at room temperature the two isomers are inter-converting due to the small different in energy between them. There is free rotation around the metal-carbonyl bond and so the c-s and trans forms can rapidly inter-convert. The accuracy of the method is not high enough to accurately determine which isomer is the more stable.
The calculated carbonyl frequencies are shown below in tables 8 & 9 and compared to literature values.
| Vibrational mode number | Frequency (cm-1) | Literature[9] Frequency (cm-1) | Intensity | |
|---|---|---|---|---|
| 42 | 1937 | 1897 | 1586 | |
| 43 | 1940 | 1908 | 828 | |
| 44 | 1952 | 1927 | 603 | |
| 45 | 2018 | 2023 | 562 |
| Vibrational mode number | Frequency (cm-1) | Literature[10] Frequency (cm-1) | Intensity |
|---|---|---|---|
| 42 | 1938 | 1896 | 1590 |
| 43 | 1939 | 1896 | 1587 |
The calculated frequencies in general are not that accurate compared to the literature due to the low accuracy method and the substitution of chlorines for the phenyls. The 4 carbonyl frequencies of the cis isomer are shown as predicted. The trans isomer has higher symmetry than the cis isomer so has more IR inactive vibrational modes resulting in just 1 carbonyl frequency expected. However, the calculated values show two vibrational modes due to the two degenerate frequencies at 1938 and 1939 cm-1. One stretch involves two trans carbonyls stretching symmetrically whilst the other two carbonyls are still. The degenerate frequency is the same but the previously stationary carbonyls are now stretching symmetrically whilst the other 2 are still.
Mini Project
Introduction and Aims
The inert pair effect comes from the increasing stability of lower oxidation states as a group descends. This is especially prominent in group 13 atoms with the Tl(I) oxidation state being much more stable than the the B(I) oxidation state. This is due to the orbitals of the element becoming more diffuse on descending the group causing poorer overlap and hence weaker bonding. The energy released from forming these weak bonds is lower than the energy needed to hydbridise the s orbital to form the +3 oxidation state and so the +1 state is more stable. This thinking was applied to 3 group 2 elements to see whether the stability of the compounds changed due to the poorer overlap.
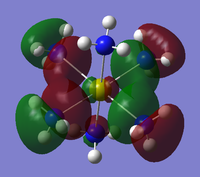
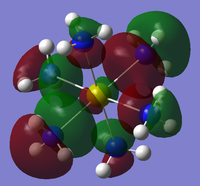
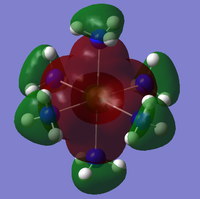
Three hexaammine compounds Ca(NH3)6, Sr(NH3)6 and Ba(NH3)6 were investigated with the stability of the compounds expected to decrease in the order Ca>Sr>Ba. All 3 compounds were optimised and there energies compared to prove this ordering. The stability decreases as there is increasingly poorer overlap of MOs descending group 2 as the metal orbitals become more diffuse. This causes a lengthening of the bond which affects the vibrational frequencies so these were also calculated and compared. The Molecular Orbital of Ca(NH3)6 were calculated to investigate the ionic nature of the compounds. Finally , the Mulliken atomic charges were also calculated for each compound and used to further investigate the the effect.
Optimisation of Energy
The Ca(NH3)6 compound was sketched on GaussView 5.0 and the M-N bond altered to 2.78[11] angstroms and optimised using pseudo potentials. The job type was optimisation, the method B3LYP and the basis set GEN. The following additional keywords were also added: opt(maxcycle=20)pseudo=cards gfinput. The .gjf was edited on wordpad so that the basis set for the metals was LanL2DZ and the basis set for the nitrogens and hydrogens 6-311G. The edited input files were submitted to SCAN (DOI:10042/to-10700 ) and the .log files opened on GaussView 5.0. However, this calculation had a job cpu time of over 13 hours and the error message "CConnectionGLOG::Parse_GLOG()Gaussian error detected Line Number 71989" came up when opened on GaussView 5.0. The forces had converged but the distance had not. The optimisation was therefore repeated again but this time a max cycle of 20 was added as the initial optimisation had run through 150 cycles. The electronic convergence was increased by adding int=ultrafine scf=conver=9 to the additional keywords as well. The file was again edited to add in the pseudo potential information and then submitted to SCAN (Ca(NH3)6 - DOI:10042/to-10727 ). Unfortunately, the convergence of maximum distances was again unsuccessful and opening the .log file produced the same error message as before. Figure 20 below is taken from the .log out put file showing the lack of convergence for the Maximum distances.
 | ||||
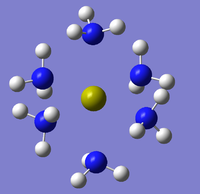
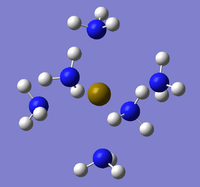
The same method was applied to the other 2 compounds but with the same results (SCAN Sr - DOI:10042/to-10726 and Ba - DOI:10042/to-10739 . Below are these attempted optimised structures in figures 33-35 along with links to Jmols:
 |
 |
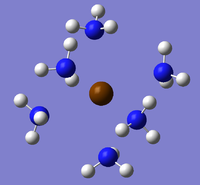 | ||
The Ca(NH3)6 was calculated to be the lowest in energy with -376 a.u which corresponds to -987000 KJmol-1. This was 15750 KJmol-1 lower than the Sr(NH3)6 (-370 a.u, -971250 KJmol-1 which was in turn 13125 KJmol-1 lower than Ba(NH3)6 energy (-365 a.u, -968230 KJmol-1). The energy calculations have an associated error of ≈10 kJmol-1 which shows that there is clear distinction in energy between the three compounds even taking into account errors. All 3 RMS gradients were below the 0.001 limit which suggests that they were optimised.
Geometry
The bond lengths and bond angles of the compounds were measured and compared relative to each other (tables 10-12).
| Bond | Calculated Bond Length (Å) |
|---|---|
| Ca-N | 2.63 |
| N-H | 1.03 |
| Bond angle (o) | Calculated Bond Angle (o) |
| N-Ca-N | 91 & 178 |
| Bond | Calculated Bond Length (Å) |
|---|---|
| Sr-N | 2.81 |
| N-H | 1.03 |
| Bond angle (o) | Calculated Bond Angle (o) |
| N-Sr-N | 91 & 179 |
| Bond | Calculated Bond Length (Å) |
|---|---|
| Ba-N | 3.02 |
| N-H | 1.03 |
| Bond angle (o) | Calculated Bond Angle (o) |
| N-Ba-N | 90 & 179 |
A clear lengthening of the metal-nitrogen can be seen going from Ca (2.63 Å) to Sr (2.81 Å) to Ba(3.02 Å) as expected. As group 2 descends, the orbitals become more diffuse which results in poorer overlap with the Nitrogen orbitals. The Ca orbitals are closest in size and so this bond is the strongest and hence shortest due to significant overlap. The overlap becomes poorer going to Sr and the Ba and so the bond gets weaker and lengthens as seen in the calculations. The N-H bonds were all calculated as 1.03 Å so no difference. However, it might be expected that this bond should shorten on descending the group as more electron density from the nitrogen should be available for bonding due to the poorer overlap with the metal. This was not significant enough to show up though. All of the bond angles are close to the 90o and 180o expected for an octahedral structure. Despite this, the results summary showed the symmetry as C1 which shows that the expected octahedral structure was not adopted.
Vibrational analysis
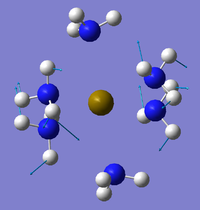
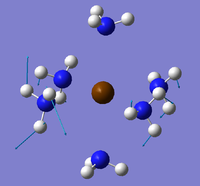
Vibrational frequency analysis was carried out on all 3 compounds after attempted optimisation despite not being fully converged. The vibrational frequencies were calculated using the same method and basis set as for the optimisations but now with job type = freq and opt(maxcycle=20) being removed from the additional keywords. The files were submitted to SCAN (Ca- DOI:10042/to-10733 ,Sr- DOI:10042/to-10734 and Ba- DOI:10042/to-10775 ) and .log files opened on GaussView 5.0. It was found that there were negative frequencies for the Ca(NH3)6, 1 for the Sr(NH3)6 and 3 for the Ba(NH3)6. These negative frequencies are displayed below in table 13:
| Ca(NH3)6 | Sr(NH3)6 | Ba(NH3)6 | |
|---|---|---|---|
| Vibrational mode 1 | 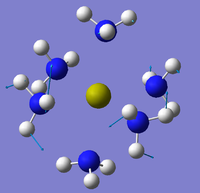 |
 |
|
| Frequency (cm-1) / Intensity | -34 / 0.289 | -28 / 0.178 | -25 / 3.74 |
| Vibrational mode 2 | 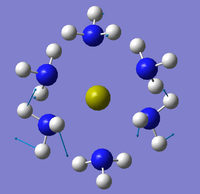 |
N/A | 
|
| Frequency (cm-1) / Intensity | -24 / 0.300 | N/A | -15 /3.52 |
| Vibrational mode 3 | N/A | N/A | 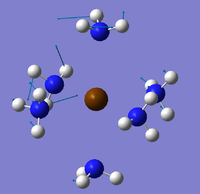
|
| Frequency (cm-1) / Intensity | N/A | N/A | -9 / 10.9 |
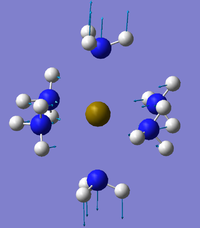
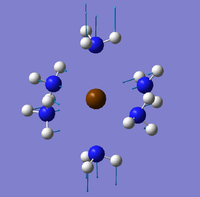
This suggests that the geometries are not fully optimised as there are negative frequencies. However, it can be seen that all of these negative frequencies correspond to various wags of the NH3 groups about the M-N bond. It was seen from the optimisations that the maximum forces had indeed converged just not the maximum distances. This is due to this wobbling of the NH3 groups which are prone to this. The same metal-nitrogen stretch vibrational frequency was found for all 3 compounds shown in table 15 below. Two NH3 groups trans to each other stretch away from the metal centre whilst the rest of the NH3 groups asymmetrically compress towards the metal centre.
| Ca(NH3)6 | Sr(NH3)6 | Ba(NH3)6 | |
|---|---|---|---|
| Form of the Vibration | 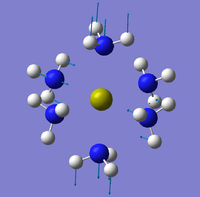 |
 |
|
| Frequency (cm-1) | 205 | 179 | 158 |
| Intensity | 0.603 | 1.41 | 9.03 |
It can be seen that the vibrational frequency decreases from Ca(205 cm-1) to Sr(179 cm-1) to Ba (158 cm-1) confirming that the bond is getting weaker on descending the group. The force constant of the Ca-N bond is higher compared to the other metals shifts the frequency higher. However, the intensity follows the opposite pattern as it increases when descending the group which could also be linked to the force constant.
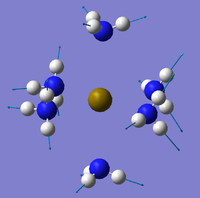
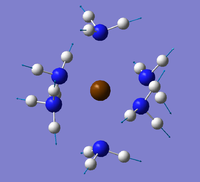
The same symmetric NH3 stretch whereby all N-H bonds are stretching at the same time was also found for all 3 compounds (table 15).
| Ca(NH3)6 | Sr(NH3)6 | Ba(NH3)6 | |
|---|---|---|---|
| Form of the Vibration | 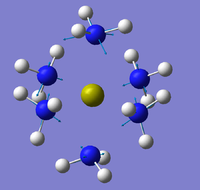 |
 |
|
| Frequency (cm-1) | 3280 | 3297 | 3316 |
| Intensity | 47 | 40 | 2.01 |
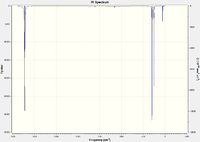
For this vibrational mode, the frequency increases from the Ca(NH3)6 (3280 cm-1) to Sr(NH3)6 (3297 cm-1) up to Ba(NH3)6 (3316 cm-1). This is in agreement with earlier speculation about the N-H bond getting stronger due to more electron density available on the N-H bond. For the Ca(NH3)6, there is good overlap between the Ca and N orbitals so a most of the nitrogen's electron density is in the Ca-N nitrogen bond as opposed to the N-H bonds thereby making the N-H bonds weaker and vibrate at a lower frequency. As the metal-N orbital overlap becomes poorer descending the group more electron density transfers between the N-H bonds thereby making them stronger and vibrate at a higher frequency as seen in the results. Opposite to the M-N intensities there N-H intensities decrease on descending the group which could be again linked to the force constant of the bond or the increasing size of the metal atom.
 |
 |
 | ||
MO Analysis
The optimised molecule was opened on GuassView 5.0 and a new .gjf input file created. The job type was changed to energy but the method and basis set kept the same. However, the max cycle term was taken out of the additional keyword and instead pop=(full,nbo) added instead. The molecule was again edited on wordpad to add in the pseudo potential terms and then submitted to Gaussian. The file processed for roughly 10 minutes before the link dying. It was though that there was not enough memory on the desktop pc to run the job so it was instead submitted to SCAN (DOI:10042/to-10812) . The job took about 3 minutes to run but when the formatted checkpoint file was opened on GaussView 5.0 an error message stated there were not atoms and the file was empty. This was attempted several more times with minor edits to the top of the .log file but to no avail. It was also tried for the Sr and Ba compounds but with the same result.
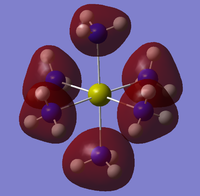
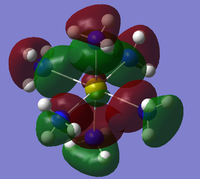
All hope was lost but it was found that on the "optimised" .chk file on GaussView, the MOs could indeed be viewed under the edit heading on the toolbar. Therefore, these MOs were instead analysed with some low lying molecular orbitals shown in table 16.
Unfortunately a lot of the molecular orbitals were asymmetric and of an odd shape so were not very useful. This is obviously due to the fact that the pop=full method was not actually successful and instead the MOs from the optimisation have had to be used. These are no where near as accurate and contain a lot of flaws and glitches. However, the MOs that show significant bonding between the metal calcium and nitrogen are shown below in table 17. 31 is HOMO-4
Due to Calcium's tendency to from ionic compounds, the HOMO-5 to HOMO-3 orbitals could in fact be bonding even though there is no overlap between the metal and nitrogen ligand. This could in fact be more of a ionic electrostatic attraction of opposite charges rather than a covalent bond. If MO analysis was carried out on the Strontium and Barium compounds it would be expected that there would be more MOs with significant overlap of metal orbitals with the nitrogen ligands. This is due to the tendency of the metals to form more covalent compounds as they descend the group as the atoms become more diffuse. This diffuses the charge which makes ionic bonds less likely and covalent bonds the more favoured.
Atomic charge analysis
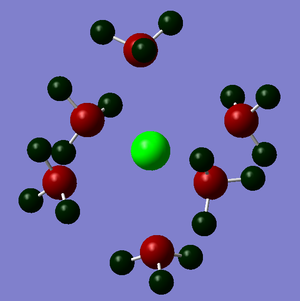
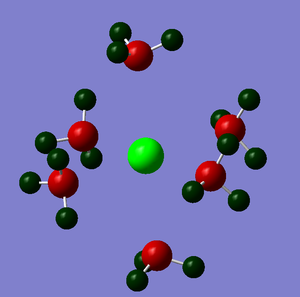
The NBO analysis could not be carried out as the input file containing the pop=nbo term was not successful when submitted to both Gaussian and SCAN (see MO analysis failure). However, the Mulliken atomic charges were analysed taken from the optimised file under the results tab. The 3 compounds are shown below coloured by charge where bright green is highly positive and bright red is highly negative.
 |
 |
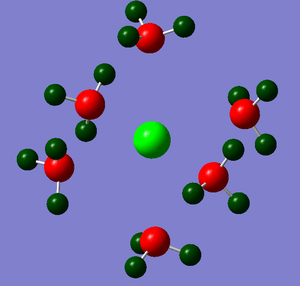 | ||
Table 17 below shows the Mulliken charge density values calculated for the metal, nitrogens and hydrogens for each of the compounds. The average atomic charge was calculated for the nitrogens and hydrogens.
| Atom | Ca(NH3)6 charge (D) | Sr(NH3)6 charge (D) | Ba(NH3)6 charge (D) |
|---|---|---|---|
| Metal | 0.93 | 0.97 | 0.89 |
| Nitrogen | -0.57 | -0.59 | -0.62 |
| Hydrogen | 0.14 | 0.14 | 0.16 |
It can be seen that the averaged atomic charges of the nitrogen atoms became more negative as the group descended from Ca to Ba. The metal atomic charge increased from Ca (0.93 D) to Sr (0.97) but decreased down to Ba(0.89 D). It would have been expected that the charge increase to Ba which suggests a flaw in the optimisation or calculation method.
Conclusion
It was shown through optimisation of geometry that the energy of the compounds decreased as expected on descending the group. It was also shown from measuring the bond lengths that the metal-nitrogen bond became longer when descending the group showing the bond was becoming weaker. This was supported through frequency analysis which showed that the metal-nitrogen bond with the highest frequency was in the calcium compound and the lowest in the barium compound. This showed that the strongest bond was in the calcium compound and the weakest in the barium. The N-H bond was also shown to become stronger on descending thre group due to more electron density contributed to the bond from the nitrogen. The MO analysis was not very useful due to the failure of the .input files but some bonding MOs were analysed. Although the NBO analysis was not able to be carried out, the Mulliken atomic charges were looked at. However, these was only a pattern for the nitrogens with the metal charges increasing and then descreasing going from Ca to Sr to Ba.
References and Citations
- ↑ R. Konecny et al., J. Phys. Chem. B, 1997, 101 (51), 10983–10985
- ↑ 2.0 2.1 http://www.huntresearchgroup.org.uk/teaching/teaching_comp_lab_year3/3b_understand_opt.html
- ↑ http://www.huntresearchgroup.org.uk/teaching/teaching_MOs_year2/L4_Tut_MO_diagram_BH3.pdf
- ↑ P. Meier, M. Neff, and G. Rauhut, J. Chem. Theory Comput., 2011, 7, 148
- ↑ J Blixt et al. J. Am. Chem. Soc., 1995, 117, (18), 5089
- ↑ D. Davies and D. A. Long, J. Chem. Soc. A, 1968, 2050
- ↑ 7.0 7.1 7.2 G. Hogarth and T. Norman, Inorganica Chimica Acta, 1977, 254, 167-171
- ↑ 8.0 8.1 F. A. Cotton et al., Inorg. Chem., 1982, 21, 294-299
- ↑ D. J. Darensbourg, R. L. Kump, Inorg. Chem., 1978, 17, 2680-2681.
- ↑ F. A. Cotton, J. Inorg. Chem., 1964, 3, 702-711
- ↑ F. Lerclerco et al., J. Phys. Chem., 1984, 88 (17), 3886–3890

