Rep:Mod:Stella
Molecular Modelling 2
NH3 molecule
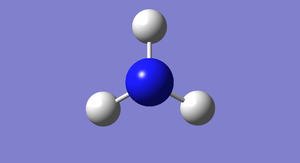
A computational analysis was performed on NH3 molecule with Gaussian calculation. The following table presents the information upon the completion of optimization and frequency analysis.
| Structure | ||
|---|---|---|
| ||
| Information | ||
| Molecule | NH3 | |
| Calculation Method | RB3LYP | |
| Basis Set | 6-31G(d,p) | |
| Final Energy E(RB3LYP) (a.u.) | -56.55776873 | |
| RMS gradient (Hartree/Bohr) | 0.00000485 | |
| Point Group | C3v | |
Completion of the Gaussian optimization process was ensured by checking with the Gaussian generated output data. The following table illustrates the results.
Item                        Value      Threshold    Converged?

 Maximum Force            0.000004     0.000450     YES

 RMS     Force            0.000004     0.000300     YES

 Maximum Displacement     0.000072     0.001800     YES

 RMS     Displacement     0.000035     0.001200     YES

Predicted change in
Energy=-5.986255D-10

Optimization completed.

-- Stationary point found.
Since the values of the maximum force, RMS force, maximum displacement and RMS displacement were below their respective threshold values, it can be determined that for the optimized structure of NH3 molecule, the Gaussian calculation process was complete.
Subsequently, the bond length of the optimized CH4 molecule was calculated, which yielded a value of 1.09197Å. The H-C-H bond angle calculated was 109.471° and the torsion angle was 120°.
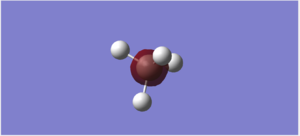
3D Structure
NH3 molecule |
Charge Distribution
Calculation of charge distribution of NH3 molecule was then performed following the optimization and frequency analysis. The diagram shows its charge distribution. The atoms are coloured according to the charge distribution.
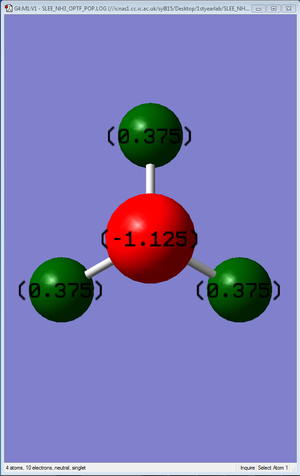
Interestingly, the charges of the Nitrogen atom is -1.125, and each Hydrogen atom, +0.375, as calculated by Gaussian. This differed from the expected values of -3 for the Nitrogen atom and +1 for each Hydrogen atom. A possible reason could be because the expected values are calculated based on the classical model, whereas the Gaussian calculations were performed using quantum mechanical calculations.
Vibrational and IR Analysis
Vibrational and IR analysis was subsequently performed on the final optimized structure of NH3 molecule. The following diagram summarizes the results obtained after the analysis.
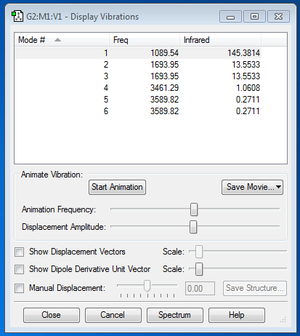
| How many modes do you expect from the 3N-6 rule? | 6 |
| Which modes are degenerate (i.e. have the same energy)? | Modes 2 and 3 Modes 5 and 6 |
| Which modes are "bending" vibrations and which are "bond stretch" vibrations? | “Bond stretch” vibrations: modes 4, 5 and 6 “Bending” vibrations: modes 1, 2 and 3 |
| “Bending” vibrations | modes 1, 2 and 3 |
| Which mode is highly symmetric? | Mode 4 |
| One mode is known as the "umbrella" mode, which one is this? | Mode 1 |
| How many bands would you expect to see in an experimental spectrum of gaseous ammonia? | 2 |
The following diagram presents the computationally calculated IR spectrum data for NH3 molecule.
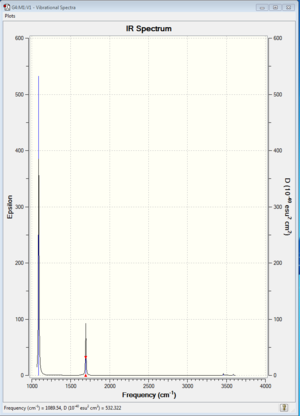
Prominent peaks were observed for mode 1 and modes 2 and 3, where the peaks for modes 2 and 3 could not be distinguished from each other due to the similarities in frequencies (1693.95 cm-1).
N2 molecule
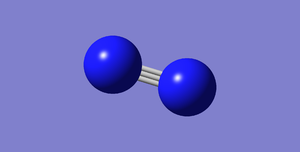
A computational analysis was performed on N2 molecule with Gaussian calculation. The following table presents the information upon the completion of optimization and frequency analysis.
| Structure | ||
|---|---|---|
| ||
| Information | ||
| Molecule | N2 | |
| Calculation Method | RB3LYP | |
| Basis Set | 6-31G(d,p) | |
| Final Energy E(RB3LYP) (a.u.) | -109.52412868 | |
| RMS gradient (Hartree/Bohr) | 0.00000060 | |
| Point Group | D*H | |
Completion of the Gaussian optimization process was ensured by checking with the Gaussian generated output data. The following table illustrates the results.
         Item               Value     Threshold  Converged?
 Maximum Force            0.000001     0.000450     YES
 RMS     Force            0.000001     0.000300     YES
 Maximum Displacement     0.000000     0.001800     YES
 RMS     Displacement     0.000000     0.001200     YES
 Predicted change in Energy=-3.401025D-13
 Optimization completed.
    -- Stationary point found.
Since the values of the maximum and RMS forces were below their respective threshold values, it can be determined that for the optimized structure of N2 molecule, the Gaussian calculation process was complete.
3D Structure
N2 molecule |
Vibrational and IR Analysis
Vibrational and IR analysis was subsequently performed on the final optimized structure of N2 molecule. The following diagram summarizes the results obtained after the analysis.

H2 molecule
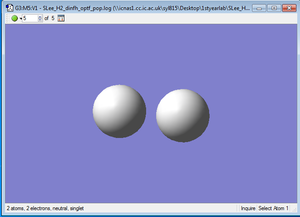
A computational analysis was performed on H2 molecule with Gaussian calculation. The following table presents the information upon the completion of optimization and frequency analysis.
| Structure | ||
|---|---|---|
| ||
| Information | ||
| Molecule | H2 | |
| Calculation Method | RB3LYP | |
| Basis Set | 6-31G(d,p) | |
| Final Energy E(RB3LYP) (a.u.) | -1.17853936 | |
| RMS gradient (Hartree/Bohr) | 0.00000017 | |
| Point Group | D*H | |
Completion of the Gaussian optimization process was ensured by checking with the Gaussian generated output data. The following table illustrates the results.
         Item               Value     Threshold  Converged?
 Maximum Force            0.000000     0.000450     YES
 RMS     Force            0.000000     0.000300     YES
 Maximum Displacement     0.000000     0.001800     YES
 RMS     Displacement     0.000001     0.001200     YES
 Predicted change in Energy=-1.164080D-13
 Optimization completed.
    -- Stationary point found.
Since the values of the maximum and RMS forces were below their respective threshold values, it can be determined that for the optimized structure of H2 molecule, the Gaussian calculation process was complete.
3D Structure
H2 molecule |
File:SLEE H2 DINFH OPTF POP.LOG
Vibrational and IR Analysis
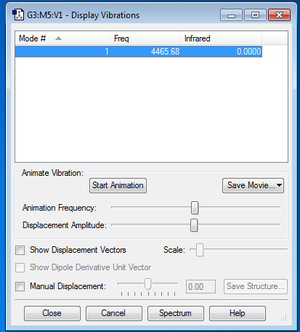
Vibrational and IR analysis was subsequently performed on the final optimized structure of H2 molecule. The following diagram summarizes the results obtained after the analysis.
Haber-Bosch reaction energy calculation
E(NH3)= -56.55776873 a.u.
2*E(NH3)= -113.11553746 a.u.
E(N2)= -109.52412868 a.u.
E(H2)= -1.17853936 a.u.
3*E(H2)= -3.53561808 a.u.
ΔE=2*E(NH3)-[E(N2)+3*E(H2)]= -0.05579070 a.u.= -146.47 kJ/mol
Since the total enthalpy change calculated was a negative value, this indicated that the Ammonia product is more stable.
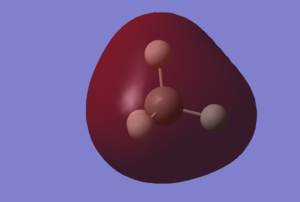
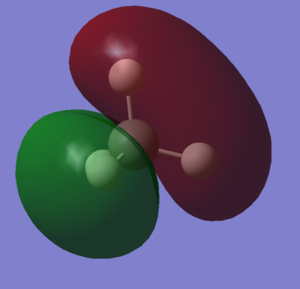
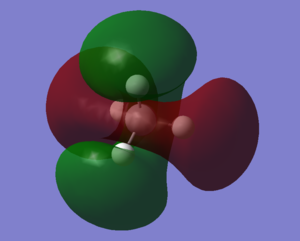
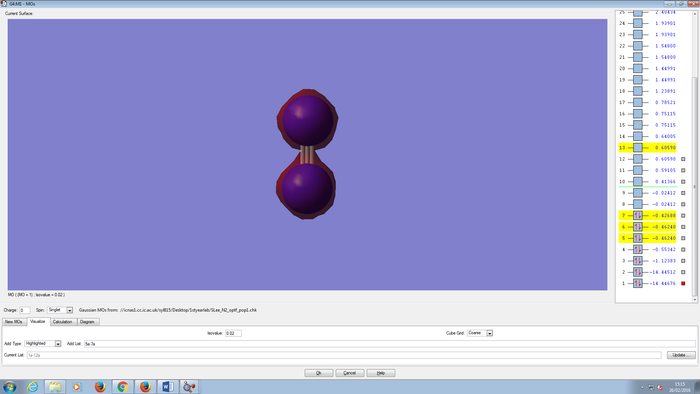
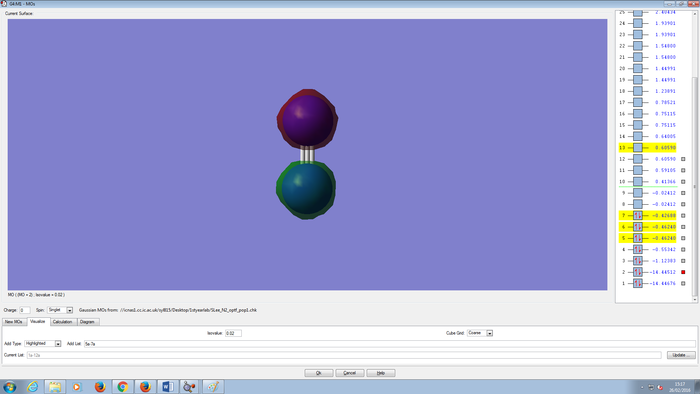
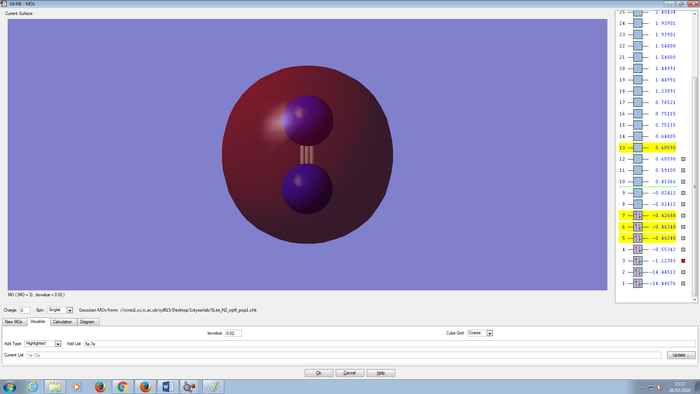
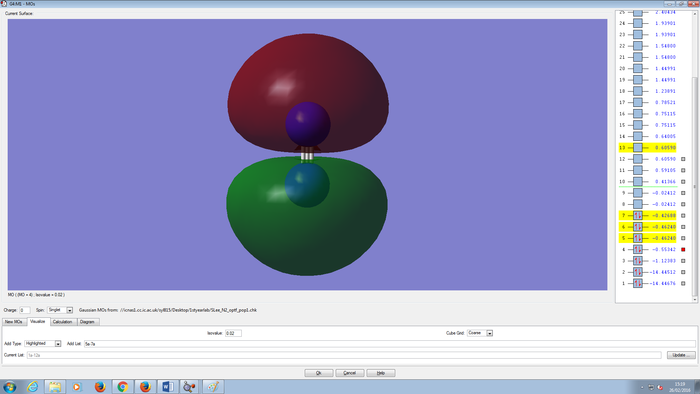
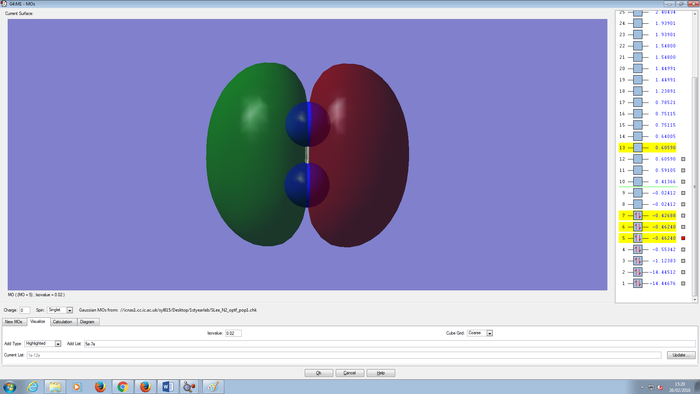
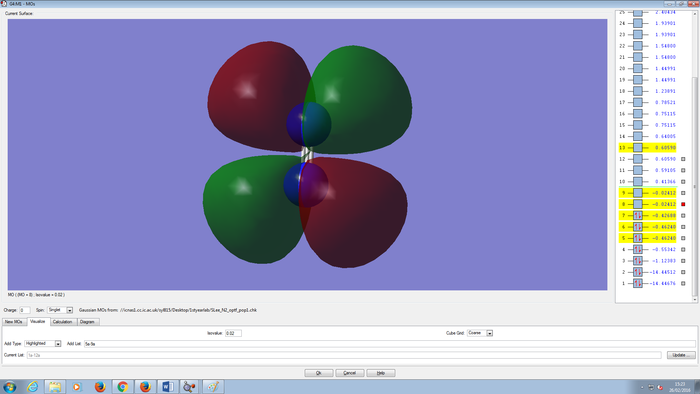
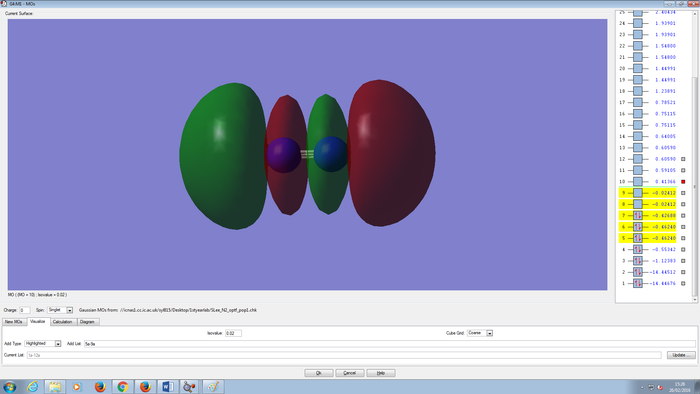
Molecular Orbitals Of N2 molecule

CH4 molecule
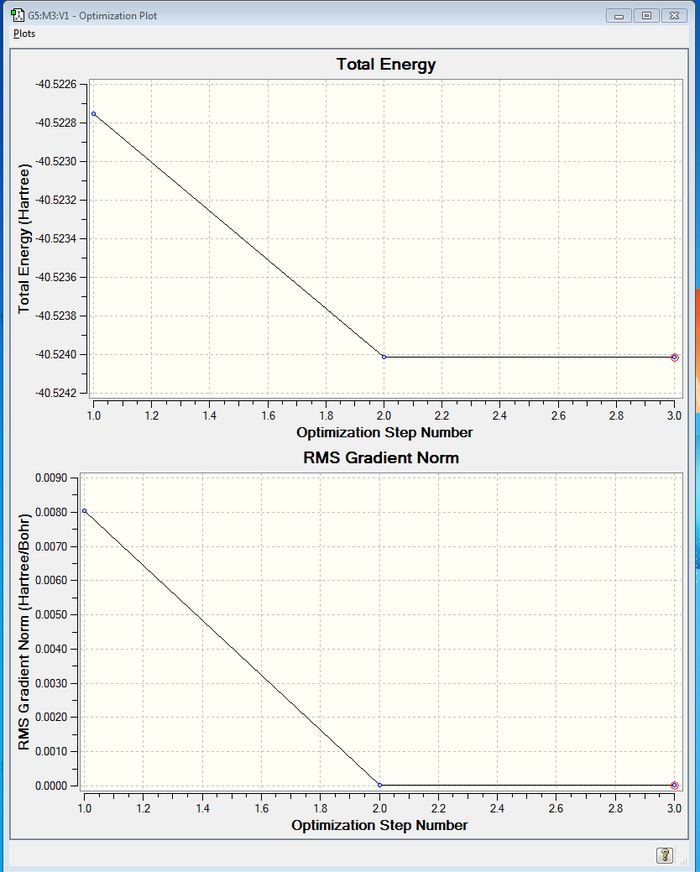
A computational analysis was performed on CH4 molecule with Gaussian calculation. 3 optimization steps were performed on the CH4 molecule, and the graph below illustrates the total energy and the RMS Gradient Norm of the CH4 molecule for each step.
The following table presents the information upon the completion of optimization and frequency analysis.
| Structure | ||
|---|---|---|
| ||
| Information | ||
| Molecule | CH4 | |
| Calculation Method | RB3LYP | |
| Basis Set | 6-31G(d,p) | |
| Final Energy E(RB3LYP) (a.u.) | -40.52401404 | |
| RMS gradient (Hartree/Bohr) | 0.00003263 | |
| Point Group | TD | |
Completion of the Gaussian optimization process was ensured by checking with the Gaussian generated output data. The following table illustrates the results.
         Item               Value     Threshold  Converged?
 Maximum Force            0.000063     0.000450     YES
 RMS     Force            0.000034     0.000300     YES
 Maximum Displacement     0.000179     0.001800     YES
 RMS     Displacement     0.000095     0.001200     YES
 Predicted change in Energy=-2.256043D-08
 Optimization completed.
    -- Stationary point found.
Since the values of the maximum force, RMS force, maximum displacement and RMS displacement were below their respective threshold values, it can be determined that for the optimized structure of CH4 molecule, the Gaussian calculation process was completed.
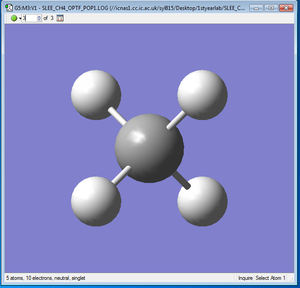
3D Structure
CH4 molecule |
Charge Distribution
Calculation of charge distribution of CH4 molecule was then performed following the optimization and frequency analysis. The diagram shows its charge distribution. The atoms are coloured according to the charge distribution.
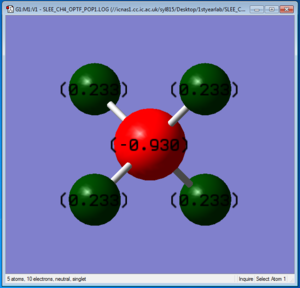
The charge of the Carbon atom found was -0.930, and each Hydrogen atom, +0.233, as calculated by Gaussian. This differed from the expected values of -4 for the Carbon atom and +1 for each Hydrogen atom. A possible reason could be because the expected values are calculated based on the classical model, where charges were assigned to each type of atom. However, the actual values yielded by the Gaussian calculations were performed using quantum mechanical calculations, such that the electron density for each atom was redistributed in order to obtain the most optimized structure of CH4.
Vibrational and IR Analysis
Vibrational and IR analysis was subsequently performed on the final optimized structure of CH4 molecule. The following diagram summarizes the results obtained after the analysis.
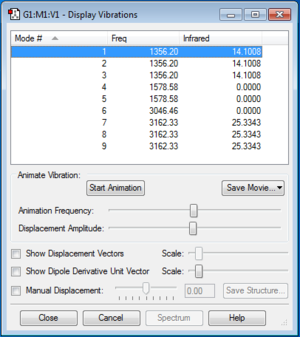
| How many modes do you expect from the 3N-6 rule? | 9 |
| Which modes are degenerate (i.e. have the same energy)? | Modes 1, 2 and 3 are degenerate. Modes 4 and 5 are degenerate. Modes 7, 8 and 9 are degenerate. |
| Which modes are "bending" vibrations and which are "bond stretch" vibrations? |
“Bond stretch” vibrations: modes 6, 7, 8 and 9 |
| “Bending” vibrations | modes 1, 2 and 3 |
| Which mode is highly symmetric? | Mode 6 |
| How many bands would you expect to see in an experimental spectrum of gaseous methane? | 2 |
The following diagram presents the computationally calculated IR spectrum data for CH4 molecule.
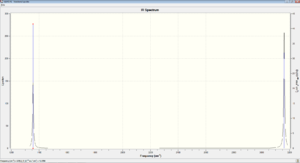
A prominent peak was observed for modes 1,2 and 3 which were indistinct on the IR Spectrum plot due to the similarities in frequency. Another prominent peak was observed for modes 7, 8 and 9, and similarly they could not be distinguished from each other due to the similarities in frequencies.

