Rep:Mod:Stassen14inorg
BH3, BBr3, GaBr3 comparison
Comparison of three trigonal planar molecules with varying size atoms, using a 6-21g (d,p)basis set at B3LYP level computations, to compare optimized bond lengths, angles and vibrational spectra.
BH3 analysis
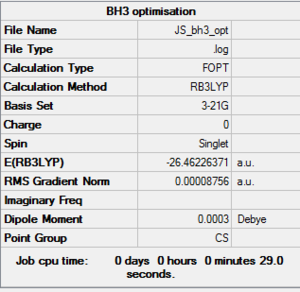
BH3 3-21g optimization
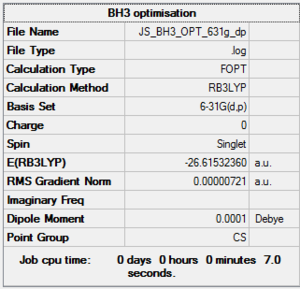
Optimisation log file here
BH3 6-31g optimization
Optimisation log file here
| summary data | convergence | Jmol | Bond length and Angle | |||
|---|---|---|---|---|---|---|
|
         Item              Value      Threshold  Converged?
 Maximum Force            0.000012     0.000450     YES
 RMS     Force            0.000008     0.000300     YES
 Maximum Displacement     0.000064     0.001800     YES
 RMS     Displacement     0.000039     0.001200     YES
|
|
B-H length: 1.19Å H-B-H angle: 120.0° |
B3LYP/LAN2DZ GaBr3 optimisation
Optimisation log file here
| summary data | convergence | Jmol | Bond length and Angle | |||
|---|---|---|---|---|---|---|

|
         Item              Value      Threshold  Converged?
 Maximum Force            0.000000     0.000450     YES
 RMS     Force            0.000000     0.000300     YES
 Maximum Displacement     0.000003     0.001800     YES
 RMS     Displacement     0.000002     0.001200     YES
|
|
Ga-Br length: 2.35Å Br-Ga-Br angle: 120.0° |
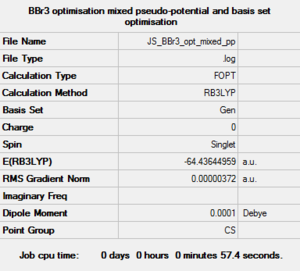
BBr3 6-31g optimization
Optimisation log file here
| summary data | convergence | Jmol | Bond length and Angle | |||
|---|---|---|---|---|---|---|
|
         Item              Value      Threshold  Converged?
 Maximum Force            0.000008     0.000450     YES
 RMS     Force            0.000005     0.000300     YES
 Maximum Displacement     0.000035     0.001800     YES
 RMS     Displacement     0.000023     0.001200     YES
|
|
B-H length: 1.93Å H-B-H angle: 120.0° |
Comparison of Geometry
| BH3 | GaBr3 | BBr3 | |
|---|---|---|---|
| r(E-X) Å | 1.19 | 2.35 | 1.93 |
| θ(X-E-X) degrees (º) | 120.0 | 120.0 | 120.0 |
Bond distances between atoms are dependant on the nature and size of atoms, as well as their relative size. Bond distances can be a good indication of the strength of a bond. It is widely known that only orbitals of similar energy, size and symmetry can interact to form bonds. As an atom increases in size its valence orbitals that are active in bonding become larger and hence more diffuse. This means that we would expect to see a decrease in overlap and hence a weaker and longer bond. The optimized structures of the three trigonal planar molecules support this by showing the exact same trend. By first looking at the E-X bond distances in each of the molecules the trend seems to be that as the constituent atoms increase in size the bond distance increases. By looking at the orbitals involved in bonding, there seems to be a correlation. Due to the dense and small nature of the 1s orbital contributions from hydrogen and boron it is expected for the bond to be short on the other side of the spectrum the orbitals involved in bonding between Ga and Br are larger and predict a longer bond distance. As the center atom as well as the ligands get larger their valence orbital-which are involved in bonding- become larger and more diffuse hence giving an increase in the length and decrease in strength of the bond, as overlap decreases.
In order to individually compare the effect of changing the ligand BH3 and BBr3 are compared.
upon only changing the ligand from a smaller atom H to Br, the bond distance increases from 1.19A to 1.93A. Assuming that the bond between the two atoms is a sigma bond between two S orbitals of each of the atoms, this trend can be explained by the fact that bromine has much more diffuse and larger orbitals leading to a weaker bond. It has to be noted that Bromine has valence electrons in p orbitals which are aligned with borons empty p-orbital and pi backbonding may take place, this could increase bond strength and lower the bond distance. Hydrogen does not have any other valence electrons to perform pi backbonding and hence pure sigma interactions cannot be fairly compared.
To compare the effect of changing the central atom BBr3 and GaBr3 are compared
Ga and Br are in the same period of the periodic table this would indicate they are of similar size and hence should have a good overlap between bonding orbitals compared to B which is much smaller, but on the other hand Ga's orbital will be much more diffuse compared to B. It is difficult to compare the trade off between orbital size matching and the level of diffusion of orbitals. Both B and Ga are in the same group in the periodic table, they have similar characteristics as they are both able to accept electrons in their vacant p orbitals, making them lewis acids. Due to the fact that Ga is further down the periodic table it has much larger and diffuse orbitals and is therefore a worse acceptor. As Br is known to be a pi donating ligand, it readily pi back-bonds if there is a relevant orbital available, due to Borons high lewis acidity, it is more able to engage in pi backboding from the Br ligand, this might be the reason why the bond distance between B and Br is lower compared to Ga and Br.
What is a bond?
A bond is the resulting interaction from two atoms existing in the right orientation to enter a potential energy well. When two atoms are a certain distance apart, a result of electrostatic interactions can cause two or more atoms to enter a lower energy state compared to the summed energy of the individual substituents. A bond shows the equilibrium distance, and lowest energy state. Atoms all have certain amounts of electrons which all have associated wave functions, by solving the Schrodinger equation gaussian can interpret the wave functions as atomic orbitals, which can the be used in combination with other atomic orbitals to form molecular orbitals. Linear combination of atomic orbitals can be used to to form molecular orbitals manually but gaussian provides a much more sophisticated way of generating molecular orbitals for atom combinations which in turn depict bonding. bonds can be of different lengths depending on the atoms, and can also vary in strength. The strength of the bonds is measured in terms of energy, a stronger bond creates a more stable molecule individual atoms compared to a weak bond. Usually weak bonds such as the I-I bond in diatomic I2 are of the order of 152 kJmol-1 [1] l , medium bonding such as a single carbon-carbon bond can be around 350kJmol-1 [2] where as diatomic nitrogen which is believe to be triply bonded has a bond energy of 945 kJmol-1 [3]. Gaussview has predetermined arbitrary criteria distances between atoms which would cause it to show no bond, a single, double or triple bond, hence this might not always depict the right bond order, as calculations and atoms vary.
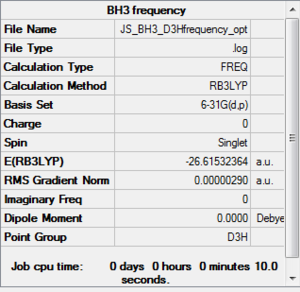
BH3 B3LYP 6-31G(d,p) Frequency
Frequency file: here
| summary data | low modes |
|---|---|
|
Low frequencies --- -12.4451 -12.4386 -7.8187 -0.0012 0.0234 0.4030 Low frequencies --- 1162.9687 1213.1351 1213.1353 |
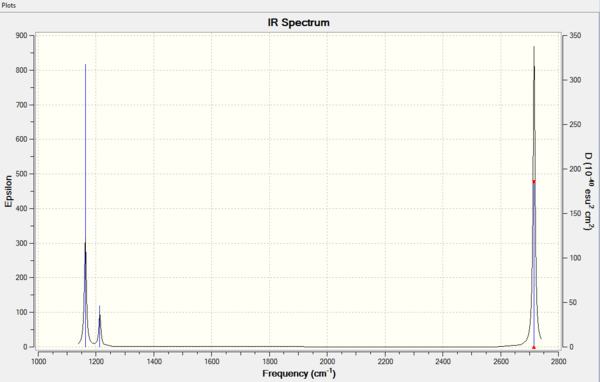
Vibrational spectrum for BH3
| wavenumber | Intensity | IR active? | type |
| 1163 | 93 | yes | bend |
| 1213 | 14 | slightly | bend |
| 1213 | 14 | slightly | bend |
| 2583 | 0 | no | stretch |
| 2716 | 126 | yes | stretch |
| 2716 | 126 | yes | stretch |
There are only 3 peaks on the IR spectrum, whereas there are 6 vibrational modes calculated from the 3N-6 rule applied to BH3 which is 4 atoms. The peak at 1163cm-1 corresponds to a bend, the smaller peak at 1213cm-1 corresponds to two degenerate vibrational bends which both overlap on the spectrum to give a single peak. Lastly there is one peak at 2716cm-1, this also corresponds to two degenerate vibrational stretches which both overlap to show one peak of higher intensity. the vibration mode at 2583cm-1 which corresponds to a stretch is not IR active, the three stretches are all simulateous and do not cause a change in dipole of the molecule this causes it to have 0 intensity and hence does not show a peak.
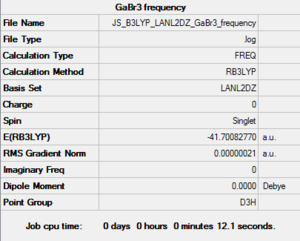
B3LYP/LANL2DZ GaBr3 frequency
DOI:10042/195232 Frequency file: here
| summary data | low modes |
|---|---|
|
 Low frequencies ---  -1.4878   -0.0015   -0.0002    0.0096    0.6540    0.6540
    0.0234    0.4030
 Low frequencies --- 76.3920   76.3924   99.6767
|
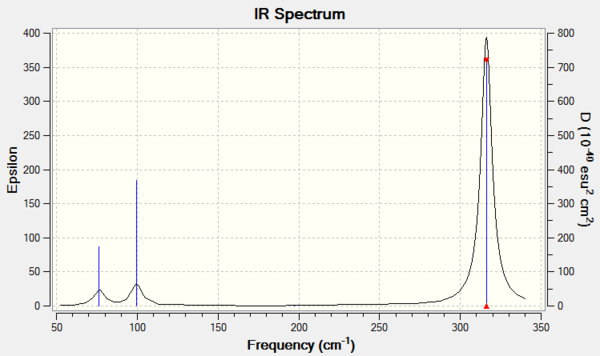
Vibrational spectrum for GaBr3
| wavenumber | Intensity | IR active? | type |
| 76.39 | 3 | slightly | bend |
| 76.39 | 3 | slightly | bend |
| 99.68 | 9 | slightly | bend |
| 197.3 | 0 | no | stretch |
| 316.2 | 57 | yes | stretch |
| 316.2 | 57 | yes | stretch |
Comparison of the two Vibrational Spectra
The vibrational spectra for BH3 and GaBr3 can be compared, as the both molecules were computed to the same level of accuracy and symmetry, this allows us to test variable of changing the atoms versus the molecular vibrations and their energies. The frequencies under which the BH3 molecule is active is between 1000cm-1 and 3000cm-1, compared to the 50cm-1 and 400cm-1 range for GaBr3. A wavenumber is the spatial frequency of a wave and is directly proportional to its energy. This large difference in range of signals in the IR spectra shows that BH3 is more active in the higher energy range compared to the GaBr3. As these electromagnetic waves directly probe various stretching and bending modes, they are related to the energy and there for also strength and distance of the bonds in the molecule. Similarly to what we saw earlier with the bond distance comparison between BH3 and GaBr3 this difference in energy of vibrational modes further supports this.
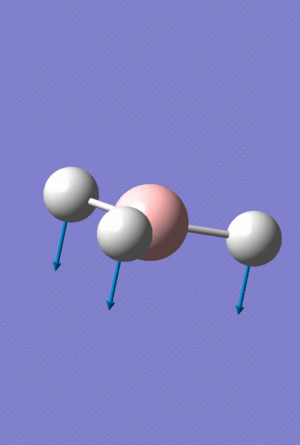
A Gaussview image of Umbrella vibrational mode for BH3 at 1163cm-1
A Gaussview image of Umbrella vibrational mode for GaBr3 at 76cm-1
For the BH3 the displacement vectors are all on the hydrogen molecules, with the almost stationary boron atom in the middle barely moving. The GaBr3 molecule has inverted displacement vectors, with the central atom Ga moving a lot more compared to the the three ligand Br atoms in the umbrella vibrational mode, a gif of this vibration can be seen above. The bending mode causes the lighter elements to move more compared to the heavier elements, the light hydrogen atoms all have a much larger displacement vector than compared to the boron, the Ga atom is lighter compared to the Bromine and hence moves more compared to the ligands.
Why must you use the same method and basis set for both the optimization and frequency analysis calculations?
keeping the same method and basis set for both the optimisation and frequency allows one to check whether the optimization has in fact reached a minimum energy point. A change in basis set or method may change the energy and hence may also provide non-relavant frequency calculations to confirm whether or not the minimum energy configuration of the molecule was indeed calculated using the optimization calculation. in some cases the optimized structure may reach a stationary point that is not the overall minimum, if a frequency calculation with the same method and basis set is then computed, it will show that this is in fact not the lowest energy configuration, but another minimum. Negative, imaginary frequencies will also immediately indicate a transition state or high energy structure that is not desired in this experiment. Low frequencies obtained from the frequency calculation show distortions to the optimized molecule, having low low frequencies means that the structure is an accurate representation of the optimized molecule. Throughout this experiment, all low frequencies will be with the range of +-15cm-1.
BBr3 optimized MO
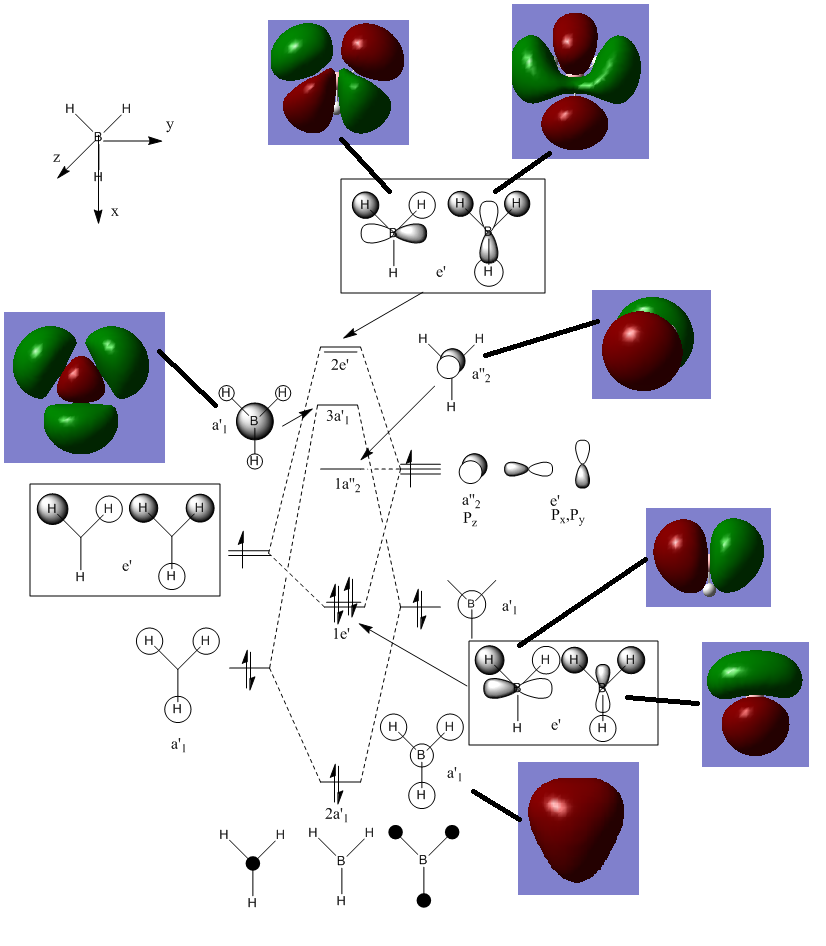
In the diagram below the molecular orbitals obtained manually using a linear combination of atomic orbitals was compared with computed results for molecular orbitals for the BH3 molecule.
Answer the following questions:
Somethings are neglected in the diagram such as orbital size and contribution, the relative sizes of orbitals in the LCAO diagram should not be taken to be accurate.
the computed MOS are generally in the same location as the LCAO diagram, they do however show much greater detail in the sizes and shapes of the molecular orbitals formed. The qualitative LCAO is useful in approximating the positions of certain nodal planes as well as the relative positions and orientations of electron density, however they fail to show how two atomic orbitals combine and how much they overlap. Furthermore upon analysis of less symmetrical molecules, qualitative MO analysis will play a much bigger role in larger molecules. As symmetry labels will not extend beyond a certain level of symmetry only a small range of molecules falls in this category that LCAO can realistically be applied to.
NH3BH3 investigation
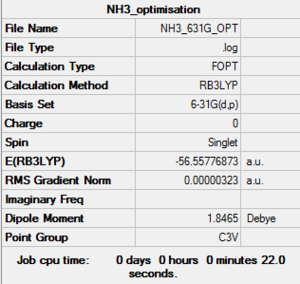
NH3 6-31g optimization
the predetermined point group of C3V was set for this optimizaed to a very tight constraint. Optimisation log file here
| summary data | convergence | Jmol | Bond length and Angle | |||
|---|---|---|---|---|---|---|
|
         Item              Value      Threshold  Converged?
 Maximum Force            0.000006     0.000450     YES
 RMS     Force            0.000004     0.000300     YES
 Maximum Displacement     0.000012     0.001800     YES
 RMS     Displacement     0.000008     0.001200     YES
|
|
N-H length: 1.02Å H-N-H angle: 105.7° |
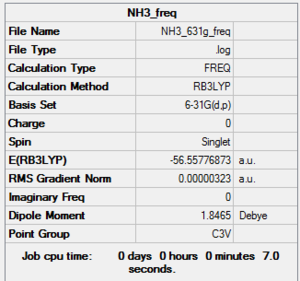
RB3LYP NH33 frequency
Frequency file: here
| summary data | low modes |
|---|---|
|
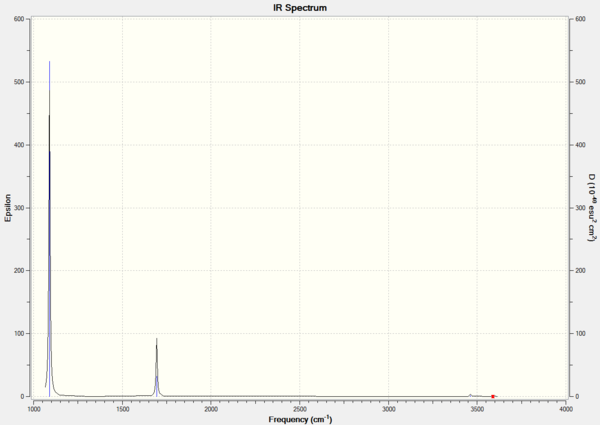
Low frequencies --- -0.0128 -0.0021 0.0017 7.0724 8.1020 8.1023 Low frequencies --- 1089.3849 1693.9369 1693.9369 |
Vibrational spectrum for NH3
| wavenumber | Intensity | IR active? | type |
| 1089 | 145 | yes | bend |
| 1694 | 14 | slightly | bend |
| 1694 | 14 | slightly | bend |
| 3461 | 1 | no | stretch |
| 3590 | 0 | no | stretch |
| 3590 | 0 | no | stretch |
NBO analysis
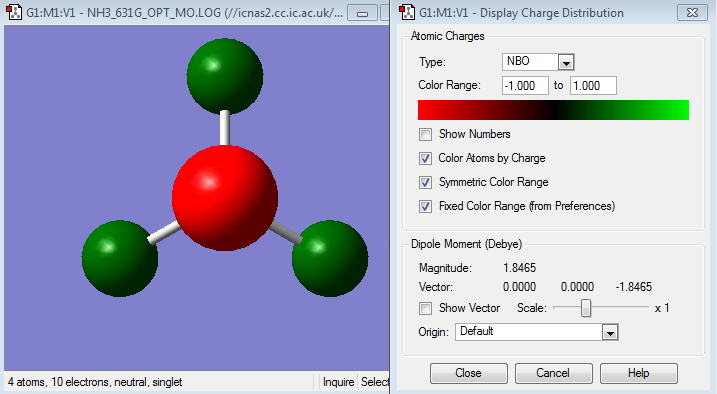
shows the charge distribution of the NH3 molecule, where the red indicates the negative charge on the electronegative nitrogen atom and the green as positive charge on the hydrogen atoms as expected, the color indicator is fixed to a range of +1.00 to -1.00. With each hydrogen having a charge number of 0.375 and the nitrogen having a charge number of -1.125eV.
BH3NH33
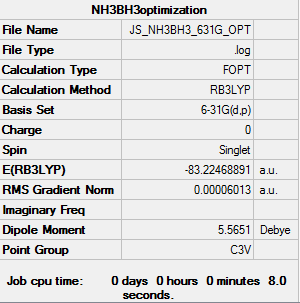
RB3LYP 6-31G(d,p) BH3NH3 Optimization
Log file: here
| summary data | convergence | Jmol | Bond length and Angle | |||
|---|---|---|---|---|---|---|
|
         Item              Value      Threshold  Converged?
 Maximum Force            0.000122     0.000450     YES
 RMS     Force            0.000058     0.000300     YES
 Maximum Displacement     0.000513     0.001800     YES
 RMS     Displacement     0.000296     0.001200     YES
|
|
B-H length: 1.12Å N-H length: 1.02Å B-N length: 1.67Å H-N-H angle:107.7° H-B-H angle: 113.9° |
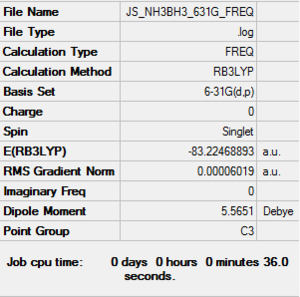
RB3LYP BH3NH3 frequency
Frequency file: here
| summary data | low modes |
|---|---|
|
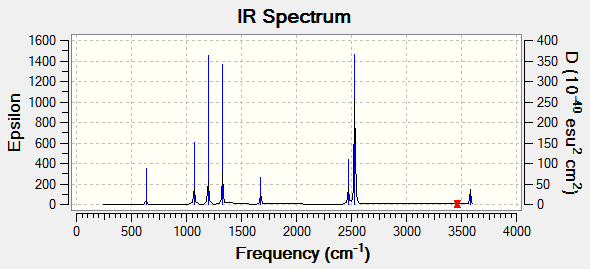
Low frequencies --- -0.0008 0.0006 0.0008 16.9814 17.2565 37.2620 Low frequencies --- 265.8828 632.2123 639.3451 |
Vibrational spectrum for BH3NH3
| wavenumber | Intensity | IR active? | type |
| 265 | 0 | no | bend |
| 632 | 14 | slightly | stretch |
| 639 | 4 | slightly | bend |
| 639 | 4 | slightly | bend |
| 1069 | 40 | yes | bend |
| 1069 | 40 | yes | bend |
| 1196 | 109 | yes | bend |
| 1204 | 4 | slightly | bend |
| 1204 | 4 | slightly | bend |
| 1329 | 113 | yes | bend |
| 1676 | 28 | yes | bend |
| 1676 | 28 | yes | bend |
| 2470 | 67 | yes | stretch |
| 2530 | 231 | yes | stretch |
| 2530 | 231 | yes | stretch |
| 3463 | 2.5 | no | stretch |
| 3580 | 28 | yes | stretch |
| 3580 | 28 | yes | stretch |
as expected using the 3n-6 vibrational modes rule there are 18 vibrations for this molecule with 8 atoms. There are 6 pairs of degenerate vibrational modes which would only show up as one peak on the computed IR spectrum, as well as 3 modes which do not have a change in overall dipole of the molecule and hence result in a 0 intensity non IR-active mode.
Energy
E(NH3)= -56.55776873a.u.
E(BH3)= -26.61532360a.u.
E(NH3BH3)= -83.22468893a.u.
ΔE=E(NH3BH3)-[E(NH3)+E(BH3)]
ΔE=-0.0515966a.u. = -135kJ/mol
The energy required to break this bond(disassociation energy) is 135kJ/mol, with reference to the arbitrary scale of bond strength discussed earlier, this bond is considered weak and close to energy and strength of a diatomic I-I bond.
Aromaticity Project
Benzene reference molecule
In the previous section it was seen how different atoms in the same molecular structure can change bond lengths and angles as their infrared activity. In this project isoelectronic structure consistent of different atoms are compared. They are fairly assessed as all four structures; benzene, boratabenzene, pyridinium and borazine are all optimized at 6-31g(d,p) level using the B3LYP method and confirmed using frequency analysis with low frequencies within the range of +-15cm-1. This also allows for fair NBO analysis and detailed comparison of 3 specific molecular orbitals for each of the 4 isoelectronic molecules.
Benzene is widely known to be aromatic, it has a planar structure with 6 P orbitals perpendicular to the ring which can interact. Huckels theory states that for a molecule to benefit from aromatic stabilization energy the molecule must be planar and cyclic. In addition the conjugated p-orbital cloud must contain 4n+2 electrons where n is an integer, and each atom in the ring has to be able to participate. Benzene fits all these criteria well as it is a symmetric planar ring with 6 even carbons atoms all contributing evenly to the aromatic system. Upon addition of heteroatoms such as nitrogen and boron the symmetry and some of these criteria will be tested. Optimization calculations will allow for the structure to be optimized, NBO charge analysis and molecular orbital analysis will show the contribution of each of the molecules in the ring. It is predicted that the hetero atoms will distort the molecular orbitals due to uneven charge distribution.
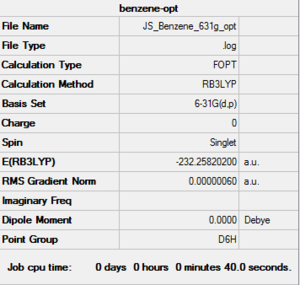
RB3LYP 6-31G(d,p) Benzene Optimization
Log file: here
| summary data | convergence | Jmol | Bond length and Angle | |||
|---|---|---|---|---|---|---|
|
         Item              Value      Threshold  Converged?
 Maximum Force            0.000001     0.000015     YES
 RMS     Force            0.000000     0.000010     YES
 Maximum Displacement     0.000002     0.000060     YES
 RMS     Displacement     0.000001     0.000040     YES
|
|
C-H length: 1.09Å C-C length: 1.40Å C-C-C angle:120.0° H-C-C-H angle: 0.0° |
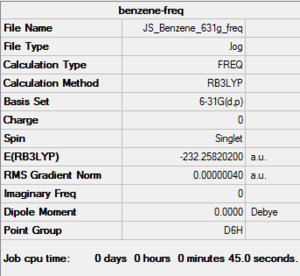
RB3LYP Benzene frequency
Frequency file: here
| summary data | low modes |
|---|---|
|
Low frequencies --- -10.2549 -5.6651 -5.6651 -0.0055 -0.0054 0.0006 Low frequencies --- 414.5451 414.5451 621.0429 |
Vibrational spectrum for Benzene
| wavenumber | Intensity | IR active? | type |
| 416 | 0 | No | Bend |
| 416 | 0 | No | Bend |
| 621 | 0 | No | Bend |
| 621 | 0 | No | Bend |
| 695 | 74 | Yes | Bend |
| 718 | 0 | No | Bend |
| 865 | 0 | No | Bend |
| 865 | 0 | No | Bend |
| 975 | 0 | No | Bend |
| 975 | 0 | No | Bend |
| 1013 | 0 | No | Bend |
| 1018 | 0 | No | Bend |
| 1019 | 0 | No | Stretch |
| 1066 | 3.38 | slightly | Bend |
| 1066 | 3.38 | slightly | Bend |
| 1180 | 0 | No | Bend |
| 1203 | 0 | No | Bend |
| 1203 | 0 | No | Bend |
| 1355 | 0 | No | Stretch |
| 1381 | 0 | No | Stretch |
| 1524 | 7 | Yes | Stretch |
| 1524 | 7 | Yes | Stretch |
| 1653 | 0 | No | Stretch |
| 1653 | 0 | No | Stretch |
| 3172 | 0 | No | Stretch |
| 3181 | 0 | No | Stretch |
| 3181 | 0 | No | Stretch |
| 3197 | 47 | Yes | Stretch |
| 3197 | 47 | Yes | Stretch |
| 3278 | 0 | No | Stretch |
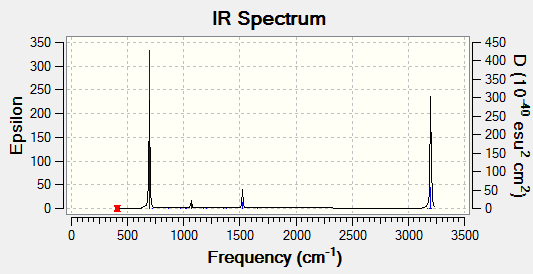
The 3N-6 rule shows the 30 vibrational modes in the tables, however due to the very high symmetry of the benzene molecule, most of the modes are not IR active as they do not correspond to a change in the overall dipole of the molecule. In fact there are only 4 peaks visible on the IR spectrum which correspond to 3 pairs of degenerate vibrational modes and 1 other vibrational mode at 695cm-1.
MO versus LCAO analysis and comparison
Benzene orbital analysis published to the D space DOI:10042/195321
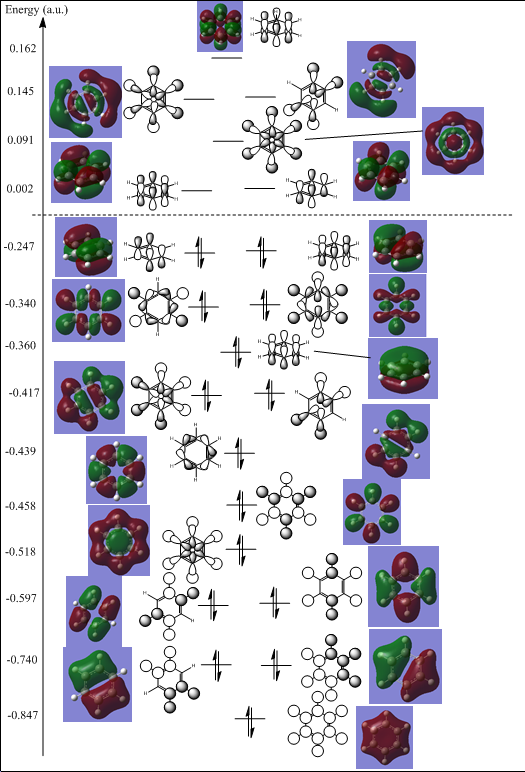
Similarly to discussed when looking at the BH3 molecular orbitals versus the LCAO. the LCAO in this case are useful again in showing approximate areas of electron density as well as predictions of the phases of the regions of electron density. The orbital contribution and the nodal planes are not shown very well by the LCAO when compared to the computed MOs for benzene. All non core orbitals are shown in the image below, as well as unoccupied orbitals up until the anti bonding orbital which corresponds to the aligned p orbitals perpendicular to the ring which are of interest when looking at aromaticity. The image does not accurately show the relative energies, the numbers are merely there for referencing the molecular orbitals and LCAO energies.
The qualitative molecular orbitals here clearly show the region of electron density, particularly in the molecular orbital at -0.360a.u. the full pi bonding orbital of benzene is shown, showing a fully in phase molecular orbital across the whole ring with a nodal plane through the plane of the molecule. The Molecular orbital also shows electron density in the middle of the ring, this is much harder to see or envisage when just looking at the LCAO.
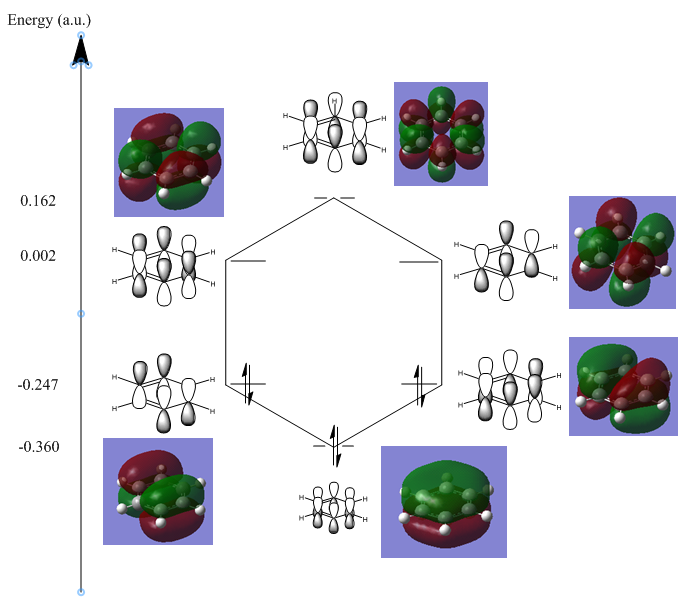
The figure below only shows the pi bonding orbitals that are relevant to the discussion of aromaticity. The 6 different molecular orbitals involved in the conjugated pi system are shown below.
Huckel Theory states that a stable closed shell conjugated cyclic structure is obtained when the system has 4n+2 electrons. The diagram above shows that the planar pi system contains 6 electrons which abides by Huckels rule when n=1 and therefore is an aromatic system.
The diagram shows the 6 molecular orbitals which all make up the basis set of aligned Pz orbitals divided up into 4 separate energy levels. The first energy level at -0.360a.u. shows an arrangement with all Pz orbitals aligned with one nodal plane along the plane of the sigma structure, making the entire bottom and top side of the molecule in phase. The second level at -0.247a.u. shows two degenerate molecular orbitals which both have two nodal planes. The third energy level at 0.002a.u. shows two molecular orbitals with three nodes each, and the fourth most anti bonding molecular orbital with four nodes at 0.162a.u. in energy.
These are the 6 orbitals which dominate the aromatic behavior. Benzene is a very symmetrical molecule, hence why there are two pairs of degenerate molecular orbitals. It is expected that with the introduction of the hetero atoms that the degeneracy in the system is decreased or even removed resulting in a different pi system, with varying number of nodes and hence also different shapes of molecular orbitals and bonding orders. Huckel theory is built on some assumptions that coulomb and resonance integrals between the substituent atoms in the ring are all equal and any differences are neglected. This means that Huckel theory is likely to break down for the hetero atomic versions of the benzene ring, as resonance integrals and coulomb integrals between the atoms in the ring are likely to vary much more.
Comparison of boratabenzene, pyridinium and borazine
Optimisation 6-31g(d,p) B3LYP
| Molecule | summary data | convergence | Jmol | Bond length and Angle | |||
|---|---|---|---|---|---|---|---|
| Boratabenzene log file here | 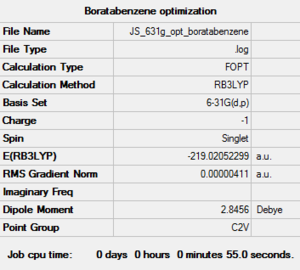
|
         Item              Value      Threshold  Converged?
 Maximum Force            0.000007     0.000015     YES
 RMS     Force            0.000002     0.000010     YES
 Maximum Displacement     0.000032     0.000060     YES
 RMS     Displacement     0.000009     0.000040     YES
|
|
B-C length: 1.51Å C-C length: 1.40Å C-B-C angle:115.1° | |||
| pyridinium log file here | 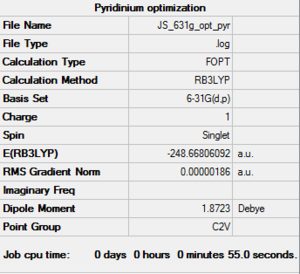
|
         Item              Value      Threshold  Converged?
 Maximum Force            0.000003     0.000015     YES
 RMS     Force            0.000001     0.000010     YES
 Maximum Displacement     0.000007     0.000060     YES
 RMS     Displacement     0.000002     0.000040     YES
|
|
N-C length: 1.35Å C-C length: 1.39Å C-N-C angle: 123.3° | |||
| Borazine log file here | 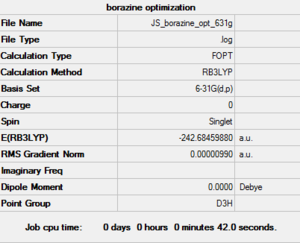
|
         Item              Value      Threshold  Converged?
 Maximum Force            0.000010     0.000015     YES
 RMS     Force            0.000005     0.000010     YES
 Maximum Displacement     0.000056     0.000060     YES
 RMS     Displacement     0.000018     0.000040     YES
|
|
N-B length: 1.43Å N-B-N angle:117.1° B-N-B angle:122.9° |
The calculation are all successful as it shows that they have converged. The heteroatom in the pyridinium and boratabenzene break the symmetry and demote the structure to C2v from D6h. The optimized structures also showed some distorted bond angles. The C-B-C bond is less than 120°, where as the C-N-C bond in pyridinium is slightly more, there are also slight differences in bond angles around the ring for both the pyridinium and boratabenzene. These differences could all be as a result of less symmetrical and less even overlap between orbitals and distorted Molecular orbitals which will be investigated further later.
The Borazine is slightly different as it does have a plane of symmetry perpendicular to the principle axis, this gives it the D3h point group. The N-B bond length is a constant 1.43A throughout the ring, but there are slightly varying bond angles between the B-N-B and N-B-N atoms. The B-N bonds in the borazine are almost as short as C-C bonds indicating similar strength, where as the two other heteroatomic rings both have much larger bonds lengths for C-C and C-E. This already give some insight into the level of conjugation and aromaticity in the ring.
Frequency
| Molecule | summary data | low modes |
|---|---|---|
| Boratabenzene log file here | 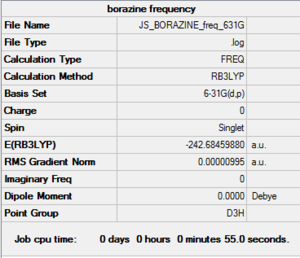
|
Low frequencies --- -7.2579 -0.0005 -0.0002 0.0004 3.1967 4.5275 Low frequencies --- 371.2965 404.4162 565.0822 |
| pyridinium log file here | 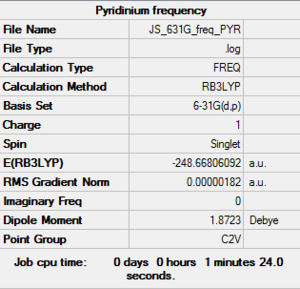
|
Low frequencies --- -9.3869 -2.9694 0.0002 0.0006 0.0007 0.9012 Low frequencies --- 391.9008 404.3425 620.1996 |
| Borazine log file here | 
|
Low frequencies --- -5.9941 -4.9905 -4.9747 -0.0039 0.0075 0.0165 Low frequencies --- 289.7319 289.7327 404.5383 |
The above frequency calculations show that all the structures were optimized. The low frequencies of within the accepted range show accuracy in the calculations, and now allows for full analysis of energy as well as qualitative molecular orbital and NBO analysis, to get a better understanding of the bonding present in each of the structures and how the charge is distributed across the molecules.
NBO charge comparison
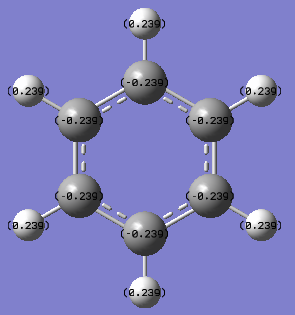
As was seen before with the ammonia molecule, electron density and charge per atom is governed by the atoms electronegativity.
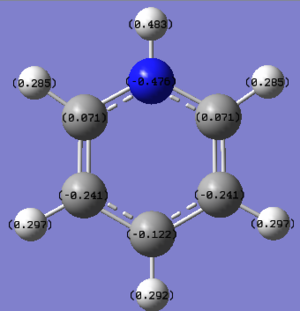
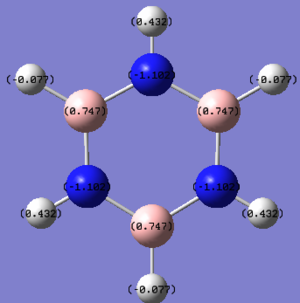
| Molecule | Color (range -1.00 to 1.00) | numbers (eV) |
|---|---|---|
| Boratabenzene DOI:10042/195322 | 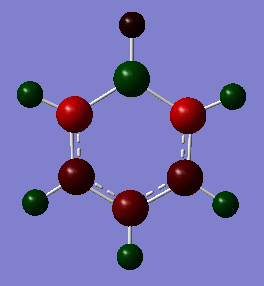
|
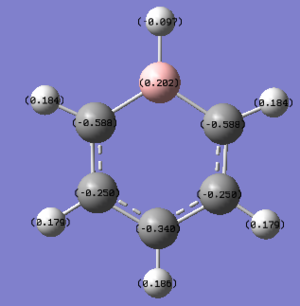
|
| Pyridinium DOI:10042/195323 | 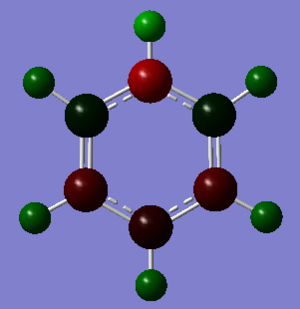
|
|
| Borazine DOI:10042/195324 | 
|
|
| Benzene DOI:10042/195321 | 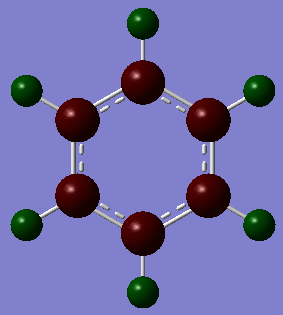
|
|
Benzene is highly symmetric and each carbon experiences identical charge of -0.239eV each, with each hydrogen having an opposite and equal charge to amount the total molecule to neutral charge. Carbon is hence more electronegative than hydrogen, a higher percentage of the electron density in the molecular orbital will lie nearer to the carbon compared to the hydrogen.
As soon as a heteroatom is added, symmetry is lost and the charge distribution is less regular. For pyridinium it is known that nitrogen is more electronegative than carbon and hydrogen, and thus carries a relative negative charge, at a value of -0.475eV, the carbons directly adjacent to it are slightly positively charged because of this at 0.071 each, the rest of the ring carbons carry relatively negative charge, when the charges are all added up in this molecule the total charge is +1 which is consistent with our isoenergetic calculation. The boratabenzene has an inverted charge density compared to pyridinium. Boron is slightly electropositive and much less electronegative than carbon, it carries a +0.202 charge in the ring, all other carbons in the ring are negatively charged with adjacent carbons at -0.588eV, which is much higher than the charge of the carbons in the benzene ring. Again for boratabenzene the overall charge adds up to -1 which was used to compute the isoenergetic calculation. the borazine shows an extreme, where the ring is made up of alternating electropositive and electronegative substituents making for a very uneven charge distribution image. The electronegative Nitrogen carrying -1.102eV each and the boron atoms at 0.747eV each. The total charge of borazine adds up to neutral, this molecule has slightly more symmetry than the two other heteroatomic rings, and also has a more even and consistent charge density.
MO comparison
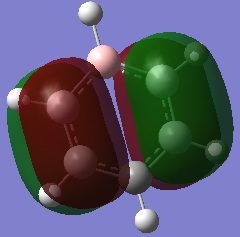
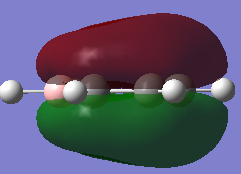
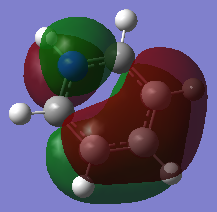
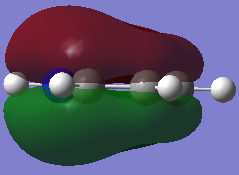
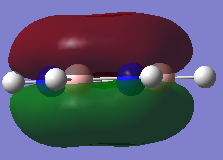
In order to test the aromaticity and Huckels theory with each of the compounds with reference to benzene, the three filled pi system orbitals predicted to be involved in the aromatic system are studied and compared. This involves the HOMO and two lower orbitals, namely number 20 and 17. The orbitals are first individually compared across the different molecules, followed by a comparison of the overal system compared to benzene.
| Molecule | Highest Occupied molecular orbital 21 | molecular orbital 20 | Molecular Orbital 17 |
|---|---|---|---|
| Boratabenzene DOI:10042/195322 | 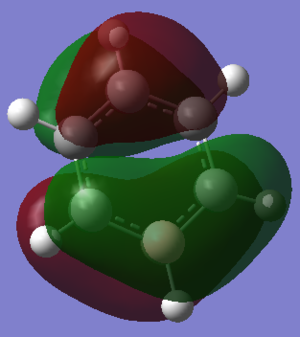 0.011a.u. 0.011a.u.
|
 -0.035a.u. -0.035a.u.
|
 -0.132a.u. -0.132a.u.
|
| Pyridinium DOI:10042/195323 | 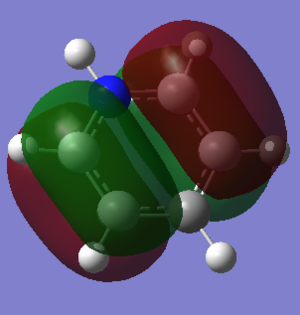 -0.479a.u. -0.479a.u.
|
 -0.508a.u. -0.508a.u.
|
 -0.641a.u. -0.641a.u.
|
| Borazine DOI:10042/195324 | 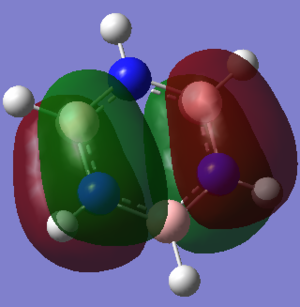 -0.276a.u. -0.276a.u.
|
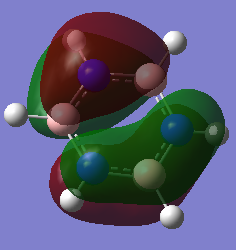 -0.276a.u. -0.276a.u.
|
 -0.361a.u. -0.361a.u.
|
| Benzene DOI:10042/195321 | 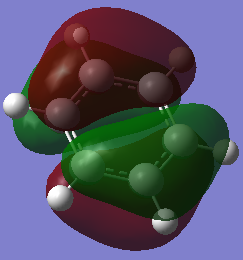 -0.247a.u. -0.247a.u.
|
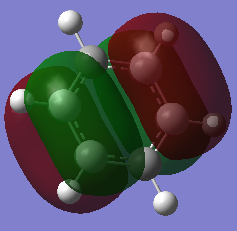 -0.247a.u. -0.247a.u.
|
 -0.360a.u. -0.360a.u.
|
Orbital 17 which corresponds to a pi MO for each of the structures is believed to be constructed of 6 Pz orbitals which are all in phase. All of the diagrams show the orbital with 1 nodal plane along the face of the ring. Slight distortions compared to benzene can be seen on the other three structures. The borazine structure has a similar even spread to that of the benzene, with a slight dip in electron density towards the middle of the ring. Furthermore there is a lot more electron density situated near each of the three nitrogen ataoms and relatively less so for each boron atom, this is explained by the charge density distribution where the nitrogen atoms were much more electronegative. The pyridinium MO 17 shows that the orbital is much more skewed towards the nitrogen atom, again this is due to the electronegativity of the nitrogen and its relativily negative charge compared to the carbons. It is also interesting to see that looking at the NBO the carbon para to the nitrogen is slightly negatively charged as well, and the MO 17 shows that the gradient of the molecular orbital decreases near this carbon and there is a slight dimple. This indicates an increase in electron density around this carbon. The boratabenzene mo 17 is the opposite of the pyridinium but is comparable in the sense that the MO is skewed away from the boron atom in the ring, again due to its electropositive nature more electron density sits on the carbons as seen in the NBO analysis. The boratabenzene MO 17 is much higher in energy compared to the benzene reference, where as the pyridinium is much lower in energy, hence the energy does not seem highly dependent on the size mis-matching of the Pz orbitals involved in bonding, The general trend seems to be that boratabenzene is much higher in energy for each of the orbitals so it may be down to sterics ( recalling that the boratabenzene had the largest deviation in bond angle and bond length compared to the benzene reference).
Given that the correlation seems to be that if the charge in the NBO on the atom shows a negative charge, then the molecular orbital is skewed towards this atom, in the case of borazine the surface of the molecular orbital is relatively even. It has a slight dip around each boron atom and is slightly swollen around each Nitrogen atom, however overal the molecular orbital retains its symmtery and remains less skewed than compared to the other two heterocyclic molecules.
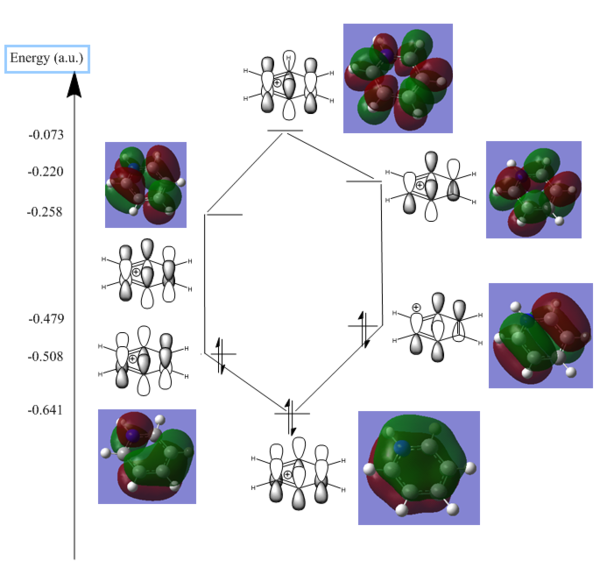
Having seen earlier that the orbitals 20 and 21 were degenerate for benzene in the 6 degenerate Pz orbital aromatic system, this is shown again here with both orbitals at -0.247a.u.. The borazine which previously showed higher levels of symmetry has also maintained degeneracy between the two HOMO orbitals 20 and 21 as shown above, with both orbitals at an energy of -0.276a.u.. Both the pyridinium and boratabenzene do not have degenerate MOs for 20 and 21. In fact they both have inverted molecular orbitals. For Boratabenzene the HOMO is of 0.011a.u. enegery and hence not stable as a lot of energy is forced onto the electropositive boron atom. in MO 20 for the same molecule, the boron atom interacts less with the molecular orbital and hence is more favorable with relief of electron denisty. The opposite is true for the pyridinium as expected, the HOMO is higher in energy with no charge density in the MO sitting directly on the electronegative nitrogen, and the MO 20 being more stable with the molecular orbital right ontop of the nitrogen.
The loss of degeneracy between orbitals 20 and 21 can be more clearly shown in the table below. It shows the pi system orbitals for the aromatic system in the boratabenzene heteroatomic ring and the pyridinium ring Showing LCAO and the computed MOs with relative energies. They are mirror images of each other with degeneracy lost compared to benzene, this is likely due to the charge distribution as shown by the NBO analysis earlier. The Borazine has higher symmetry and maintains degeneracy of the two HOMO orbitals, and hence will have an aromatic pi system more similar to the benzene which was shown previously. It would be interesting to see how the loss of degeneracy affects the stabilization energy that aromatic pi systems usually give, however it seems that it is difficult to quantitavely compared aromaticity due to differences in electronic stuctures of heteroatoms and carbon and incompatibility of different physical and chemical characteristics[4].
| Boratabenzene | Pyrdinium |
|---|---|

|
|
Overal the NBO analysis help a lot to explain the orientation and distrbitution of the molecular orbitals as shown, they also help to explain why the degeneracy is lost for the boratabenzene and pyrdinium but not for benzene and borazine. The energies of the orbitals were harder to interpret as it was believed that other physical properties played a part which was not looked at in great detail. This made energy comparisons of the orbitals more difficult, and hence also did not allow for quantitative analysis of the stabilization energy that the aromatic pi systems gave. It would have been interesting to see whether the degeneracy in the pi systems improved stabilization energy.
Resonance Energy Comparison
In order to measure the level of aromaticity, the resonance energy can be used to give a good insight and quantitatively describe this. As delocalisation of pi-electrons in the ring lowers orbital energies, there is a difference between the energy of the actual structure of the molecule and a hypothetical structure which does not benefit from this stabilization. This difference in energy is called the resonance energy. This resonance energy is often estimated by comparing the enthalpy change of hydrogenation of the aromatic molecule with an estimated structure of the molecule without aromaticity. For example: with benzene, the enthalpy change of hydrogenation of all three of benzene's double bonds is compared to the hydrogenation of cyclohexene (non-aromatic but similar structure). This can also be applied to the three heterocycles that are looked at in this experiment, by looking at the energies of optimized structures. It would be interested to calculate approximate resonance energies for each of the heteroatomatics and compare them to the benzene reference energy of 150.7kJmol-1 [5]. Taking calculations for optimized structures using the 6-31g (d,p) basis set at RB3LYP for different levels of hydrogenation for each of the molecules should allow for good comparison.
References
- ↑ Haynes, W. M., Lide, D. R. & Bruno, T. J. (2012). CRC Handbook of Chemistry and Physics (93rd ed.). Boca Raton: CRC Press
- ↑ Weast, Robert C. 1984. Crc Handbook of Chemistry and Physics: A Ready-Reference Book of Chemical and Physical Data. 65th ed. Boca Raton, Fla.: CRC Press. Electronic Format.
- ↑ Atkins, P. W., & De Paula, J. (2009). Physical Chemistry (9th ed.). Oxford: Oxford University Press.
- ↑ M.J. Cook, A.R. Katritzky and P. Lina, adv. Heterocycl, Chem, 1974, 17, 255.
- ↑ 1 J. Sherman, Oil Soap, 1939, 16, 28–28.

