Rep:Mod:Ssn3617
Part 1
BH3
Method and Basis Set
- Method: B3LYP
- Basis Set: 6-31G(d,p)
Summary table of final optimized molecule
"Item" table from optimisation
         Item               Value     Threshold  Converged?
 Maximum Force            0.000011     0.000450     YES
 RMS     Force            0.000007     0.000300     YES
 Maximum Displacement     0.000042     0.001800     YES
 RMS     Displacement     0.000027     0.001200     YES
Link to frequency .log file
Low Frequency lines from .log file
 Low frequencies ---   -7.5936   -1.5614   -0.0054    0.6514    6.9319    7.1055
 Low frequencies --- 1162.9677 1213.1634 1213.1661
Jmol image from frequency file
Optimized molecule |
Table of Vibrations
| Mode | Frequency/ cm-1 | Intensity | Symmetry | IR active/ inactive | Vibration Type |
|---|---|---|---|---|---|
| 1 | 1164 | 93 | A2" | Active | Bending |
| 2 | 1213 | 14 | E' | Active | Bending |
| 3 | 1213 | 14 | E' | Active | Bending |
| 4 | 2582 | 0 | A1' | Inactive | Stretching |
| 5 | 2716 | 126 | E' | Active | Stretching |
| 6 | 2716 | 126 | E' | Active | Stretching |
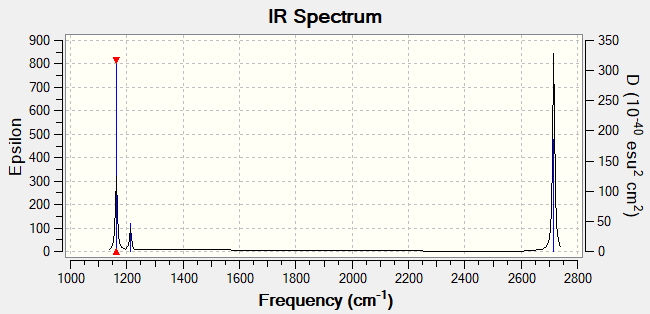
IR Spectrum
Why are there less than six peaks in the spectrum despite there being 6 vibrational modes?
There are 2 sets of degenerate modes: mode 2 and 3 (bending), and mode 5 and 6 (stretching). On top of that, mode 4 is IR inactive as it does not result in a net change in dipole moment due to the simultaneous, symmetric stretching of the 3 B-H bonds to the same extent. Taking the above into consideration, 3 peaks are expected, and that is observed in the IR spectrum obtained using GaussView.
Clear explanation and full information given in the table for the vibrational analysis, the only improvement would be to provide a more detailed description of the vibrational type (e.g. symmetric or asymmetric?) Smf115 (talk) 23:34, 25 May 2019 (BST)
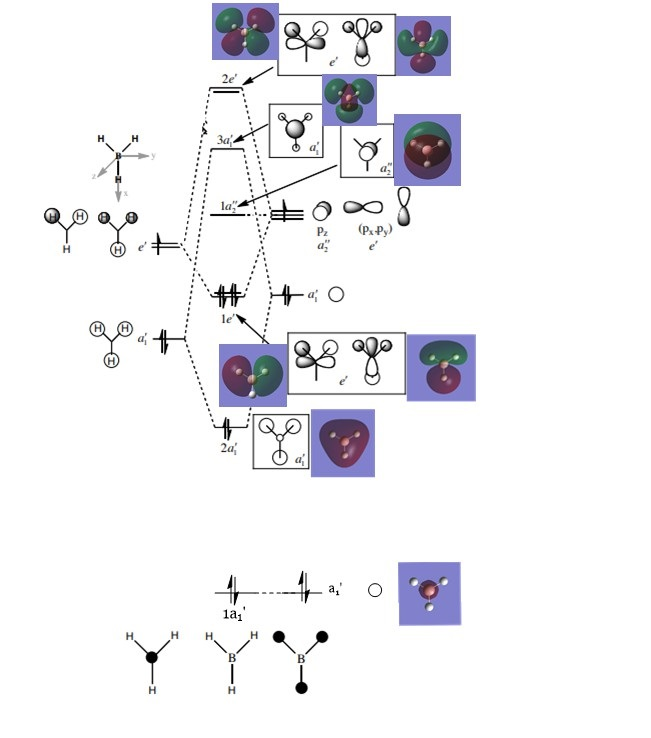
MO diagram of BH3
The above diagram was adapted from this source[1].
Are there any significant differences between the real and LCAO MOs?
Phase and general shape of the real MOs is well predicted by LCAO MOs. In this molecule, the MO diagram drawn up using MO theory correctly predicted the energy levels of the real MOs. However, in a more complicated (i.e. larger) molecule, it may not be able to do so accurately as the splitting energies may not be as well known or easily accurately represented in a simple MO diagram.
In this example, there is slight discrepancy in the general shape of the 2e' antibonding MO to the left of the diagram, involving the 2py orbital of B. In the real MO, the 2py orbital is slightly bent downwards, away from the contributing 1sAO of H atoms. Despite the slight distortion of electron cloud phase that was not predicted by the LCAO MO, the general changes in phase matches that of the ones observed in the real MO. The bending of the 2py AO of B away from the contribution H 1sAO orbitals can be seen as a change in the resulting MO so as to achieve stabilization.
Another difference that can be brought up is the difference in the contribution of each AO/FO towards the final MO. In the case of BH3, a notable example would be the 3a1' MO, where the LCAO MO predicted a much smaller contribution from the contributing H3 FO with respect to that of the contributing B 2sAO. However, phase and general shape of the real MO is still well predicted by the LCAO MO. This just reiterates the usefulness of the LCAO model to qualitively solve for real MOs rather than quantitatively.
What does this say about the accuracy and usefulness of qualitative MO theory?
MO theory is very useful in allowing the fast and largely accurate prediction of MOs that exist in molecules. It allows the qualitative determination of the shape and phase that exists in MOs without dealing with large chunks of data required to solve the Schrodinger equation. To a smaller extent, it can help to predict the relative energy levels of each of the resulting MOs. It is useful when applied on smaller molecules, where MO diagrams can be drawn with relative ease. However, is less useful when large molecules are involved, where there are a lot of different combinations of FOs to be considered, and various splitting energies involved. Additionally, it is also not useful when the actual contributions of each AO/FO is to be determined.
Excellent discussion considering the subtle differences between the calculated and LCAO MOs with two detailed examples! Great evaluation overall of LCAO MOs too. Smf115 (talk) 23:32, 25 May 2019 (BST)
NH3
Method and Basis Set
- Method: B3LYP
- Basis Set: 6-31G(d,p)
Summary table of final optimized molecule
"Item" table from optimisation
         Item               Value     Threshold  Converged?
 Maximum Force            0.000006     0.000015     YES
 RMS     Force            0.000004     0.000010     YES
 Maximum Displacement     0.000016     0.000060     YES
 RMS     Displacement     0.000011     0.000040     YES
Link to frequency .log file
Low Frequency lines from .log file
 Low frequencies ---   -0.0130   -0.0016   -0.0007    7.0749    8.0912    8.0915
 Low frequencies --- 1089.3840 1693.9368 1693.9368
Jmol image from frequency file
Optimized molecule |
NH3BH3
Method and Basis Set
- Method: B3LYP
- Basis Set: 6-31G(d,p)
Summary table of final optimized molecule
"Item" table from optimisation
         Item               Value     Threshold  Converged?
 Maximum Force            0.000233     0.000450     YES
 RMS     Force            0.000083     0.000300     YES
 Maximum Displacement     0.000820     0.001800     YES
 RMS     Displacement     0.000318     0.001200     YES
Link to frequency .log file
Low Frequency lines from .log file
 Low frequencies ---   -0.0276   -0.0070   -0.0053   10.1011   10.1486   37.9344
 Low frequencies ---  265.3079  634.4241  639.2084
Jmol image from frequency file
Optimized molecule |
Association Energy
Calculation of Association Energy
Values obtained using the same method and basis set.
- E(NH3) = -56.55777 AU
- E(BH3) = -26.61532 AU
- E(NH3BH3) = -83.22469 AU
ΔE = E(NH3BH3) - [E(NH3) + E(BH3)] = −0.05160 AU = (−0.05160 x 2625.50) kJ/ mol-1 = −135.5 kJ/ mol-1
Bond strength of NH3BH3
Based on the energy calculation carried out above, we can take bond energy of the B-N bond to be equal in magnitude to that of the association energy, such that bond energy of dative B-N bond = 135.5 kJ/ mol-1. Comparing to the known average bond energy of a B-N bond[2] = 377.9 ± 8.7 kJ/ mol-1, it can be concluded that the dative B-N bond is weak.
NI3
Method and Basis Set
- Method: B3LYP
- Basis Set: 6-31G(d,p) LANL2DZ
Summary table of final optimized molecule
"Item" table from optimisation
         Item               Value     Threshold  Converged?
 Maximum Force            0.000140     0.000450     YES
 RMS     Force            0.000092     0.000300     YES
 Maximum Displacement     0.001123     0.001800     YES
 RMS     Displacement     0.000804     0.001200     YES
Link to frequency .log file
Low Frequency lines from .log file
 Low frequencies ---  -12.7232  -12.7172   -6.4215   -0.0039    0.0189    0.0620
 Low frequencies ---  101.0767  101.0775  147.4581
Jmol image from frequency file
Optimized molecule |
Optimized N-I distance
2.184 Å [Bond distances are accurate to ≈ 0.001 Å]
Excellent first section! Well presented, detailing the methods and basis sets used clearly, and correct structure information throughout. Just note that energy values in kJmol-1 should be left to the nearest whole number. Smf115 (talk) 23:36, 25 May 2019 (BST)
Part 2: Ionic Liquids
[N(CH3)4]+
Method and Basis Set
- Method: B3LYP
- Basis Set: 6-31G(d,p)
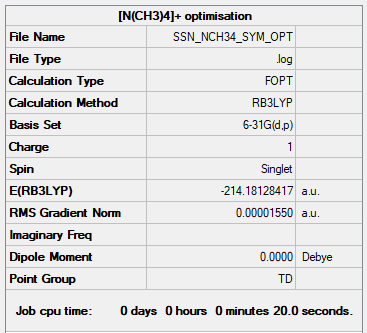
Summary table of final optimized molecule
"Item" table from optimisation
         Item               Value     Threshold  Converged?
 Maximum Force            0.000073     0.000450     YES
 RMS     Force            0.000017     0.000300     YES
 Maximum Displacement     0.000294     0.001800     YES
 RMS     Displacement     0.000124     0.001200     YES
Link to frequency .log file
Low Frequency lines from .log file
 Low frequencies ---   -0.0004    0.0003    0.0005   35.3122   35.3122   35.3122
 Low frequencies ---  217.1861  316.3283  316.3283
Jmol image from frequency file
Optimized molecule |
[P(CH3)4]+
Method and Basis Set
- Method: B3LYP
- Basis Set: 6-31G(d,p)
Summary table of final optimized molecule
"Item" table from optimisation
         Item               Value     Threshold  Converged?
 Maximum Force            0.000121     0.000450     YES
 RMS     Force            0.000031     0.000300     YES
 Maximum Displacement     0.000733     0.001800     YES
 RMS     Displacement     0.000300     0.001200     YES
Link to frequency .log file
Low Frequency lines from .log file
 Low frequencies ---    0.0011    0.0013    0.0025   51.2382   51.2382   51.2382
 Low frequencies ---  186.6180  211.4132  211.4132
Jmol image from frequency file
Optimized molecule |
Charge Distribution of Molecules
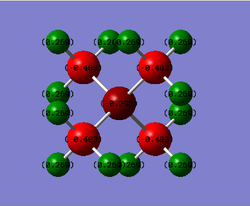
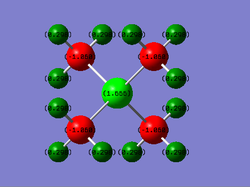
Table of Charges (NBO Type)
| Element | Charge in [N(CH3)4]+ | Charge in [P(CH3)4]+ |
|---|---|---|
| N | -0.295 | - |
| P | - | +1.666 |
| C | -0.483 | -1.060 |
| H | +0.269 | +0.298 |
Comparison of Charge Distribution
The charge distribution within each molecule will first be looked at here. A table of electronegativities[3] will be referred to in the below discussion.
For [N(CH3)4]+:
Using a NBO analysis, N and C atoms have negative charge of -0.295 and -0.483 respectively, while H atoms have a positive charge of +0.269.
The difference in charge between C and its bonded H atoms can be explained by the difference in electronegativities. C has a higher electronegativity of 2.50 as opposed to H with a value of 2.10. As such, the bond between them would be polarized, with electron density pulled more towards the more electronegative C to result in the charge distribution observed.
Considering the Lewis Structure of the molecule, we expect the N atom to have a positive formal charge of +1 as a N atom has 5 valenece electrons, and there are 4 electrons surrounding the N atom (= no. of bonding electrons/2 = 8/2 = 4) and no non-bonding electrons here. As such, the N atom in [N(CH3)4]+ is less stable. Since N is highly electronegative (electronegativity value = 3.07), which is higher than that of it's directly bonded C atoms (electronegativity value = 2.50), and also electron deficient, it will be able to exert a strong pull to polarize the N-C bonds and pull the electron density towards itself to mitigate the electron deficiency situation to become more stable.
For [P(CH3)4]+:
Using a NBO analysis, C atoms have negative charge of -1.060, while P and H atoms have a positive charge of +1.666 and +0.298 respectively.
The difference in charge between C and its bonded H atoms can be explained as above, due to the difference in electronegativities (2.50 and 2.10 respectively), such that electrons will be pulled towards the more electronegative C atoms.
Considering the Lewis Structure of the molecule, we expect the P atom to have a positive formal charge of +1 as a P atom has 5 valenece electrons, and there are 4 electrons surrounding the P atom (= no. of bonding electrons/2 = 8/2 = 4) and no non-bonding electrons here. While the P is now electron deficient and destabilized, it has an electronegative value of 2.06 which is less than that of C's 2.10, and hence cannot stabilize itself in the manner that a N central atom can. In fact, since C is slightly more electronegative, the electron density is pulled towards C rather than P, and so the negative charge on C in [P(CH3)4]+ is further intensified, in comparison to that of [N(CH3)4]+.
Discussion on Formal Charges
What does the "formal" positive charge on the N represent in the traditional picture? The "formal" positive charge on the N is obtained by considering the Lewis structure as done above, and can be calculated with the formula:
Formal Charge = no. of valence electrons - no. of non-bonding electrons - [no. of bonding electrons/2]
This calculation assumes that all the atoms are equally electronegative, such that electrons are shared equally in bonds.
On what atoms is the positive charge actually located for this cation?
For [N(CH3)4]+, the positive charge is actually located on the H atoms instead. This is explained above, and in essence, is due to the fact that in reality, atoms have different electronegativities, leading to electrons not being equally shared in bonds.
A very clear explanation of where the formal charge arises from and where the actual positive charge lies. The discussion of the relative electronegativities to justify the charges calculated is very good, to improve, you could consider some other effects (e.g. symmetry) and compare the two ILs more. Smf115 (talk) 11:53, 30 May 2019 (BST)
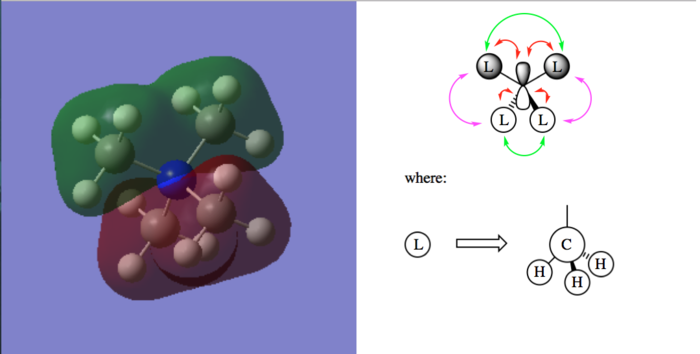
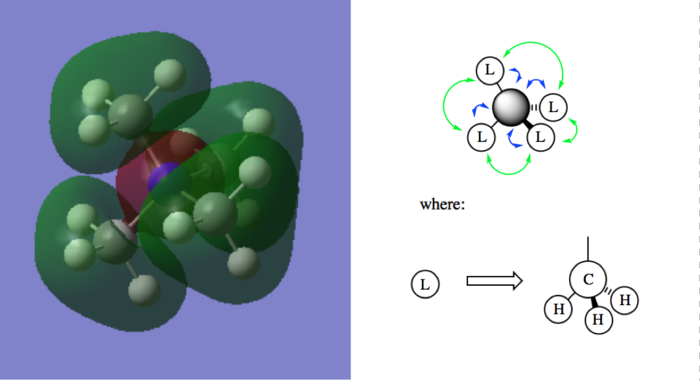
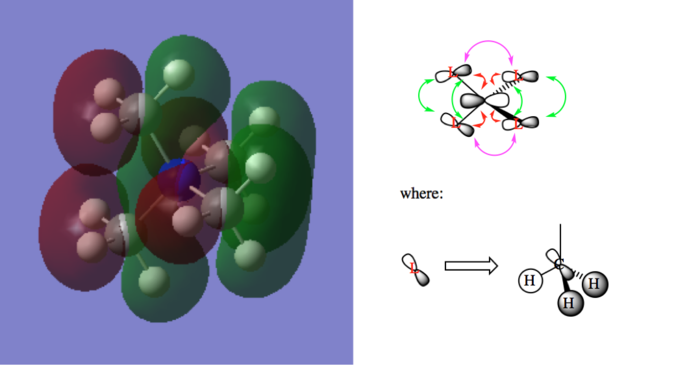
A few MOs of N(CH3)4]+
Table of visualized MOs and LCAO MOs
| Legend |
|---|

|
Excellent MO analysis! Great consideration of which FOs are involved and clearly justified, good evaluation of the overall MO character and very well presented. Smf115 (talk) 12:00, 30 May 2019 (BST)
Overall, a very well presented and high-quality report. Smf115 (talk) 12:01, 30 May 2019 (BST)


