Rep:Mod:Skilganon1
Computational Analysis (Day 1)
Optimising BH3
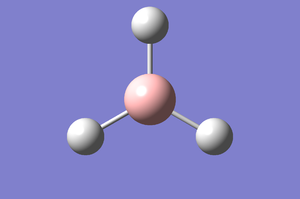
A BH3 molecule generated from GaussView is optimised by performing the ideal calculations needed via Schrodinger's Equation and the resulting molecule optimised.
Optimised Molecule |
The above is an attempt to reproduce a JAVA file of the molecule. The summary of the overall calculation is as such:
| File Name | BH3opti |
|---|---|
| File Type | .log |
| Calculation Type | FOPT |
| Calculation Method | RB3LYP |
| Basis Set | 3-21G |
| Charge | 0 |
| Spin | Singlet |
| E(RB3LYP) | -26.46226338 a.u. |
| RMS Gradient Norm | 0.00020672 a.u. |
| Imaginary Freq | cell |
| Dipole Moment | 0.0000 Debye |
| Point Group | D3H |
| CPU Time | 1 minute 3 seconds |
The overall calculation is shown below, and the optimisation is a success as convergence can be seen.
Item               Value     Threshold  Converged?
 Maximum Force            0.000413     0.000450     YES
 RMS     Force            0.000271     0.000300     YES
 Maximum Displacement     0.001610     0.001800     YES
 RMS     Displacement     0.001054     0.001200     YES
 Predicted change in Energy=-1.071764D-06
 Optimization completed.
    -- Stationary point found.
                           ----------------------------
                           !   Optimized Parameters   !
                           ! (Angstroms and Degrees)  !
 --------------------------                            --------------------------
 ! Name  Definition              Value          Derivative Info.                !
 --------------------------------------------------------------------------------
 ! R1    R(1,2)                  1.1935         -DE/DX =    0.0004              !
 ! R2    R(1,3)                  1.1935         -DE/DX =    0.0004              !
 ! R3    R(1,4)                  1.1935         -DE/DX =    0.0004              !
 ! A1    A(2,1,3)              120.0            -DE/DX =    0.0                 !
 ! A2    A(2,1,4)              120.0            -DE/DX =    0.0                 !
 ! A3    A(3,1,4)              120.0            -DE/DX =    0.0                 !
 ! D1    D(2,1,4,3)            180.0            -DE/DX =    0.0                 !
 --------------------------------------------------------------------------------
Optimisation of BH36-31G, a better basis set
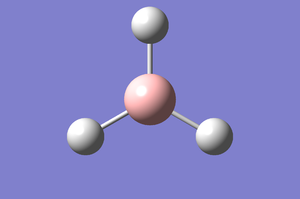
Above is another attempt of recreating the molecule in the form of JAVA. The basis set of the 6-31G was optimised and the overall method of calculation can be seen here.
Optimised Molecule |
| File Name | BH3opti6-31G |
|---|---|
| File Type | .log |
| Calculation Type | FOPT |
| Calculation Method | RB3LYP |
| Basis Set | 6-31G(d,p) |
| Charge | 0 |
| Spin | Singlet |
| E(RB3LYP) | -26.61532363 a.u. |
| RMS Gradient Norm | 0.00000235 a.u. |
| Imaginary Freq | cell |
| Dipole Moment | 0.0000 Debye |
| Point Group | D3H |
| CPU Time | 5 seconds |
Item               Value     Threshold  Converged?
 Maximum Force            0.000005     0.000450     YES
 RMS     Force            0.000003     0.000300     YES
 Maximum Displacement     0.000019     0.001800     YES
 RMS     Displacement     0.000012     0.001200     YES
 Predicted change in Energy=-1.304899D-10
 Optimization completed.
    -- Stationary point found.
                           ----------------------------
                           !   Optimized Parameters   !
                           ! (Angstroms and Degrees)  !
 --------------------------                            --------------------------
 ! Name  Definition              Value          Derivative Info.                !
 --------------------------------------------------------------------------------
 ! R1    R(1,2)                  1.1923         -DE/DX =    0.0                 !
 ! R2    R(1,3)                  1.1923         -DE/DX =    0.0                 !
 ! R3    R(1,4)                  1.1923         -DE/DX =    0.0                 !
 ! A1    A(2,1,3)              120.0            -DE/DX =    0.0                 !
 ! A2    A(2,1,4)              120.0            -DE/DX =    0.0                 !
 ! A3    A(3,1,4)              120.0            -DE/DX =    0.0                 !
 ! D1    D(2,1,4,3)            180.0            -DE/DX =    0.0                 !
 --------------------------------------------------------------------------------
Optimised Molecule Characteristics
| Bond Length | 1.19232 A |
|---|---|
| Bond Angle | 120 degrees |
Computational Analysis (Day 2)
Optimisation of TlBr3
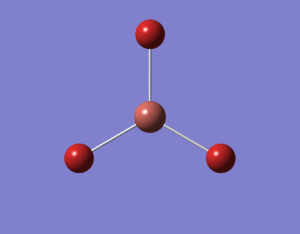
The optimisation is performed and calculated as such. The D-space link is given: [[1]].
| File Name | log_69385 |
|---|---|
| File Type | .log |
| Calculation Type | FOPT |
| Calculation Method | RB3LYP |
| Basis Set | LANL2DZ |
| Charge | 0 |
| Spin | Singlet |
| E(RB3LYP) | -91.21812851 a.u. |
| RMS Gradient Norm | 0.00000090 a.u. |
| Imaginary Freq | cell |
| Dipole Moment | 0.0000 Debye |
| Point Group | D3H |
| CPU Time | 37.7 seconds |
The calculated convergence shows that an optimisation has been found for the heavy molecule.
  Item               Value     Threshold  Converged?
 Maximum Force            0.000002     0.000450     YES
 RMS     Force            0.000001     0.000300     YES
 Maximum Displacement     0.000022     0.001800     YES
 RMS     Displacement     0.000014     0.001200     YES
 Predicted change in Energy=-6.084107D-11
 Optimization completed.
    -- Stationary point found.
                           ----------------------------
                           !   Optimized Parameters   !
                           ! (Angstroms and Degrees)  !
 --------------------------                            --------------------------
 ! Name  Definition              Value          Derivative Info.                !
 --------------------------------------------------------------------------------
 ! R1    R(1,2)                  2.651          -DE/DX =    0.0                 !
 ! R2    R(1,3)                  2.651          -DE/DX =    0.0                 !
 ! R3    R(1,4)                  2.651          -DE/DX =    0.0                 !
 ! A1    A(2,1,3)              120.0            -DE/DX =    0.0                 !
 ! A2    A(2,1,4)              120.0            -DE/DX =    0.0                 !
 ! A3    A(3,1,4)              120.0            -DE/DX =    0.0                 !
 ! D1    D(2,1,4,3)            180.0            -DE/DX =    0.0                 !
 --------------------------------------------------------------------------------
| Bond Length | 2.65095 A |
|---|---|
| Bond Angle | 120 degrees |
A reference bond length is found to be 2.7382, which is very similar to the one calculated by Gaussian, proving that the calculation is accurate.
Optimisation of BBr3

The optimisation calculation was run and deposited to the D-space.[[2]] The calculation is as such and it shows that convergence has taken place. This molecule is special because its substituents are heavy, therefore there was a need to tweak its pseudopotentials, making it compatible for gaussian to run its calculation.
Item               Value     Threshold  Converged?
 Maximum Force            0.000008     0.000450     YES
 RMS     Force            0.000005     0.000300     YES
 Maximum Displacement     0.000036     0.001800     YES
 RMS     Displacement     0.000023     0.001200     YES
 Predicted change in Energy=-4.027600D-10
 Optimization completed.
    -- Stationary point found.
                           ----------------------------
                           !   Optimized Parameters   !
                           ! (Angstroms and Degrees)  !
 --------------------------                            --------------------------
 ! Name  Definition              Value          Derivative Info.                !
 --------------------------------------------------------------------------------
 ! R1    R(1,2)                  1.934          -DE/DX =    0.0                 !
 ! R2    R(1,3)                  1.934          -DE/DX =    0.0                 !
 ! R3    R(1,4)                  1.934          -DE/DX =    0.0                 !
 ! A1    A(2,1,3)              120.0            -DE/DX =    0.0                 !
 ! A2    A(2,1,4)              120.0            -DE/DX =    0.0                 !
 ! A3    A(3,1,4)              120.0            -DE/DX =    0.0                 !
 ! D1    D(2,1,4,3)            180.0            -DE/DX =    0.0                 !
 --------------------------------------------------------------------------------
| File Name | BH3opti6-31G |
|---|---|
| File Type | .log |
| Calculation Type | FOPT |
| Calculation Method | RB3LYP |
| Basis Set | Gen |
| Charge | 0 |
| Spin | Singlet |
| E(RB3LYP) | -64.43645296 a.u. |
| RMS Gradient Norm | 0.000000382 a.u. |
| Imaginary Freq | |
| Dipole Moment | 0.0000 Debye |
| Point Group | D3H |
| CPU Time | 36.1 seconds |
| B-Br Bond Length | 1.93396 A |
|---|---|
| Bond Angle | 120 degrees |
Overall Analysis
| BH3 | BBr3 | TlBr3 | |
|---|---|---|---|
| Bond Length | 1.19232 A | 1.93396 A | 2.65095 A |
The heavier the subsitutents, the longer the bond length, as seen in BH3 and BBr3. H and Br differ in terms of electronegativity, Br is strongly electronegative whereas H is not as electronegative. This could affect the bond length, however the more significant change in bond length is due to the fact that Br is an electron rich atom as compared to H, it will undergo a stronger repulsion, therefore the bond length for BBr3 is longer. The valence of H and Br are similar.
When we increase the size of the central atom, there is a distinct increase in bond length, however it's increase is not as large as when increasing the substituents. This is because there is only a single change in atom when we replace the central atom as compared to when we replace the substituents. The repulsion of the more electron rich atom is distributed among the three atoms.
Sometimes gaussview does not draw in the bonds where we expect, however this does not mean that the bonds are not present. Gaussview has merely presented a diagram with non bonding orbitals(during optimisation process).
A bond is an attraction between atoms to form a molecule. It could be an ionic bond, in which the donation and acceptance of electrons take place, or it could also be a covalent bond, in which bond sharing takes place.
Computational Analysis (Day 3)
Frequency Analysis of an optimised BH3
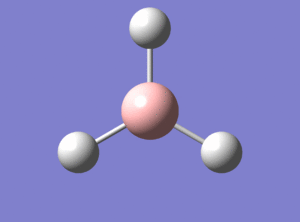
The calculated Frequency Analysis. The summary of the calculation run at the HPC is as below:
| File Name | BH3OPTIFREQ6-31G |
|---|---|
| File Type | .log |
| Calculation Type | FREQ |
| Calculation Method | RB3LYP |
| Basis Set | 6-31G(d,p) |
| Charge | 0 |
| Spin | Singlet |
| E(RB3LYP) | -26.61532363 a.u. |
| RMS Gradient Norm | 0.00000237 a.u. |
| Imaginary Freq | 0 |
| Dipole Moment | 0.0000 Debye |
| Point Group | D3H |
| CPU Time | 2 minutes 29.0 seconds |
The below calculation of near 0 frequency shows that the lower frequencies are very near zero, and the highest frequency is at 12cm-1, which is within a plus minus 15 cm-1 range.
 Low frequencies ---   -0.9033   -0.7343   -0.0054    6.7375   12.2491   12.2824
 Low frequencies --- 1163.0003 1213.1853 1213.1880
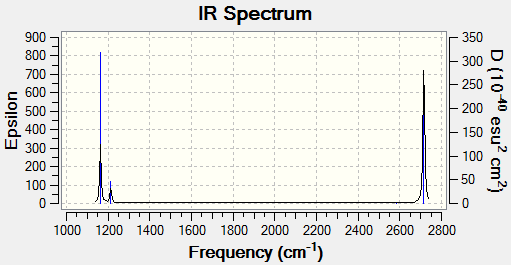
The vibrational spectrum above shows around 4 distinct peaks of molecular vibrations. In reality, one should expect the spectrum to show 6 distinct peaks, however for some molecular vibrations, they share the same frequency, therefore they overlap at one point of frequency with another due to degeneracy (see above table for frequency values), however the intensity of each vibration undergoes superposition and thus if two molecules share the same vibrational frequency then one would expect the vibrational peak to be amplified.
It should be noted that the stretching frequency is a lot higher than the vibrational frequency.
TlBr3 and BH3 Vibrational Analysis Comparison
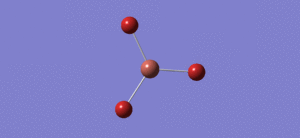
The Vibrational Analysis is shown here. The optimisation of TlBr3 can be confirmed based on the data below, the lowest real frequency is -3.4213 whereas the highest real frequency is 3.9367. The values are close to zero and are within a plus minus 15cm-1 error bar. D-space link [[3]].
Low frequencies ---   -3.4213   -0.0026   -0.0004    0.0015    3.9367    3.9367
 Low frequencies ---   46.4289   46.4292   52.1449
| File Name | TlBR3OPTIFREQ6-31G |
|---|---|
| File Type | .log |
| Calculation Type | FREQ |
| Calculation Method | RB3LYP |
| Basis Set | LANL2DZ |
| Charge | 0 |
| Spin | Singlet |
| E(RB3LYP) | -91.21812851 a.u. |
| RMS Gradient Norm | 0.00000088 a.u. |
| Imaginary Freq | 0 |
| Dipole Moment | 0.0000 Debye |
| Point Group | D3H |
| CPU Time | 11 seconds |
A comparison between both vibrational frequencies:


The vibrational frequency of the BH3 is many times higher than that of TlBr3. This is because the TlBr3 is a lot larger and therefore heavier than the BH3, therefore the inertia in each of the Br atom is higher than the H atom, so less vibrations take place for TlBr3 per second. The lower inertia in the BH3 means that it is susceptible to change more than that of the TlBr3, therefore a larger change in the vibrational frequency is observed. One would also expect the ennergy for TlBr3 to be significantly larger than that of BH3.
It can be seen above that for the first three vibrations of both BH3 and TlBr3 that there has been a rearranging of modes. However the following three vibrations see similar vibrations for both BH3 and TlBr3. (The comparison is as above)
The vibrational spectrum of both TlBr3 and BH3 has one similarity in the sense that there they are rather far apart from the first 3 peaks to the other 3 peaks. For both spectra, two modes lie fairly close together, the A2 and E' modes and then the other two modes also lie fairly close to each other, but higher in energy because the way of the vibrational modes indicate that there will be a much stronger repulsion between the atoms, therefore greatly increasing the potential energy of the latter modes of vibration.
When comparing the frequency of both BH3 and TlBr3, a better and more consistent basis set has to be used, since TlBr3 has very heavy substitutents. The main purpose of carrying out the frequency analysis is so that we have a better understanding of significant changes when analysing say, an IR spectrum - given both molecules with different substituents, one might expect that their IR spectrum(aside from the substituent effects) to be rather similar, when in truth they are not. Understanding vibrational frequency enables us to explain the difference in frequency. The low frequencies of the vibrations shows that the vibrational and translational frequencies are very similar to each other.
We should also note that the stretching frequencies are a lot higher than the translational frequencies.
BH3 Molecular Orbital
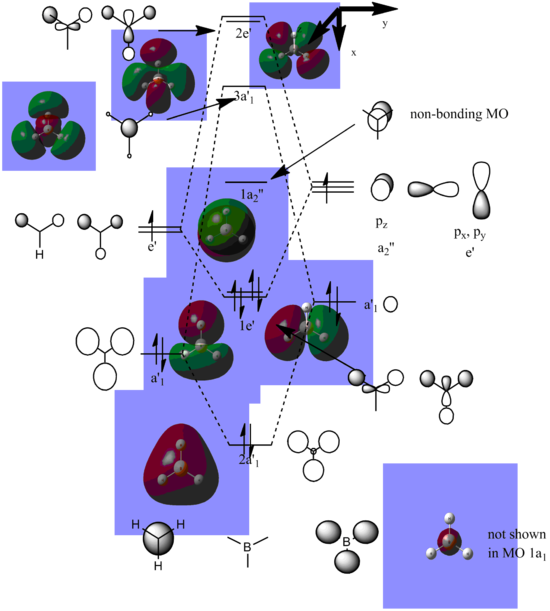
The Molecular Orbital Diagram of BH3 is compiled using Chemdraw with the LCAO generated from gaussian as a guidance: (The calculation is here. [[4]]
[HOMO1] |
[HOMO2] |
[HOMO3] |
[LUMO4]
|
[LUMO5] |
[LUMO6] |
[LUMO7] |
[LUMO8]
|
The real MO's are almost similar to the LCAO MO's in terms of phase, as shown (below: using the phase of the generated real MO's to visualise the LCAO). However, as we approach the upper orbtials with higher energy, the real MO's become a lot more diffuse and therefore it becomes increasingly harder to construct LCAO MO's. Therefore, the qualitative MO's are accurate at the lower stages of the MO, however becomes increasingly inaccurate as the MO's becomes more diffuse.
NH3 Analysis
Optimisation
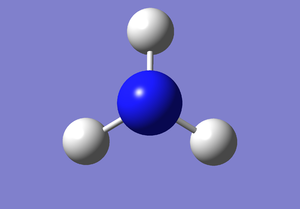
The calculation of the Optimised NH3. The calculation shows that convergence has taken place.
  Item               Value     Threshold  Converged?
 Maximum Force            0.000005     0.000450     YES
 RMS     Force            0.000003     0.000300     YES
 Maximum Displacement     0.000010     0.001800     YES
 RMS     Displacement     0.000007     0.001200     YES
 Predicted change in Energy=-7.830447D-11
 Optimization completed.
    -- Stationary point found.
                           ----------------------------
                           !   Optimized Parameters   !
                           ! (Angstroms and Degrees)  !
 --------------------------                            --------------------------
 ! Name  Definition              Value          Derivative Info.                !
 --------------------------------------------------------------------------------
 ! R1    R(1,2)                  1.018          -DE/DX =    0.0                 !
 ! R2    R(1,3)                  1.018          -DE/DX =    0.0                 !
 ! R3    R(1,4)                  1.018          -DE/DX =    0.0                 !
 ! A1    A(2,1,3)              105.7463         -DE/DX =    0.0                 !
 ! A2    A(2,1,4)              105.7463         -DE/DX =    0.0                 !
 ! A3    A(3,1,4)              105.7463         -DE/DX =    0.0                 !
 ! D1    D(2,1,4,3)           -111.867          -DE/DX =    0.0                 !
 --------------------------------------------------------------------------------
| File Name | NH3Optimisation |
|---|---|
| File Type | .log |
| Calculation Type | FOPT |
| Calculation Method | RB3LYP |
| Basis Set | 6-31G(d,p) |
| Charge | 0 |
| Spin | Singlet |
| E(RB3LYP) | -56.55776863 a.u. |
| RMS Gradient Norm | 0.00000289 a.u. |
| Imaginary Freq | 0 |
| Dipole Moment | 1.8464 Debye |
| Point Group | C3V |
| CPU Time | 5 minutes 27 seconds |
Frequency Analysis
Low frequencies ---   -0.0375   -0.0102    0.0009    1.6419    1.6434    2.4618
 Low frequencies --- 1089.2851 1693.9239 1693.9239
The low frequencies are ideal as they are very close to zero, show a pronounced increase for each consecutive frequency and are within 15cm-1.
| File Name | NH3FREQ |
|---|---|
| File Type | .log |
| Calculation Type | FREQ |
| Calculation Method | RB3LYP |
| Basis Set | 6-31G(d,p) |
| Charge | 0 |
| Spin | Singlet |
| E(RB3LYP) | -56.55776863 a.u. |
| RMS Gradient Norm | 0.00000281 a.u. |
| Imaginary Freq | 0 |
| Dipole Moment | 1.8464 Debye |
| Point Group | C3 |
| CPU Time | 2 minutes 17 seconds |
Population Analysis

[HOMO1] |
[HOMO2] |
[HOMO3] |
[HOMO4]
|
[LUMO5] |
[LUMO6] |
[LUMO7] |
[LUMO8]
|
NBO Analysis

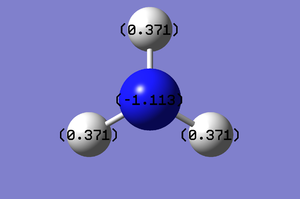
The charge range for the NBO of NH3 is -1.000 to 1.000. Each hydrogen on the molecule has a natural positive charge of 0.371, whereas the Nitrogen has a negative chage of -1.113.
Association Energies: Ammonia-Borane
Optimisation
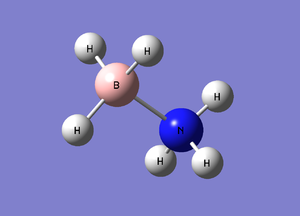
B-N bondlength: 1.66803 B-H angle: 107.870 degrees N-H angle: 113.869 d
The D-space link for the calculated optimised NH3BH3[[5]]
The molecule is optimised and the calculation is seen here
 Item               Value     Threshold  Converged?
 Maximum Force            0.000137     0.000450     YES
 RMS     Force            0.000063     0.000300     YES
 Maximum Displacement     0.000606     0.001800     YES
 RMS     Displacement     0.000336     0.001200     YES
 Predicted change in Energy=-1.993989D-07
 Optimization completed.
    -- Stationary point found.
| File Name | NH3BH3optimisationcom |
|---|---|
| File Type | .log |
| Calculation Type | FOPT |
| Calculation Method | RB3LYP |
| Basis Set | 6-31G(d,p) |
| Charge | 0 |
| Spin | Singlet |
| E(RB3LYP) | -83.22468918 a.u. |
| RMS Gradient Norm | 0.00006806 a.u. |
| Imaginary Freq | |
| Dipole Moment | 5.5654 Debye |
| Point Group | C1 |
| CPU Time | 1 minute 49.8 seconds |
Frequency Analysis
The D-space link for the frequency analysis is [[6]]. The calculated frequency is rather high:
Low frequencies ---   -0.0006    0.0006    0.0010   17.3043   17.8597   39.0760
 Low frequencies ---  266.1097  632.2782  639.4133
Summary of calculation:
| File Name | log_70068 |
|---|---|
| File Type | .log |
| Calculation Type | FREQ |
| Calculation Method | RB3LYP |
| Basis Set | 6-31G(d,p) |
| Charge | 0 |
| Spin | Singlet |
| E(RB3LYP) | -83.22468889 a.u. |
| RMS Gradient Norm | 0.00006555 a.u. |
| Imaginary Freq | 0 |
| Dipole Moment | 5.5654 Debye |
| Point Group | C1 |
| CPU Time | 2 minutes 14.7 seconds |
Energies
E(NH3) = -56.55776863 a.u.
E(BH3) = -26.61532363 a.u
E(NH3BH3) = -83.22468918 a.u.
The energy difference ΔE=E(NH3BH3)-[E(NH3)+E(BH3)] = -0.05159692 a.u.
converting -0.05159692 a.u. to joule = -0.05159692 x 4.359810e-18 J x 6.02 x 1023 = -135.421 kJ/mol
this number tells us the association energy for combinging a molecule of NH3 with one of BH3, conversely it is also the dissociation energy. (-135.421 kJ/mol). The reference dissociation energy for this system is approximately -122.55 kJ/mol. Therefore our calculated energy is pretty similar to the reference energy, the value is coherent.
Aromaticity
Benzene
Optimisation
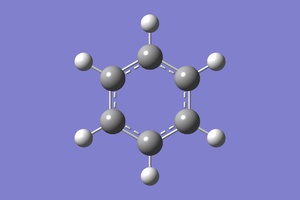
Molecular optimisation
The D-space link is as[[7]].
Item               Value     Threshold  Converged?
 Maximum Force            0.000199     0.000450     YES
 RMS     Force            0.000081     0.000300     YES
 Maximum Displacement     0.000847     0.001800     YES
 RMS     Displacement     0.000299     0.001200     YES
 Predicted change in Energy=-4.636845D-07
 Optimization completed.
    -- Stationary point found.
| File Name | benzeneopti |
|---|---|
| File Type | .log |
| Calculation Type | FOPT |
| Calculation Method | RB3LYP |
| Basis Set | 6-31G(d,p) |
| Charge | 0 |
| Spin | Singlet |
| E(RB3LYP) | -232.25821387 a.u. |
| RMS Gradient Norm | 0.00008450 a.u. |
| Imaginary Freq | 0 |
| Dipole Moment | 0.0000Debye |
| Point Group | D6H |
| CPU Time | 1 minutes 2.9 seconds |
Frequency Analysis
The D-space link. [[8]]
Low frequencies ---   -4.6046   -4.6046   -0.0088   -0.0041   -0.0040    9.6590
 Low frequencies ---  413.9386  413.9386  621.1428
| File Name | benzenefreq |
|---|---|
| File Type | .log |
| Calculation Type | FREQ |
| Calculation Method | RB3LYP |
| Basis Set | 6-31G)d,p |
| Charge | 0 |
| Spin | Singlet |
| E(RB3LYP) | -232.25821387 a.u. |
| RMS Gradient Norm | 0.00008452 a.u. |
| Imaginary Freq | 0 |
| Dipole Moment | 0.0000 Debye |
| Point Group | D6H |
| CPU Time | 1 minute 46.4 seconds |
Population Analysis
D-space link.[[9]]
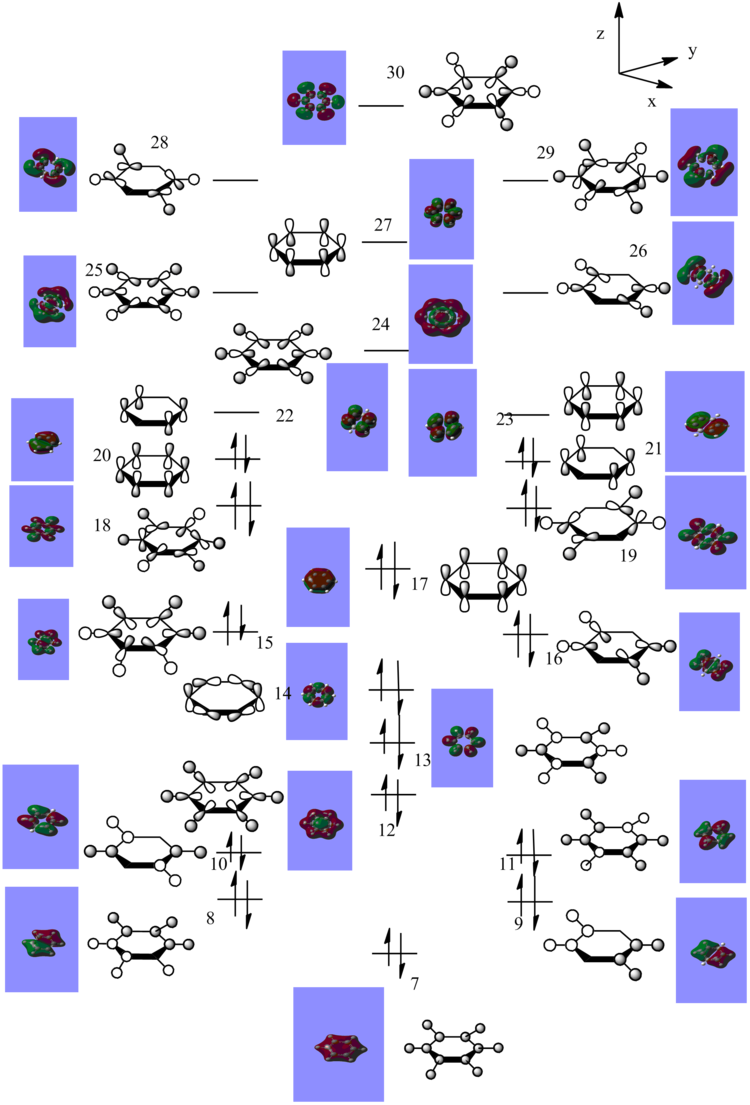
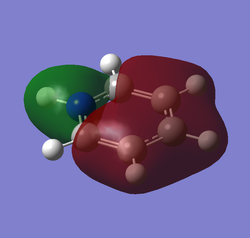
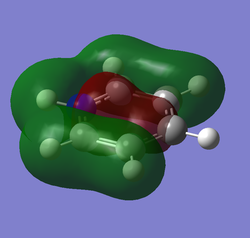
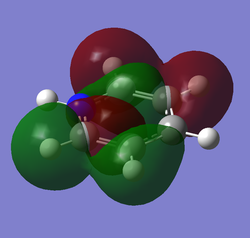
The MO diagram for the Benzene was constructed from the generated MO. The detailed MO's are as below, from left to right starting from level 7.
NBO Analysis
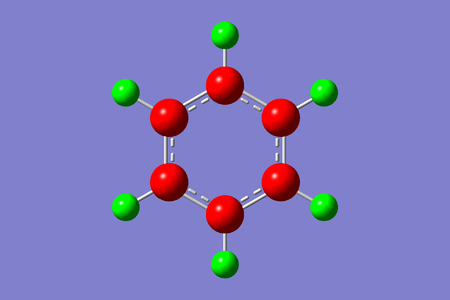
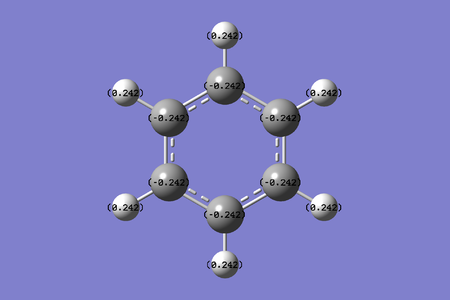
Charge range: -0.242 to 0.242. The carbon atoms in the benzene molecule are symmetrical, therefore we do not expect an uneven distribution of electron charge. The carbon atom is electronegative, with a natural charge of -0.242, due to delocalisation of electrons to the center of the benzene ring. The loss of electron from delocalisation causes the carbon atoms to be 'electron deficient'. The hydrogen attached to the carbon has an equal and opposite value of 0.242, which is expected, since the molecule is symmetric. The hydrogen will therefore donate its extra electrons to the adjacent carbon atoms.
Overall Analysis
Aromaticity relates to the total pi electron density, to achieve ideal aromaticity, the pi electron count must conform to Huckel's rule 4n+2 = total pi electrons. Each MO has formal pi electron number of 2, so 4(0)+2 = 2 which shows that it correlates to aromacity.
Boratabenzene and Pyridinium
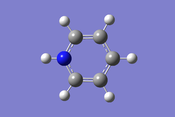
Boratabenzene takes the shape of a benzene ring with a Carbon atom replaced with a boron atom along with a negative charge. Pyridinium takes the shape of a benzene ring with a carbon atom replaced with a nitrogen atom along with a positive chage.

Optimization
D-space link for Boratabenzene:[[10]] and D-space link for Pyridinium:[[11]] Calculation for Optimisation of Boratabenzene is shown as such and the calculation for Pyridinium is shown as such.
A summary of both Boratabenzene and Pyridinium:
| File Name | Pyridiniumlog |
|---|---|
| File Type | .log |
| Calculation Type | FOPT |
| Calculation Method | RB3LYP |
| Basis Set | 6-31G(d,p) |
| Charge | 1 |
| Spin | Singlet |
| E(RB3LYP) | -248.66807396 a.u. |
| RMS Gradient Norm | 0.00003911 a.u. |
| Imaginary Freq | |
| Dipole Moment | 1.8727 Debye |
| Point Group | C1 |
| CPU Time | 3 minutes 58.8 seconds |
| File Name | Boratabenzenelog |
|---|---|
| File Type | .log |
| Calculation Type | FOPT |
| Calculation Method | RB3LYP |
| Basis Set | 6-31G(d,p) |
| Charge | -1 |
| Spin | Singlet |
| E(RB3LYP) | -219.020529856 a.u. |
| RMS Gradient Norm | 0.00015727 a.u. |
| Imaginary Freq | |
| Dipole Moment | 2.8465 Debye |
| Point Group | C1 |
| CPU Time | 3 minutes 57.6 seconds |
The Optimisation for Boratabenzene shows a convergence:
Item               Value     Threshold  Converged?
 Maximum Force            0.000159     0.000450     YES
 RMS     Force            0.000068     0.000300     YES
 Maximum Displacement     0.000888     0.001800     YES
 RMS     Displacement     0.000326     0.001200     YES
 Predicted change in Energy=-6.532183D-07
 Optimization completed.
    -- Stationary point found.
The Optimisation for Pyridinium shows a convergence as well:
Item               Value     Threshold  Converged?
 Maximum Force            0.000064     0.000450     YES
 RMS     Force            0.000023     0.000300     YES
 Maximum Displacement     0.000822     0.001800     YES
 RMS     Displacement     0.000175     0.001200     YES
 Predicted change in Energy=-6.915416D-08
 Optimization completed.
    -- Stationary point found.
Frequency Analysis
The D-space link for Boratabenzene is: [[12]] and the D-space link for pyridanium is [[13]]. The frequency analysis shows the correct low frequency:
Low frequencies ---   -6.8452   -0.0008   -0.0007    0.0006    3.2498    5.6382
 Low frequencies ---  371.2618  404.4990  565.1632
| File Name | Boratabenzenefrequency |
|---|---|
| File Type | .log |
| Calculation Type | FREQ |
| Calculation Method | RB3LYP |
| Basis Set | 6-31G(d,p) |
| Charge | -1 |
| Spin | Singlet |
| E(RB3LYP) | -219.020522229 a.u. |
| RMS Gradient Norm | 0.00015575 a.u. |
| Imaginary Freq | 0 |
| Dipole Moment | 2.8467 Debye |
| Point Group | C1 |
| CPU Time | 11 minutes 33.4 seconds |
The frequency analysis shows the correct low frequency:
Low frequencies ---   -9.5083   -5.2693   -0.0009   -0.0002    0.0009    3.9525
 Low frequencies ---  391.9048  404.3496  620.1993
| File Name | pyridiniumfrequency |
|---|---|
| File Type | .log |
| Calculation Type | FREQ |
| Calculation Method | RB3LYP |
| Basis Set | 6-31G(d,p) |
| Charge | 1 |
| Spin | Singlet |
| E(RB3LYP) | -248.66806085a.u. |
| RMS Gradient Norm | 0.00003282 a.u. |
| Imaginary Freq | 0 |
| Dipole Moment | 1.8727 Debye |
| Point Group | C1 |
| CPU Time | 11 minutes 33.4 seconds |
Population Analysis
The D-space for the completed population analysis of Boratabenzene is [[14]] and the D-space for the completed population analysis of pyridinium is [[15]]. See below
NBO Analysis
Charge analysis of Boratazine:

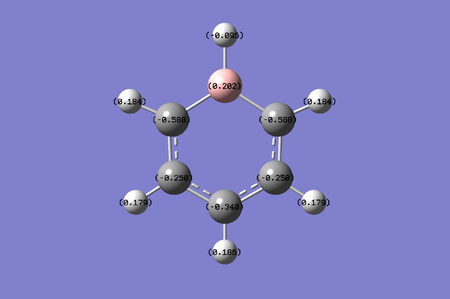
Chage range: -0.225 to 0.225. The boron atom in boratazine is electropositive, with a value of 0.202. To compensate for the relatively high electropositivity, the carbon atoms delocalise unevenly with the two carbon atoms adjacent to boron having a higher electronegativity with value of -0.588. As we move further and further away from the boron atom, the electronegativity of the carbon atom decreases to -0.250. However they reach a final carbon point where it's electronegativity drops slightly to -0.340. This could be due to the fact that this carbon atom is directly opposite the electropositive boron atom, so any form of vibration will most likely cause a slight interaction between the carbon and the boron atom. Note that the charge of the hydrogen is directly related to the charge on it's adjacent atom, for the boron molecule, an electronegative hydrogen of -0.096 is there to compensate for the effects of the relatively high electropositivity. The ortho carbon's electrons have charges of 0.184, the meta carbon's electron have charges of 0.179 and finally the para hydrogen has a charge of 0.186.
Charge analysis of Pyradinium:
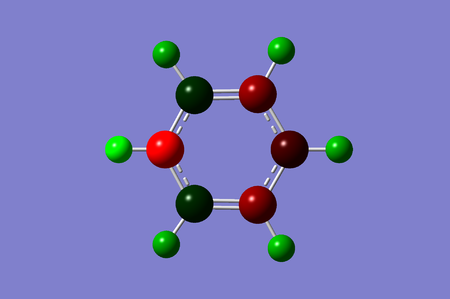
Charge range: -0.483 to 0.483. The first obvious observation from the below diagram is that no delocalisation of electrons take place between the ortho and meta carbon. The nitrogen, as we would expect, is electronegative, with a value of -0.476. The adjacent ortho carbon has to therefore be more electropositve with charges of 0.071 to compensate for the relatively large electronegativity of Boron. The meta carbons are electronegative, with charges -0.241, due to delocalisation. The para position has a lower electronegative of -0.122 as well due to delocalisation(albeit small) of electrons. Electrons do not localise between the ortho and meta carbon because the charge difference is too large for delocalisation to take place. The hydrogen charges are seen as below, which as explained above correspond directly to the charges of the adjacent atoms. Hydrogen charges: Nitrogen=0.483 ortho=0.285 meta=0.297 para=0.292.

Borazine
Optimisation
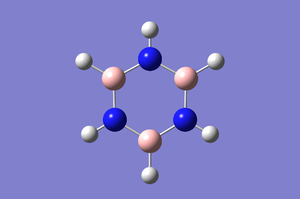
The D-space link for optimisation is here. [[16]] The Borazine was optimised and the optimisation energy is as such. The calculation shows that convergence takes place:
Item               Value     Threshold  Converged?
 Maximum Force            0.000089     0.000450     YES
 RMS     Force            0.000033     0.000300     YES
 Maximum Displacement     0.000250     0.001800     YES
 RMS     Displacement     0.000075     0.001200     YES
 Predicted change in Energy=-9.562055D-08
 Optimization completed.
    -- Stationary point found.
| File Name | BorazineOpt |
|---|---|
| File Type | .log |
| Calculation Type | FOPT |
| Calculation Method | RB3LYP |
| Basis Set | 6-31G(d,p) |
| Charge | 0 |
| Spin | Singlet |
| E(RB3LYP) | -242.68458759 a.u. |
| RMS Gradient Norm | 0.00006525 a.u. |
| Imaginary Freq | cell |
| Dipole Moment | 0.0000 Debye |
| Point Group | D3H |
| CPU Time | 2 minutes 42 seconds |
Frequency Analysis
The Frequency Analysis of the Molecule shows that the optimisation calculation was a success. The D-space link is here. [[17]]
Low frequencies ---   -7.0091   -6.8439   -6.3974   -0.0106    0.0490    0.1522
 Low frequencies ---  289.2333  289.2413  403.8327
The above low frequencies have values close to zero and within a plus minus 15 range, it is also increasing as it moves to the right, therefore it corresponds to the criteria of a good frequency analysis.
| File Name | BorazineFrequencyfull |
|---|---|
| File Type | .log |
| Calculation Type | FREQ |
| Calculation Method | RB3LYP |
| Basis Set | 6-31G(d,p) |
| Charge | 0 |
| Spin | Singlet |
| E(RB3LYP) | -242.68458759 a.u. |
| RMS Gradient Norm | 0.00006507 a.u. |
| Imaginary Freq | 0 |
| Dipole Moment | 0.0000 Debye |
| Point Group | D3H |
| CPU Time | 1 minute 27 seconds |
Population Analysis
NBO Analysis
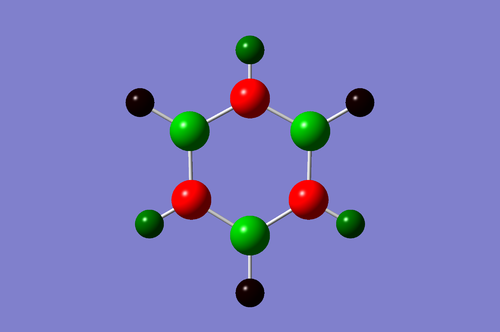
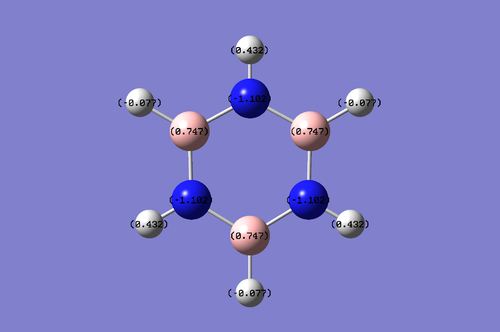
The charge ranges from -1.102 to 1.102. It is noted that the Nitrogen atoms in the molecule take a negative charge of -1.102 while the Boron is more electropositive, which takes a value of 0.747. The hydrogen atom attached to the electronegative nitrogen atom has a higher electropositivity because and it's electron density is withdrawn by the nitrogen atoms. Since the Boron atom is electropositve, it donates its electron density towards the Hydrogen atom attached to it and this enables the hydrogen atom to be electron rich.
It should be noted that both the hydrogen-boron pair and hydrogen-nitrogen pair adds up to form an equal net charge.
Overall Charge Distribution Analysis
Benzene: Charge range: -0.242 to 0.242. The carbon atoms in the benzene molecule are symmetrical, therefore we do not expect an uneven distribution of electron charge. The carbon atom is electronegative, with a natural charge of -0.242, due to delocalisation of electrons to the center of the benzene ring. The loss of electron from delocalisation causes the carbon atoms to be 'electron deficient'. The hydrogen attached to the carbon has an equal and opposite value of 0.242, which is expected, since the molecule is symmetric. The hydrogen will therefore donate its extra electrons to the adjacent carbon atoms.
Boratabenzene: Chage range: -0.225 to 0.225. The boron atom in boratazine is electropositive, with a value of 0.202. To compensate for the relatively high electropositivity, the carbon atoms delocalise unevenly with the two carbon atoms adjacent to boron having a higher electronegativity with value of -0.588. As we move further and further away from the boron atom, the electronegativity of the carbon atom decreases to -0.250. However they reach a final carbon point where it's electronegativity drops slightly to -0.340. This could be due to the fact that this carbon atom is directly opposite the electropositive boron atom, so any form of vibration will most likely cause a slight interaction between the carbon and the boron atom. Note that the charge of the hydrogen is directly related to the charge on it's adjacent atom, for the boron molecule, an electronegative hydrogen of -0.096 is there to compensate for the effects of the relatively high electropositivity. The ortho carbon's electrons have charges of 0.184, the meta carbon's electron have charges of 0.179 and finally the para hydrogen has a charge of 0.186.
Borazine: Charge range: -1.102 to 1.102. It is noted that the Nitrogen atoms in the molecule take a negative charge of -1.102 while the Boron is more electropositive, which takes a value of 0.747. The hydrogen atom attached to the electronegative nitrogen atom has a higher electropositivity because and it's electron density is withdrawn by the nitrogen atoms. Since the Boron atom is electropositve, it donates its electron density towards the Hydrogen atom attached to it and this enables the hydrogen atom to be electron rich.
It should be noted that both the hydrogen-boron pair and hydrogen-nitrogen pair adds up to form an equal net charge.
Pyadizine: Charge range: -0.483 to 0.483. The first obvious observation from the below diagram is that no delocalisation of electrons take place between the ortho and meta carbon. The nitrogen, as we would expect, is electronegative, with a value of -0.476. The adjacent ortho carbon has to therefore be more electropositve with charges of 0.071 to compensate for the relatively large electronegativity of Boron. The meta carbons are electronegative, with charges -0.241, due to delocalisation. The para position has a lower electronegative of -0.122 as well due to delocalisation(albeit small) of electrons. Electrons do not localise between the ortho and meta carbon because the charge difference is too large for delocalisation to take place. The hydrogen charges are seen as below, which as explained above correspond directly to the charges of the adjacent atoms. Hydrogen charges: Nitrogen=0.483 ortho=0.285 meta=0.297 para=0.292.
Overall Population Analysis and Comparison
HOMO 8 Energies: Overall, the more negative the energy is, the more stable it is. Therefore pyradinium has the most negative energy, threfore it is the most stable, followed by borazine, and then benzene. Finally the least stable MO is that of boratabenzene.
HOMO 8 Ordering: No ordering is seen for this HOMO level, all the MOs follow their supposed energy level.
HOMO8 Degeneracy: No degeneracy observed for this HOMO level, all the molecules have different bonding shapes.
HOMO8 Similarities and Differences: Overall, there is a great similarity in the phase changes of the molecular orbitals, with slight difference in their nodes. It also be noted that there are no non bonding orbitals present in the benzene MO, while there are non bonding orbitals present in the other molecules.
HOMO 12 Energies: Overall, the ordering of the levels are the same as explained above - the more negative the energies are the more stable.
HOMO12 Ordering: There is an ordering observed for Borazine at this level. By observing the orbitals, we noticed that there was a disconnection in correlation in the borazine HOMO12, therefore a lower energy level HOMO10 was selected for this comparison, reordering is present in this case.
HOMO12 Degeneracy: No degeneracy observed for this HOMO level, all the molecules have different bonding shapes.
HOMO12 Similarities and Differences: As above, the phases are similar but not the change in node.
HOMO16 Energies: Overall, the ordering of the levels are the same as explained above - the more negative the energies are the more stable the energy levels are.
HOMO16 Ordering: There is an ordering observed for Borazine at this level, as explained above HOMO 14 is selected instead of the expected HOMO16.
HOMO16 Degeneracy: Degenerate orbitals might be present in Boratabenzene and Borazine because their bonding patterns are very similar and their energies are very close together.
HOMO16 Similarities and Differences: As above.
Overall the electronegativity of the substituents will affect the entire MO diagram - by using substituents of different electronegative relative to the center atom, one can control the stabilisation energy and the destabilisation energy in the MO. The extent of change in these energies depend on the energy difference between the Frontier Orbitals, Orbital Coupling, and the extent of orbital overlap. The closer the energies the frontier energies, the better the orbital overlap, therefore the higher are the destabilisation and stabilisation energies.(in general, cases vary), and vice versa. However, it is worth noting that the antibonding MOs are most often destabilised more than the bonding Mos are stabilised. If necessary, one can use mathematical justification to predict a change in splitting energies(schrodingers equation).
By making use of the electronegativity of a substituent relative to that of the central atom, we can also control the electron spin, or how easy an electron can be promoted, because we can basically change the energy levels of the Molecular Orbitals. (note that the more electronegative a substituent the lower is its energy level.)
Summary
Gaussian is an extremely powerful tool that can enable us to carry out tedious mathematics.
Reference
1.G. Leroy, M. Sana, C. Wilante , "Evaluation of Bond Energy Terms for the Various Types of Boron-Nitrogen Bonds", Theor Chim Acta, 1983, 85, 1555.
2.Erciyes University Journal of the Institute of Science and Technology, Cilt Volume 27, Issue 2, April-2011 ISSN 1012-2354


