Rep:Mod:Si Jia-Lee020992391003
Third Year Computational Lab
BH3:B3LYP/3-21G
Optimisation log file here
| Summary Data | Convergence | Jmol | |||
|---|---|---|---|---|---|
| File:SJL_bh3_summary.txt |
Item Value Threshold Converged? Maximum Force 0.000217 0.000450 YES RMS Force 0.000105 0.000300 YES Maximum Displacement 0.000919 0.001800 YES RMS Displacement 0.000441 0.001200 YES |
|
BH3:B3LYP/6-31G(d,p)
Optimisation log file here
GaBr3:B3LYP/LANL2DZ
optimisation file: DOI:10042/193789
| summary data | convergence | Jmol | |||
|---|---|---|---|---|---|

|
Item               Value     Threshold  Converged?
 Maximum Force            0.000000     0.000015     YES
 RMS     Force            0.000000     0.000010     YES
 Maximum Displacement     0.000003     0.000060     YES
 RMS     Displacement     0.000002     0.000040     YES
 Predicted change in Energy=-1.307727D-12
 Optimization completed.
    -- Stationary point found.
|
|
BBr3:B3LYP/6-31G(d,p)LANL2DZ
optimisation file: DOI:10042/193791
| Summary data | Convergence | Jmol | |||
|---|---|---|---|---|---|

|
 Item               Value     Threshold  Converged?
 Maximum Force            0.000008     0.000015     YES
 RMS     Force            0.000005     0.000010     YES
 Maximum Displacement     0.000036     0.000060     YES
 RMS     Displacement     0.000024     0.000040     YES
 Predicted change in Energy=-4.086283D-10
 Optimization completed.
    -- Stationary point found.
|
|
Under molecular orbital theory[1], a bonding orbital arises from the constructive interference of neighbouring atomic orbitals while an antibonding orbital arises from their destructive interference. The energy of the molecule is lowered relative to that of the separated atoms if the bonding orbital is occupied by electrons. An electron that occupies the bonding orbital has an enhanced probability of being found in the internuclear region (from orbital overlap) and can strongly interact with both nuclei, resulting in the formation of a bond. The energy in a bond is determined by their dissociation energy. This can be determined by the amount of stabilisation energy in the molecular orbital as compared to the initial fragment/atomic orbital. The stabilisation energy is dependent on the energy difference between the fragment orbitals, orbital coupling and the extent of orbital overlap. Degenerate orbitals have a large splitting energy. As the difference in electronegativity increases between the fragment orbitals, the spliiting energy decreases and there is little stabilisation. The magnitude of the orbital overlap depends on the relative location, orientation and diffusivity of the orbitals involved. The more diffuse an orbital, the weaker its interaction with other orbitals.
There are three common types of bonding, namely ionic bonding, covalent bonding and dative bonding. Ionic bond is formed between an element of low ionisation potential and an element of high electron affinity. Complete transfer of electrons occurs between the elements and both components attain stable noble gas electron configuration. The ionic lattice is held together by strong coulomb forces. Covalent bond is formed between elements that do not differ strongly in ionisation energy and electron affinity. Electrons are shared between the elements and result in weak intermolecular forces of attraction. The differences in electronegativities between the atoms influence the polarity of a bond and therefore determine the ionic or covalent character of a particular molecule. The polarising power of an atom is proportional to its charge and inversely proportional to its volume. For example, a strong ionic bond with high lattice energy is formed between the small and electropositive aluminium and electronegative bromine. A weaker ionic bond is formed between the larger sodium atom and bromine atom, resulting in a less polarised bond and an increase in covalent character of the bond. CO2 and CH4 are examples of molecules with weak covalent bonds. In macromolecules such as diamond, the atoms in a giant covalent lattice are held together by strong directional covalent bonds which give it great stability. A weak covalent dative bond is formed when the two electrons in a bond comes from the same atom.
A combination of methods must be utilised to determine the formation of a bond and the corresponding bond length. X-ray diffraction can be utilised to determine bond length and strength. The Schrodinger equation can be solved under the Born-Oppenheimer approximation to plot a potential energy diagram and determine the lowest energy structure. This relates to the equilibrium stable structure which indicates formation of a bond. IR spectroscopy can determine the vibrational frequencies and corresponding force constant of the motions of the nuclei.
The range of bond energies that determines whether a bond is strong, medium or weak differs for different atoms.The N2 triple bond is a strong bond (942 kJ/mol), C=C is a medium bond(602 kJ/mol) while a Br-Br is a weak bond(377 kJ/mol). [2] Gaussview does not draw in the bonds as expected for some structures as the program determines the formation of a bond based on pre-determined distance criteria. When the distance calculated exceeds the pre-defined value, the bond will not be drawn. "Bonds" in gausview are therefore a structural convenience. Therefore, a combination of methods such as X-ray diffraction, IR spectroscopy etc. should be utilised to determine the formation of a bond.
Geometry Comparison
| BH3 | GaBr3 | BBr3 | |
|---|---|---|---|
| r(E-X) Å | 1.19 | 2.35 | 1.93 |
| θ(X-E-X) degrees(º) | 120.0 | 120.0 | 120.0 |
For a BX3 molecule, a change in ligand from H to Br results in an increase in bond distance of B-X. Both Br and H forms a single bond with the central B atom. Br (195 pm) is a period 3 element and has a larger van der waals radius than H atom (120 pm). There is greater orbital size mismatch between B and Br than B and H atom, leading to weaker B-Br bond and corresponding longer B-Br bond distance.
There is a larger electronegativity difference between the B and Br atom as compared to the B and H atom. This leads to larger polarity in the B-Br bond, where the B holds a partial positive charge and the Br holds a partial negative charge. The resulting bond is polar covalent and aid in increasing the bond strength of the atom.
For a MBr3 molecule, a change in the central element from Ga to B leads to an decrease in bond distance of the M-Br bond. Both atoms are in group 3 but Ga is in period 3 and has a larger atomic radius than B. This leads to a longer and weaker Ga-Br bond compared to B-Br.
Bond angles of all 3 molecules are calculated to be 120.0⁰, with accuracy to 1 decimal place. All molecules display D3h symmetry and are trigonal planar in shape.
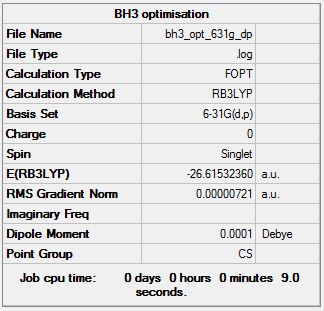
BH3:B3LYP/6-31G(d,p)
Molecule constrained from CS to D3H point group for frequency analysis.
Frequency file: here
| summary data | low modes |
|---|---|

|
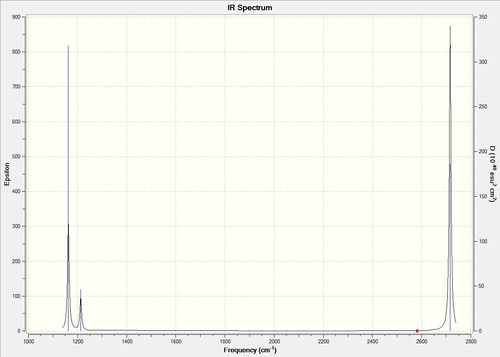
Low frequencies --- -14.5183 -14.5142 -10.8197 0.0003 0.0169 0.3454 Low frequencies --- 1162.9508 1213.1230 1213.1232 |
Vibrational spectrum for BH3
| wavenumber | Intensity | IR active? | Type | Animation |
| 1163 | 93 | yes | bend | 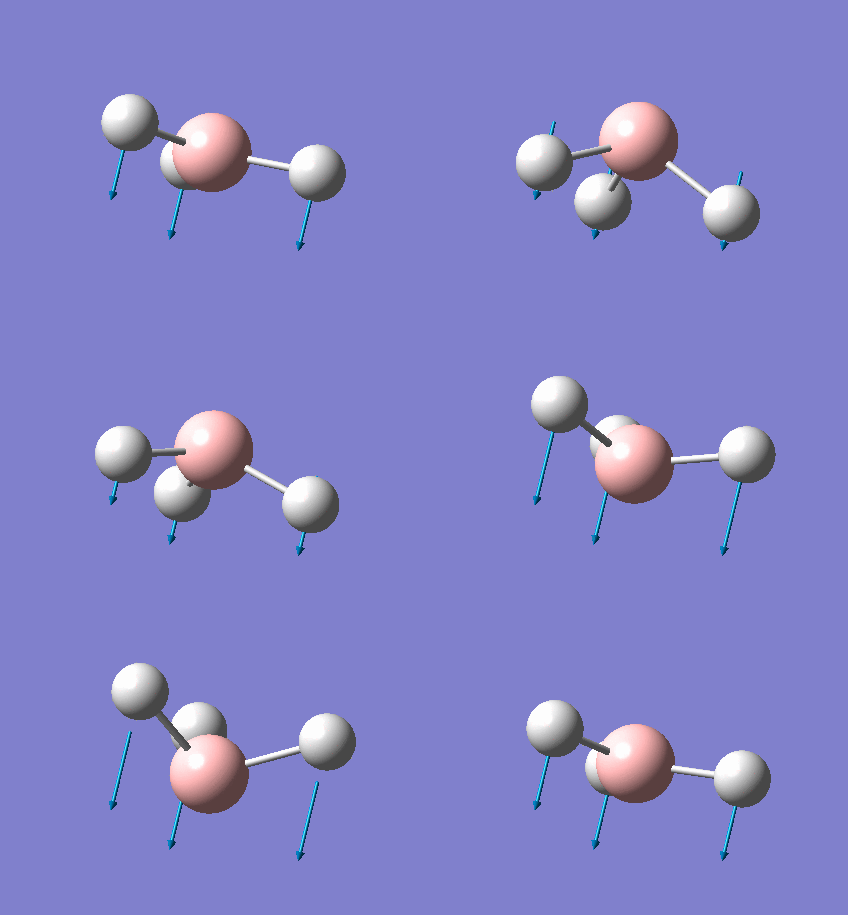
|
| 1213 | 14 | very slight | bend | 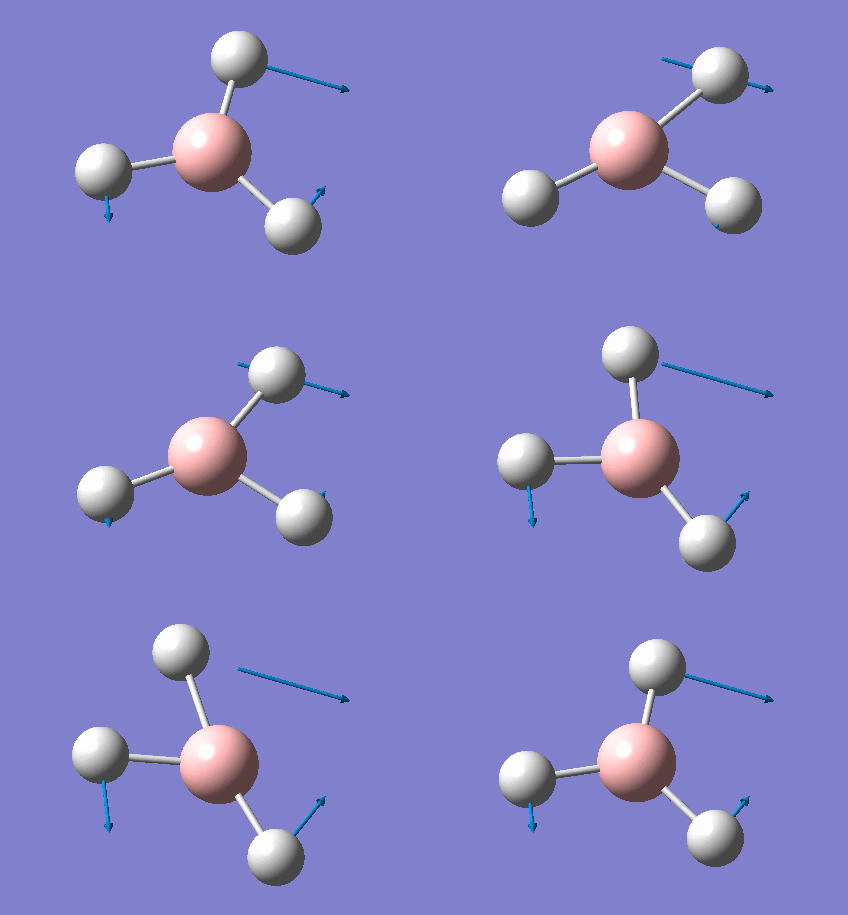
|
| 1213 | 14 | very slight | bend | 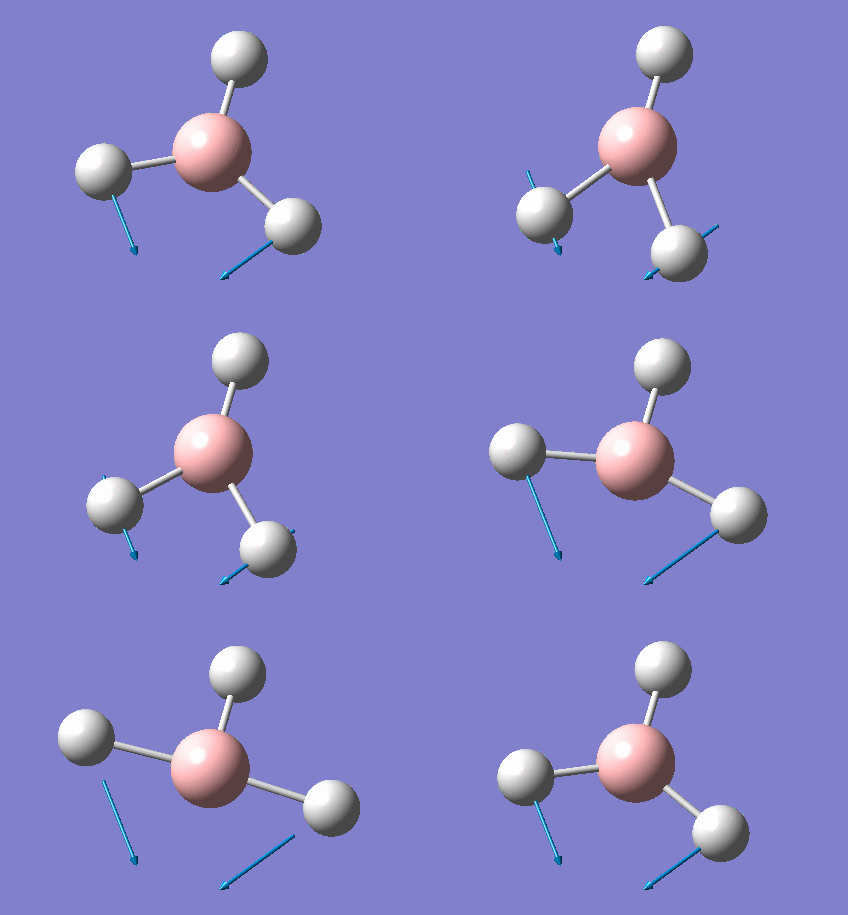
|
| 2583 | 0 | no | stretch | 
|
| 2716 | 126 | yes | stretch | 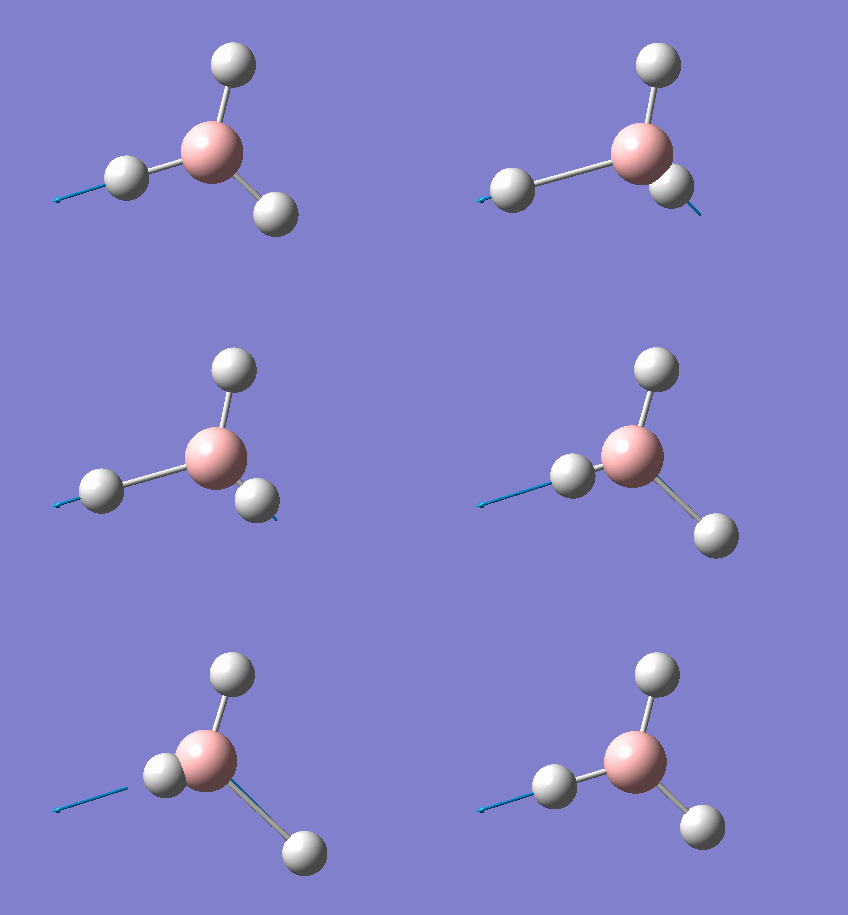
|
| 2716 | 126 | yes | stretch | 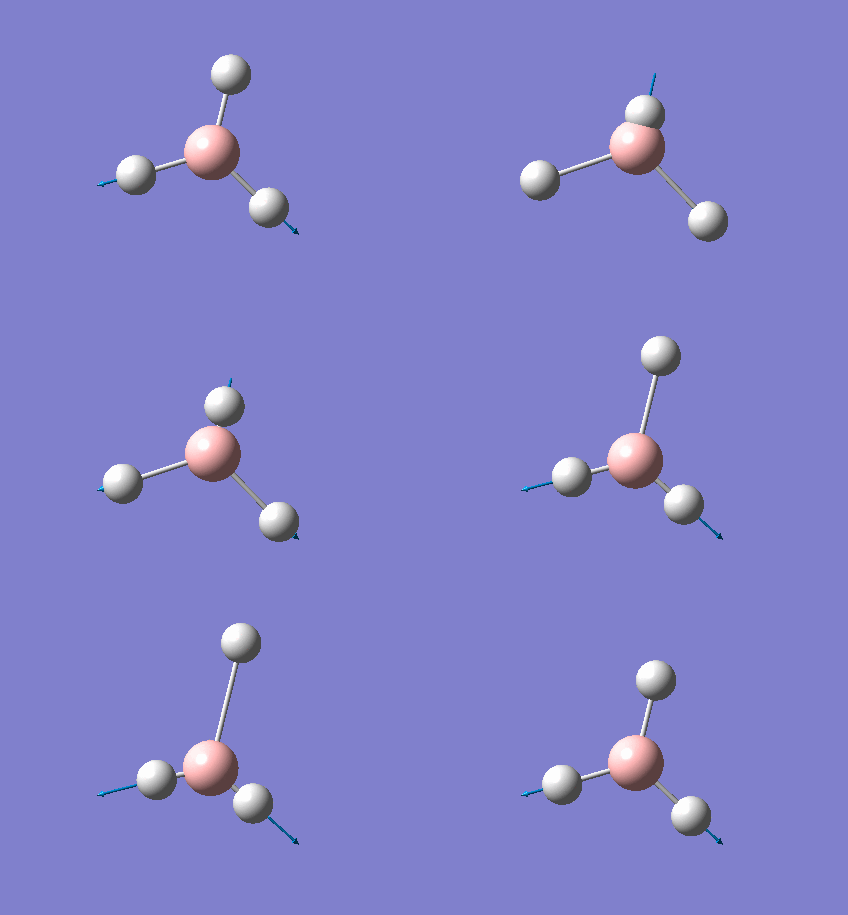
|
In the spectrum, 3 vibrational peaks are observed when there are 6 vibrations in total. The vibration at the frequency of 2583 cm-1 was not observed as it is not IR active. Asymmetric stretch of all 3 B-H bonds in the trigonal planar, D3h molecule leads to zero change in the molecule's dipole moment during the vibration. The net dipole moments cancel each other and the molecule is IR inactive. The two vibrations at 1213 cm-1 resulting from bending are degenerate and give rise to a single peak. The two vibrations at 2716 cm-1 resulting from stretching are degenerate and give rise to a single peak in the spectrum.
Vibrational spectrum for GaBr3
Frequency file: here
| summary data | low modes |
|---|---|

|
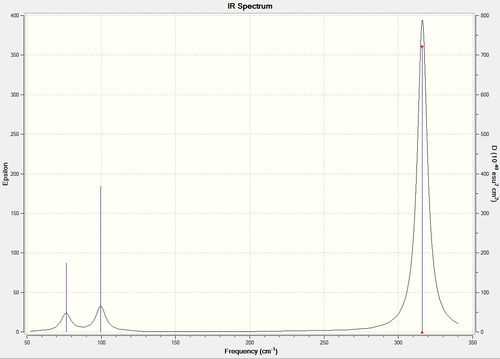
Low frequencies --- -1.4878 -0.0015 -0.0002 0.0096 0.6540 0.6540 Low frequencies --- 76.3920 76.3924 99.6767 |
Vibrational spectrum for GaBr3
| wavenumber | Intensity | IR active? | type |
| 76 | 3 | very slight | bend |
| 76 | 3 | very slight | bend |
| 100 | 9 | very slight | bend |
| 197 | 0 | no | stretch |
| 316 | 57 | yes | stretch |
| 316 | 57 | yes | stretch |
Similar to BH3, 3 vibrational peaks are observed when there are 6 vibrations in total. The vibration at the frequency of 197 cm-1 was not observed as it is not IR active. Asymmetric stretch of all 3 Ga-Br bonds in the trigonal planar, D3h molecule leads to zero change in the molecule's dipole moment during the vibration. The net dipole moments cancel each other and the molecule is IR inactive. The two vibrations at 76 cm-1 resulting from bending are degenerate and give rise to a single peak. The two vibrations at 316 cm-1 resulting from stretching are degenerate and give rise to a single peak in the spectrum.
The values of frequencies for BH3 are in the range of 1163-1716 cm-1 while the values of frequencies for GaBr3 are in the range of 76 to 316 cm-1. The large difference in the value of the frequencies for BH3 compared to GaBr3 is due to the significantly larger reduced mass of Ga-Br compared to B-H. The frequency of oscillation is proportional to the spring constant and inversely proportional to its reduced mass. Although the spring constant is larger for GaBr3, the significantly larger reduced mass leads to a lower frequency observed.
Analysis was conducted for the A2" umbrella motion in both molecules. The vibration of A2" symmetry in BH3 was at the lowest frequency of 1163 cm-1 at an intensity of 93 KM/mol. However, a reordering of modes was observed for GaBr3 where the vibration of A2" symmetry was at a higher frequency than its degenerate E’ bending modes. The frequency and intensity observed for GaBr3 was 100 cm-1 at an intensity of 9 KM/mol.
The displacement vectors for both molecules in the A2’’ symmetry only show a displacement in the z coordinate from its equilibrium position during the vibration. This is indicative of the umbrella mode.
| Atom 1 (B or Ga) | Atom 2(H or Br) | Atom 3(H or Br) | Atom 4(H or Br) | |
|---|---|---|---|---|
| BH3 | 0.16 | -0.57 | -0.57 | -0.57 |
| GaBr3 | 0.89 | -0.26 | -0.26 | -0.26 |
As shown in the table above, there is a greater displacement of the hydrogen atom as compared to the boron atom in the BH3 molecule. This is because the hydrogen atom has a smaller atomic mass than B, resulting in a larger displacement of the lighter H atom as compared to the heavier B. For the GaBr3 molecule, there is greater displacement of the Br atom in the z-coordinate as compared to the Ga atom. This is due to the smaller atomic mass of Br compared to Ga that results in a larger displacement at a specific energy.
When a structure is optimised using a specific method and basis set, a stable point is obtained by repeatedly solving the Schrödinger equation for the nuclear positions and electrons and finding the lowest energy structure. As the system moves there will be a sequence of different energies which are dependent on the changing coordinates of the nuclei and electrons. When a higher basis set is utilised, the number of functions used to describe the electronic structure increased and there will be a change in the structure of the molecule (e.g. bond length and bond angle). Therefore, the same method and basis set are required for both the optimisation and frequency analysis calculations such that an accurate and fair comparison can be made and to ensure that the frequencies calculated are for the optimised structure.
The purpose of a frequency analysis is to confirm that the minium structure was obtained after optimisation. The frequency analysis is essentially the second derivative of the potential energy surface. A minimum point (indicating ground state) is obtained if the frequencies are all positive. If one of the frequencies is negative, a maximum point is present which indicates the presence of a transition state. The calculation of more negative frequencies indicates that a critical point was not found and the optimisation has not completed or has failed. The frequency analysis also provides the IR and Raman modes to compare with experiment.
For every non-linear molecule, there are 3N-6 vibrational frequencies.The low frequencies listed are these "-6" and they represent the motions of the center of mass of the molecule. The closer the value is to zero, the better the method and optimisation of the structure.
Molecular Orbitals of BH3:B3LYP/6-31G(d,p)
Population Analysis: DOI:10042/193817
Molecular Diagram:
NH3:B3LYP/6-31G(d,p)
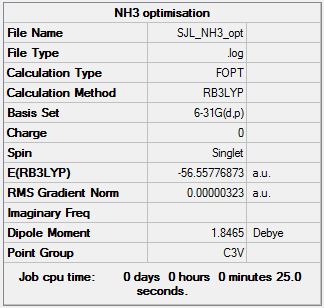
Optimisation
Optimisation log file here
| Summary Data | Convergence | Jmol | |||
|---|---|---|---|---|---|
|
      Item                  Value     Threshold  Converged?
 Maximum Force            0.000006     0.000450     YES
 RMS     Force            0.000004     0.000300     YES
 Maximum Displacement     0.000012     0.001800     YES
 RMS     Displacement     0.000008     0.001200     YES
 Predicted change in Energy=-9.841966D-11
 Optimization completed.
    -- Stationary point found.
|
|
Frequency
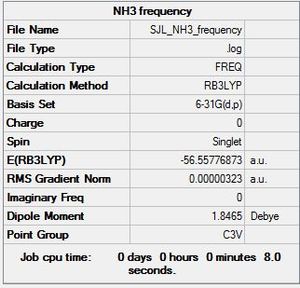
Molecule constrained to C3V point group for frequency analysis.
Frequency file: here
| summary data | low modes |
|---|---|
|
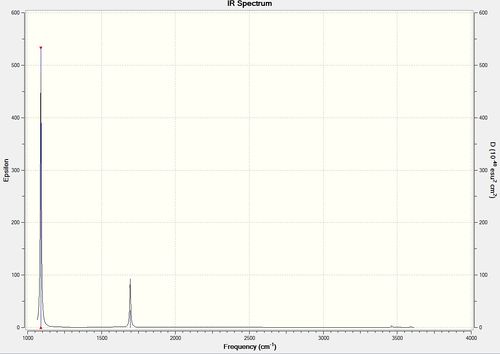
Low frequencies --- -0.0138 -0.0030 0.0014 7.0781 8.0927 8.0932 Low frequencies --- 1089.3840 1693.9368 1693.9368 |
Vibrational spectrum for NH3
| wavenumber | Intensity | IR active? | type |
| 1089 | 145 | yes | bend |
| 1694 | 14 | very slight | bend |
| 1694 | 14 | very slight | bend |
| 3461 | 1 | no | stretch |
| 3590 | 0 | no | stretch |
| 359 | 0 | no | stretch |
Molecular Analysis for NH3
Population Analysis: DOI:10042/193818
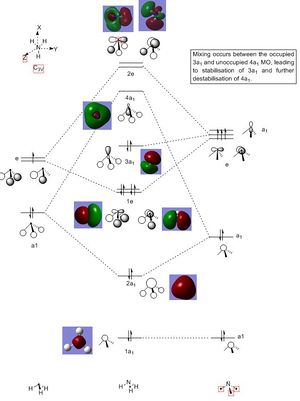
Molecular Diagram:
There are no significant differences between the real and LCAO MOs. The qualitative MO theory is accurate and useful to a certain extent and provides a guide to the bonding in compound. However, a calculation of the molecular orbitals is useful when it is hard to predict the energy and ordering of the molecular orbitals. This occurs when molecular orbitals are close in energy or when mixing of orbitals occur. A definitive and precise energy ordering of the molecular orbitals can be calculated, resulting in a better understanding of the interaction of the bonding and antibonding orbitals.
NBO Analysis for NH3
Charge range: -1.0 to +1.0
| N atom | H atom | |
|---|---|---|
| Specific NBO Charge | -1.125 | 0.375 |
The nitrogen atom is electronegative and therefore highly negatively charged (bright red). The H atoms are positively-charged and bright green in colour.
BH3NH3:B3LYP/3-21G
Optimisation log file here
| Summary Data | Convergence | Jmol | |||
|---|---|---|---|---|---|

|
       Item               Value     Threshold  Converged?
 Maximum Force            0.000087     0.000450     YES
 RMS     Force            0.000032     0.000300     YES
 Maximum Displacement     0.000361     0.001800     YES
 RMS     Displacement     0.000193     0.001200     YES
 Predicted change in Energy=-5.541366D-08
 Optimization completed.
    -- Stationary point found.
|
|
BH3NH3:B3LYP/6-31G(d,p)
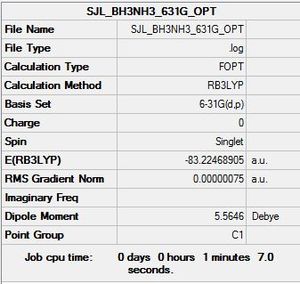
Optimisation log file here
| Summary Data | Convergence | Jmol | |||
|---|---|---|---|---|---|
|
Item Value Threshold Converged? Maximum Force 0.000002 0.000015 YES RMS Force 0.000001 0.000010 YES Maximum Displacement 0.000030 0.000060 YES RMS Displacement 0.000012 0.000040 YES Predicted change in Energy=-2.866573D-11 |
|
Frequency
Molecule constrained from C1 to C3V point group for frequency analysis.
Frequency file: here
| summary data | low modes |
|---|---|

|
Low frequencies --- -2.8637 -1.2089 -0.0016 -0.0015 0.0013 3.5847 Low frequencies --- 263.3683 632.9737 638.4492 |
Total Energies
Energies computed from B3LYP/6-31G(d,p) optimised structures where scf=tight.
E(NH3)= -56.5577687 a.u.
E(BH3)= -26.6153236 a.u.
E(NH3BH3)= -83.2246891 a.u.
ΔE=E(NH3BH3)-[E(NH3)+E(BH3)]=-0.0515968 AU = -135 kJ/mol (energy error of 10 kJ/mol)
The association of NH3 and BH3 to form a B-N bond within NH3BH3 is a weak bond. This is weaker than the bond energy of the weak Br-Br bond defined above. The dissociation energy needed to break the bond is weak at 135 kJ/mol.
Project: Lewis acids and bases
Isomers and symmetry
Al2Cl4Br2:B3LYP/ Al, Cl:6-31G(d,p), Br: PPLANL2DZ
Isomer 1
Symmetry: C2v
Optimisation file: DOI:10042/193845
| Summary data | Convergence | Jmol | |||
|---|---|---|---|---|---|

|
Item Value Threshold Converged? Maximum Force 0.000002 0.000015 YES RMS Force 0.000000 0.000010 YES Maximum Displacement 0.000013 0.000060 YES RMS Displacement 0.000005 0.000040 YES Predicted change in Energy=-1.389523D-11 Optimization completed. |
|
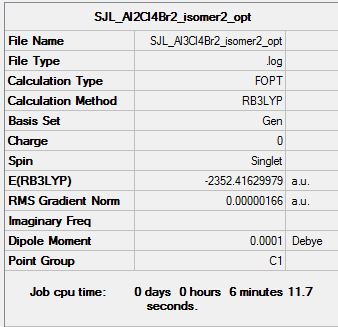
Isomer 2
Symmetry: C2h
Optimisation file: DOI:10042/193846
| Summary data | Convergence | Jmol | |||
|---|---|---|---|---|---|
|
Item               Value     Threshold  Converged?
 Maximum Force            0.000003     0.000015     YES
 RMS     Force            0.000001     0.000010     YES
 Maximum Displacement     0.000040     0.000060     YES
 RMS     Displacement     0.000013     0.000040     YES
 Predicted change in Energy=-1.687443D-10
 Optimization completed.
    -- Stationary point found.
|
|
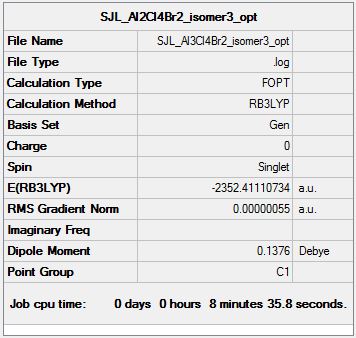
Isomer 3
Symmetry: C1
Optimisation file: DOI:10042/193847
| Summary data | Convergence | Jmol | |||
|---|---|---|---|---|---|
|
Item               Value     Threshold  Converged?
 Maximum Force            0.000000     0.000015     YES
 RMS     Force            0.000000     0.000010     YES
 Maximum Displacement     0.000007     0.000060     YES
 RMS     Displacement     0.000002     0.000040     YES
 Predicted change in Energy=-2.663873D-12
 Optimization completed.
    -- Stationary point found.
|
|
Isomer 4
Symmetry: C1
Optimisation file: DOI:10042/193848
| Summary data | Convergence | Jmol | |||
|---|---|---|---|---|---|

|
Isomer 4
Item               Value     Threshold  Converged?
 Maximum Force            0.000003     0.000015     YES
 RMS     Force            0.000001     0.000010     YES
 Maximum Displacement     0.000046     0.000060     YES
 RMS     Displacement     0.000020     0.000040     YES
 Predicted change in Energy=-1.300007D-10
 Optimization completed.
    -- Stationary point found.
|
|
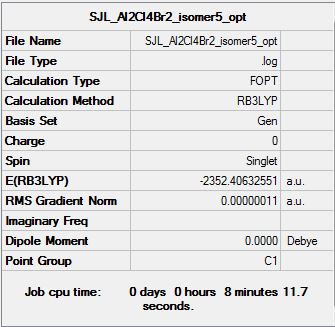
Isomer 5
Symmetry: D2h
Optimisation file: DOI:10042/193849
| Summary data | Convergence | Jmol | |||
|---|---|---|---|---|---|
|
Isomer 5
Item               Value     Threshold  Converged?
 Maximum Force            0.000000     0.000015     YES
 RMS     Force            0.000000     0.000010     YES
 Maximum Displacement     0.000038     0.000060     YES
 RMS     Displacement     0.000014     0.000040     YES
 Predicted change in Energy=-2.576833D-12
 Optimization completed.
    -- Stationary point found.
|
|
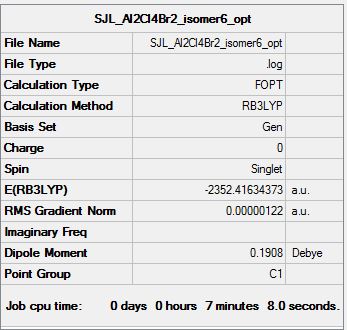
Isomer 6
Symmetry: C2v
Optimisation file: DOI:10042/193850
| Summary data | Convergence | Jmol | |||
|---|---|---|---|---|---|
|
Item               Value     Threshold  Converged?
 Maximum Force            0.000004     0.000015     YES
 RMS     Force            0.000001     0.000010     YES
 Maximum Displacement     0.000030     0.000060     YES
 RMS     Displacement     0.000010     0.000040     YES
 Predicted change in Energy=-1.215141D-10
 Optimization completed.
    -- Stationary point found.
|
|
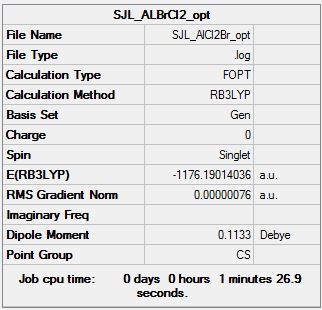
AlCl2Br:B3LYP/ Al, Cl:6-31G(d,p), Br: PPLANL2DZ
Optimisation file: DOI:10042/193861
| Summary data | Convergence | Jmol | |||
|---|---|---|---|---|---|
|
Item               Value     Threshold  Converged?
 Maximum Force            0.000002     0.000015     YES
 RMS     Force            0.000001     0.000010     YES
 Maximum Displacement     0.000014     0.000060     YES
 RMS     Displacement     0.000010     0.000040     YES
 Predicted change in Energy=-1.517861D-11
 Optimization completed.
    -- Stationary point found.
|
|
Energy Analysis
| Energy/ a.u. | Energy/ kJmol-1 | Energy change relative to lowest E isomer/ kJ mol-1 | |
|---|---|---|---|
| Isomer 1 | |||
| Isomer 2 | |||
| Isomer 3 | |||
| Isomer 4 | |||
| Isomer 5 | |||
| Isomer 6 |
The conformers with the lowest energy and largest stability are isomer 1, 2 and 6 where the 2 Cl atoms are part of the two bridging 3 centres-2 electrons bonds. Isomers 3 and 4 are less stable due as they possess 1 bridging Cl atom and 1 bridging Br atom. As the bromine atom has a larger atomic radius than the chlorine atom, this leads to greater steric repulsion and a longer bridging bond distance between the two aluminium atoms. Isomer 5 has the largest energy and is the least stable as it possess 2 bridging Br atoms which further increase the steric repulsion and bond distance between the Al stoms.
Dissociation Energy of isomer 6 (lowest energy conformer) into 2AlCl2Br
E(AlCl2Br)= -1176.1901404 a.u. E(Al2Cl4Br2)= -2352.416344 a.u.
ΔE=E(Al2Cl4Br2)-2E(AlCl2Br)= -0.0360632 a.u.= -95 kJ/mol
The product is more stable than the isolated monomers as the change in energy is of a negative value. Therefore, the product has a lower energy than the isolated products and is more stable.
Frequency Analysis
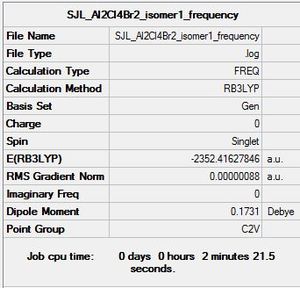
Isomer 1
Molecule constrained from C1 to C2V point group for frequency analysis.
Frequency file: here
| summary data | low modes |
|---|---|
|
Low frequencies --- -1.3211 -0.7545 -0.0033 -0.0014 0.0020 2.2375 Low frequencies --- 17.4985 51.1469 78.5269 |
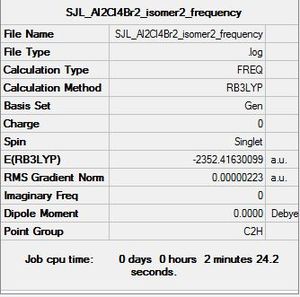
Isomer 2
Molecule constrained from C1 to C2h point group for frequency analysis.
Frequency file: here
| summary data | low modes |
|---|---|
|
Low frequencies --- -0.7982 -0.7679 0.0025 0.0031 0.0034 2.1630 Low frequencies --- 18.3081 49.2181 72.9028 |
Isomer 3
Molecule constrained to C1 point group for frequency analysis.
Frequency file: here
| summary data | low modes |
|---|---|

|
Low frequencies --- -0.0514 -0.0006 -0.0006 0.0007 1.1097 1.8048 Low frequencies --- 16.9430 55.9194 80.0643 |
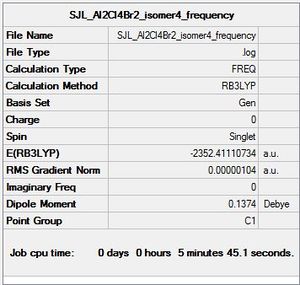
Isomer 4
Molecule constrained to C1 point group for frequency analysis.
Frequency file: here
| summary data | low modes |
|---|---|
|
Low frequencies --- -0.2500 -0.0015 0.0005 0.0021 1.1053 1.7993 Low frequencies --- 16.9403 55.9183 80.0639 |
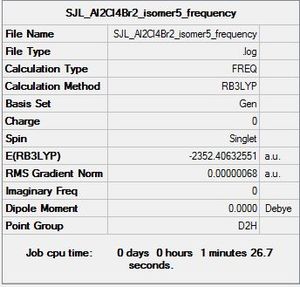
Isomer 5
Molecule constrained from C1 to D2h point group for frequency analysis.
Frequency file: here
| summary data | low modes |
|---|---|
|
Low frequencies --- -0.8540 0.0035 0.0045 0.0051 1.3333 1.4385 Low frequencies --- 16.0760 63.6281 86.1151 |
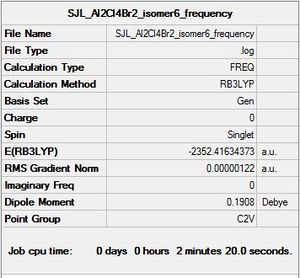
Isomer 6
Molecule constrained from C1 to C2V point group for frequency analysis.
Frequency file: here
| summary data | low modes |
|---|---|
|
Low frequencies --- -0.8331 -0.5980 -0.0035 -0.0032 -0.0015 2.0360 Low frequencies --- 18.6229 51.2070 72.2009 |
Vibrational spectral for isomers
Isomer 1
C2V symmetry
Isomer 2
C2h symmetry
Isomer 3
C1 symmetry
Isomer 4
C1 symmetry
Isomer 5
D2h symmetry
Isomer 6
C2v symmetry
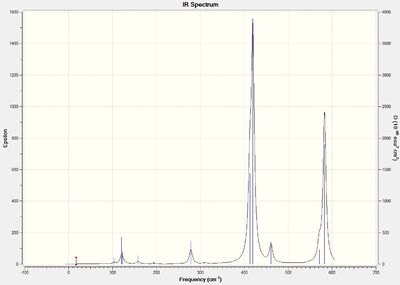
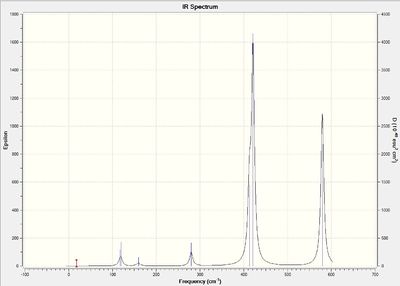
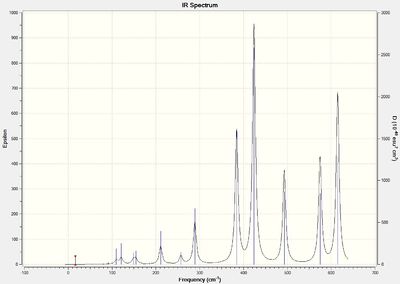
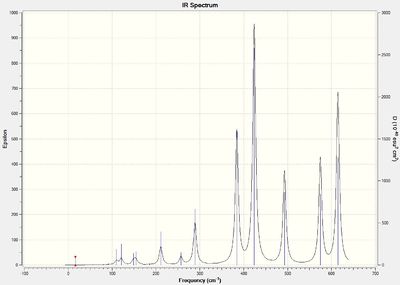
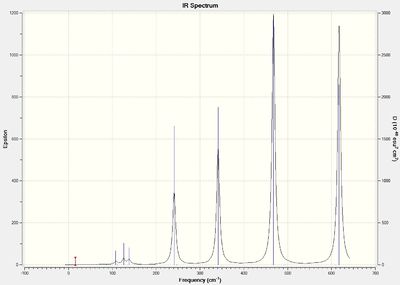
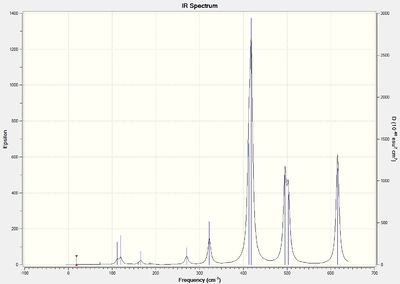
An IR vibration is allowed when a change in dipole moment is observed. For isomer 1, the terminal Cl atoms and Br atoms are pointing in the same direction (cis). For isomer 2, the terminal Cl atoms and Br atoms are pointing in opposite directions (trans). Using symmetry, the cis-isomer 1 will exhibit 2 additional stretching bands at 461 cm-1 and 571 cm-1 from terminal Al-Br/Al-Cl symmetric stretch and asymmetric stretch respectively. These bands are not IR active for the trans-isomer 2 as the stretches cancels out each other and leads to no change in the net dipole moment. Isomer 6 has two terminal Br atoms on 1 end and two Cl atoms on the other. It is less symmetrical than isomer 1 and 2 and has additional IR active vibrations from the asymmetric stretch of the bridging Cl atoms and bending of the terminal aluminium-halide bonds.
Isomer 5 is highly symmetrical due to the 4 terminal Cl atoms and 2 bridging Br atoms. Therefore, most vibrations often lead to a cancellation of dipole moments and does not show up in the spectrum.
The IR spectra for isomers 3 and 4 shows the largest number of bands. Both isomers exhibit C1 symmetry and does not exhibit any additional symmetrical operations or elements. Therefore, all vibrations from bents or stretches are IR active. It is noted that some frequencies will not be evident on the spectra due to the low intensities of the vibrations (mostly for low frequencies).
Discussion of Al-Br stretch
| Frequency/cm-1 | Intensity | Animation | |
|---|---|---|---|
| Isomer 1 | 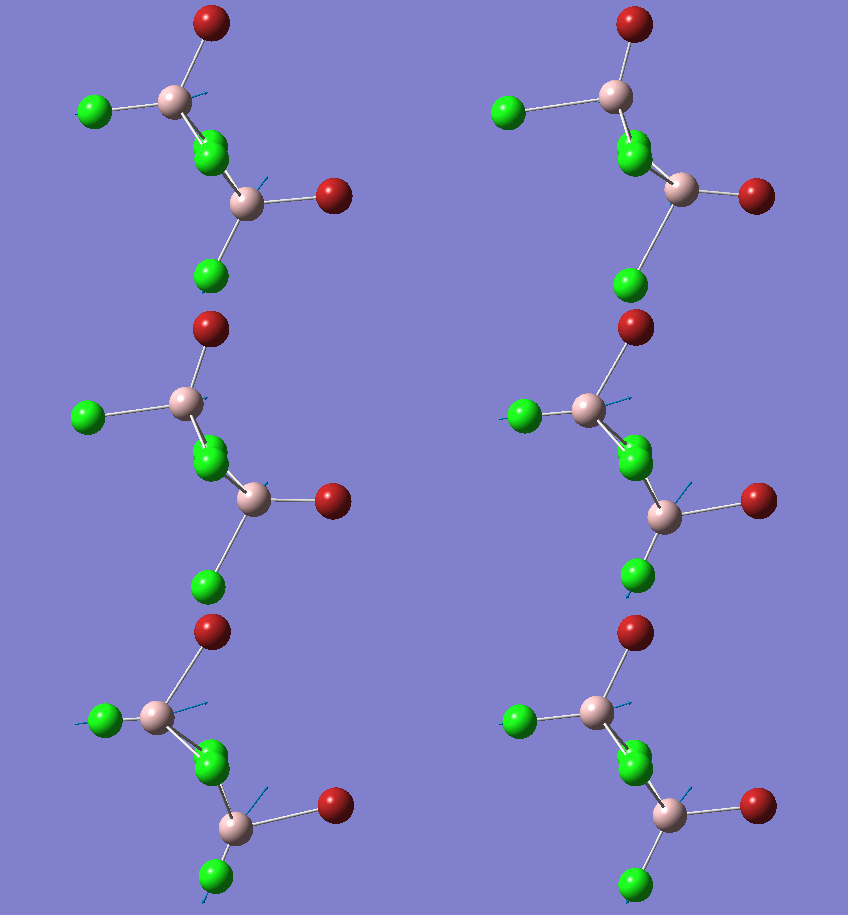
| ||
| Isomer 2 | 
| ||
| Isomer 3 | 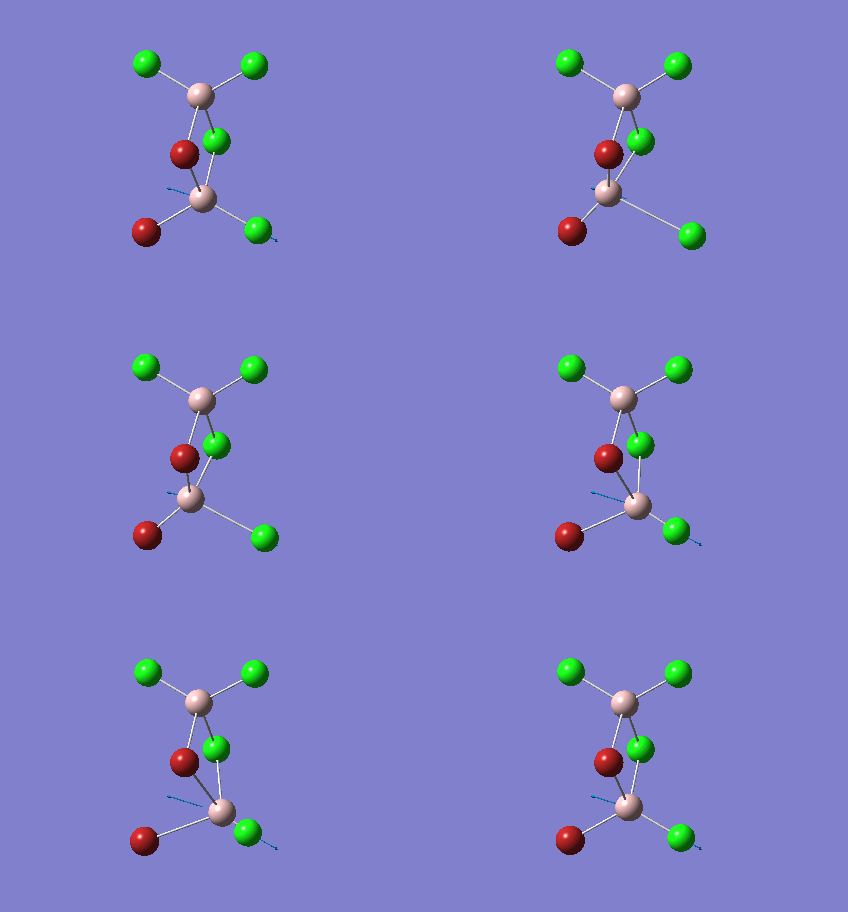
| ||
| Isomer 4 | 
| ||
| Isomer 6 | 
|
With respect to isomer 1 and 2, it can be observed that asymmetric stretch of terminal Al-Br at both ends of the molecule occurs concurrently at 583 cm-1. For isomers 3 and 4, asymmetric stretch at 575 cm-1 was more evident at the end where 1 terminal Br atom reside compared to the terminal end with 2 Cl atoms. Large asymmetric stretch at the other end of the molecule can only be observed at a larger frequency of 615 cm-1. This is because Br has a larger atomic mass than the Cl atom which results in a larger reduced mass of the Al-Br bond compared to the Al-Cl bond. The frequency is inversely proportional to the reduced mass and thus a lower frequency is required for the asymmetric stretch of the Al-Br terminal end as compared to the 2 Al-Cl terminal end. For isomer 6, a smaller frequency of 495 cm-1 was observed which can be attributed to the larger reduced mass of the 2 terminal Al-Br bond. An uneven asymmetric stretch is observed at both end of the molecule and the asymmetric stretch of the end with 2 Al-Cl atoms can only be observed at a higher frequency of 616 cm-1.
| Frequency/cm-1 | Intensity | Animation | |
|---|---|---|---|
| Isomer 3 | 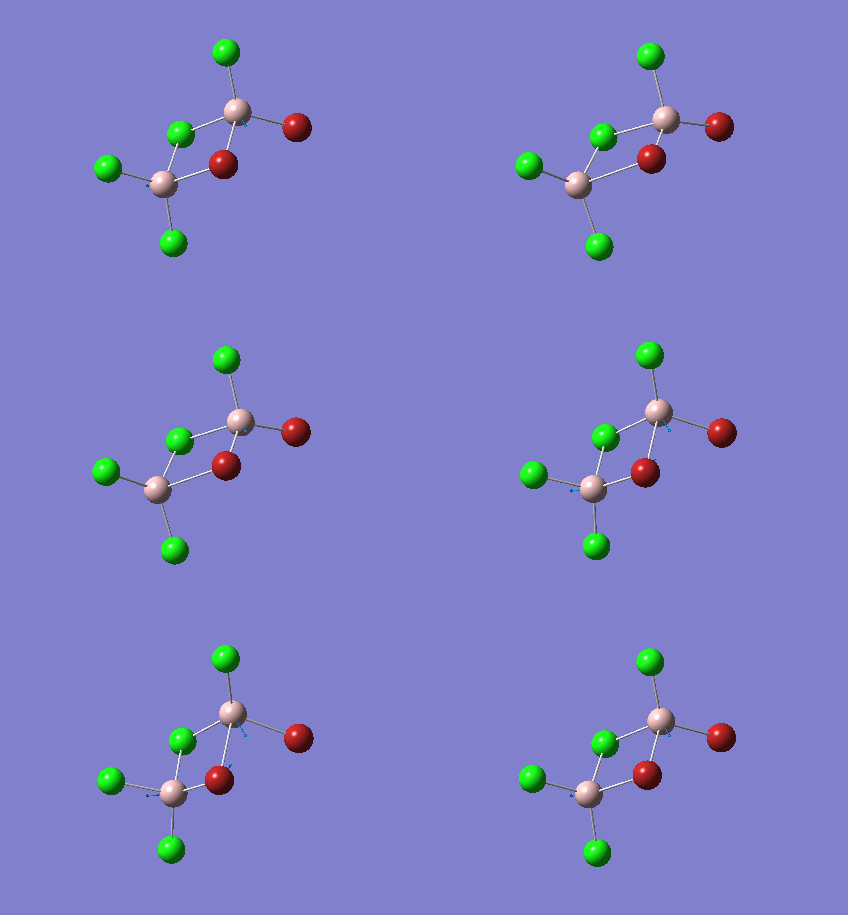
| ||
| Isomer 4 | 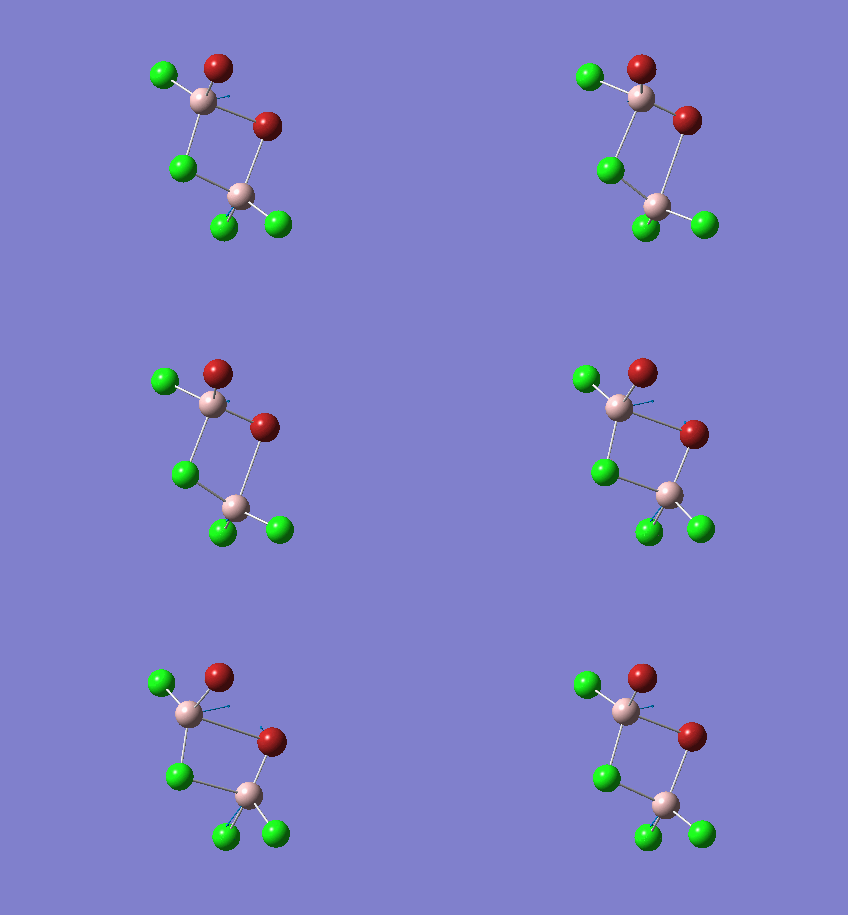
| ||
| Isomer 5 | 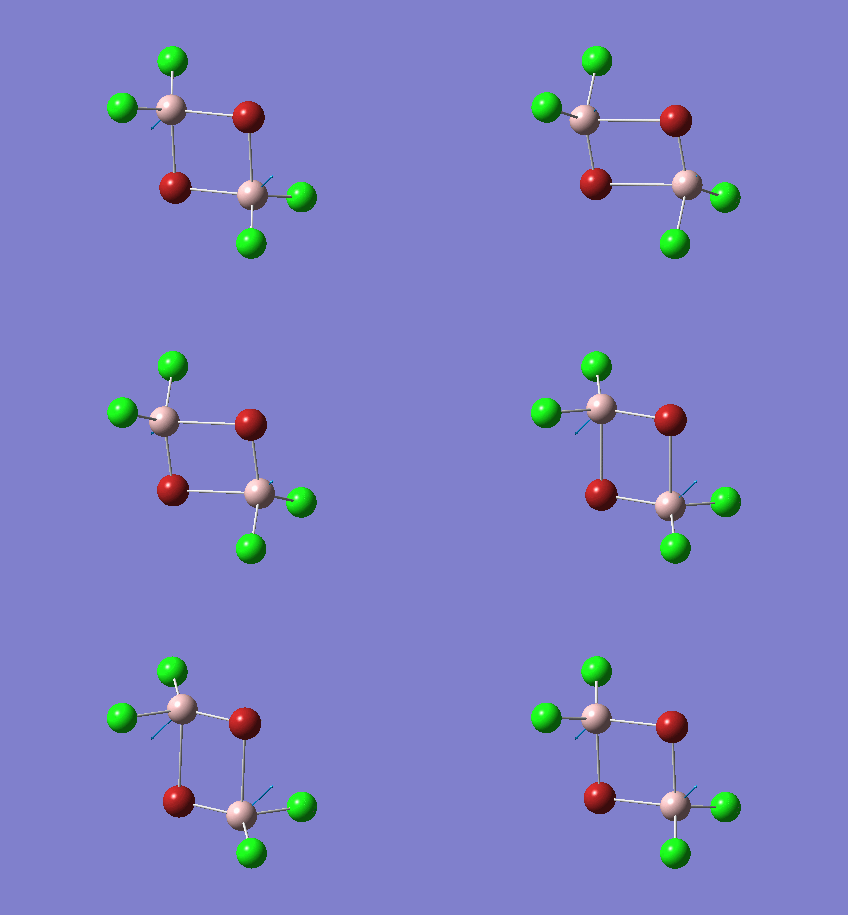
|
A smaller frequency is observed for isomer 5 with 2 bridging Br atoms as compared to isomers 3 and 4 with 1 bridging Br atom. The smaller frequency can be attributed to the larger reduced mass of the Al-Br bond. The smaller frequency indicates a longer and weaker bridging Al-Br-Al in isomer 5 (Al-Br= 2.49 Å) compared to isomers 3 and 4(Al-Br= 2.48 Å). The Br atomic orbital is more diffuse than Al as they overlap more poorly than that of the Cl and Al atomic orbitals. The weaker orbital interaction will result in weaker bonding interaction and weaker bond strength of the Al-Br bond as compared to Al-Cl.
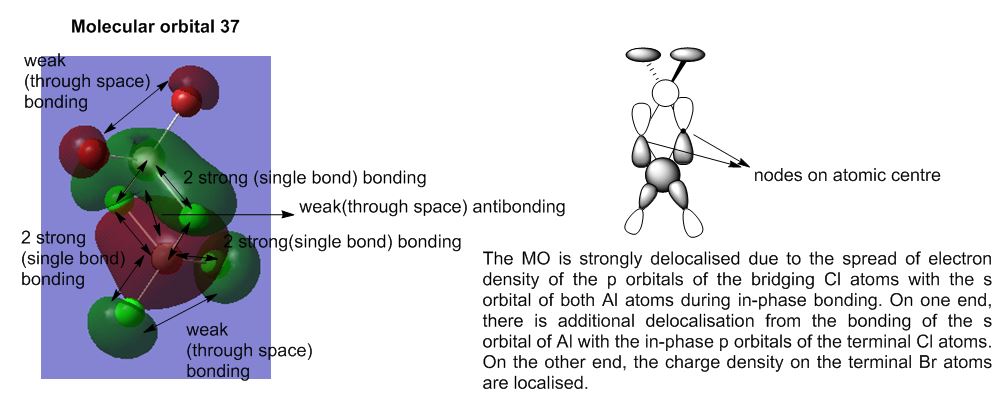
The terminal Al-Br stretching frequency is approximately twice that of the bridging Al-Br. The frequency is proportional to the spring constant of the bond and inversely proportional to the reduced mass. As the reduced mass of bond bonds are equal, the larger frequency can be attributed to the increase in bond strength of the terminal Al-Br bond compared to that of the bridging atoms. The bridging Al-Br bond strength is weaker and longer as observed in isomer 3 where the bridging Al-Br bond is 2.48 Å compared to 2.28 Å of the terminal Al-Br bond. Observation of the molecular orbitals shows the delocalisation of the bridging molecular orbitals with the aluminium molecular orbitals. This indicates the large distribution of electrons over the 4 atoms which explains the weaker bridging Al-Br bond as compared to the terminal Al-Br bond.
Molecular Analysis of lowest energy conformer (Isomer 6)
File: DOI:10042/193850
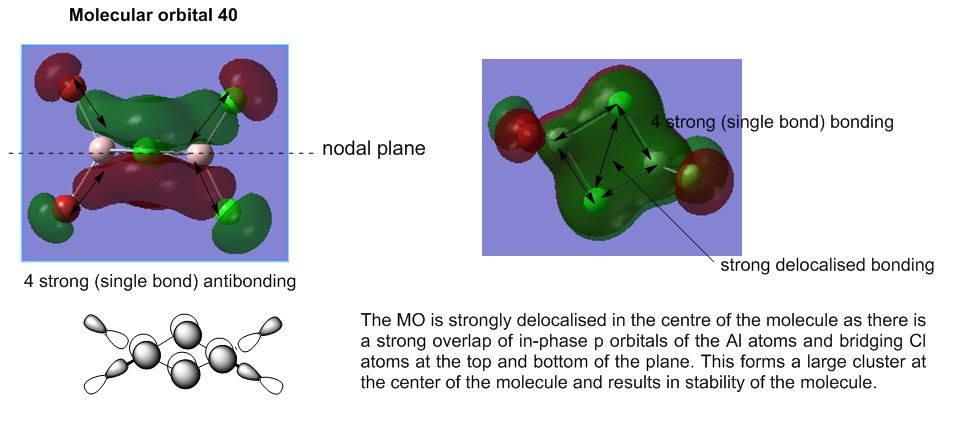
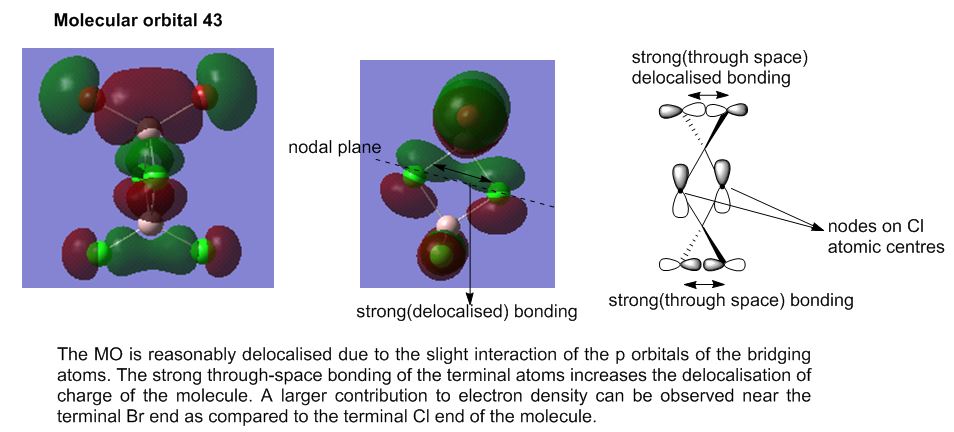
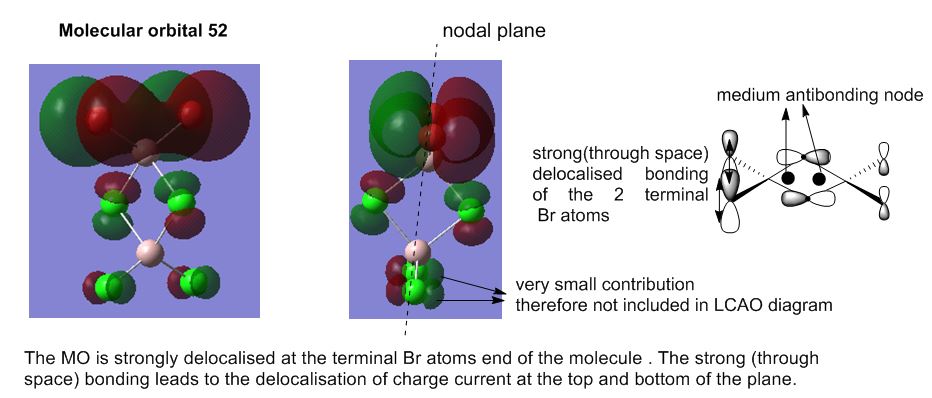
MO30(-2.80 hartree) and below are core orbitals and were ignored. The MOs from MO31 (-0.91 hartree) are valence non-core orbitals and were looked into for this section of analysis. The jump in energy from the core to non-core orbitals was noted. The unoccupied orbitals are diffuse and do not have the same level of validity as the occupied orbitals thus the MOs above MO55(-0.066 hartree) were ignored for this discussion.
References
- ↑ Molecular Orbitals in Inorganic Chemistry, Year 2 Autumn Lectures, Dr. P Hunt, 2014-2015, [http://www.huntresearchgroup.org.uk/teaching/teaching_MOs_year2/L3_Notes_2014_web.pdf
- ↑ T.L.Cottrel,"The Strengths of Chemical Bonds," 2nd ed., Butterworths, London, 1958

