Rep:Mod:Shine11
Physical Computational Labs
The Cope Rearrangement
The Cope rearrangement is a [3,3]-sigmatropic shift, of 1,5-hexadiene. It is a cyclic, intramolecular, reaction. Historically, the mechanism for this reaction has been the subject of a great deal of debate. However, there is now a general consensus as to its nature, namely that it proceeds in a concerted manner via either a boat or a chair transition state, with the chair being the more stable of the two.
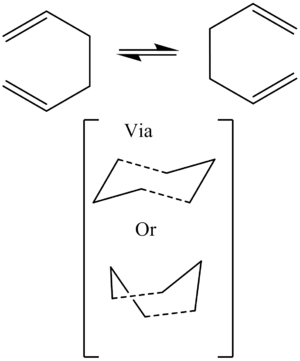
Gaussian is able to model these transition states reasonably accurately, to give a good agreement with experimental data. Therefore, the details of this reaction were investigated here.
Reactants and Products
Optimization
First of all, the molecule of 1,5-hexadiene was optimised, using the HF/3-21G method, in its anti-linkage conformation. This conformation is where the two penultimate carbons are anti-periplanar, when viewing the molecule along the central C-C bond. This gave the most stable form of the anti molecule. This is the log file, rather than the checkpoint file, for the anti-linkage optimisation, since this also shows the point group.
|
| |
|---|---|
| Energy/a.u. | -231.69254 |
| Point group | Ci |
| Table 1. | |
The same method was used for the gauche molecule.This is the log file
|
| |
|---|---|
| Energy/a.u. | -231.69266 |
| Point group | C1 |
| Table 2. |
The energy of the gauche molecule is lower than the anti-linkage molecule, as expected due to the gauche effect. The gauche effect consists of several orbital overlaps, σC-H/σ*C-H (2xE(2)=3.49), σC-C/σ*C-H (2xE(2)=1.78)and σC-H/σ*C-C (2xE(2)=4.25), which sums to 19.04kcal/mol.[1] There are additional favourable Van der Waals interactions between hydrogen atoms, over a distance of around 2.5Ao. This is the most stable conformation, as shown by the fact that other gauche conformations optimize to this particular conformer.
Using the point group and energy to assign the molecules, the molecule with the anti-linkage is anti-2 and the gauche molecule is gauche3.
The re-optimization of molecule anti-2 gave a molecule of energy -234.61170a.u., the log file for the process being here.
Looking at the geometry, the bond length of C=C lengthened by 0.01739Ao and the C=C-C bond angle increased by 0.481o. The geometry does not, in fact, change significantly, considering the significant change in the energy, from the to the molecule.
Frequency analysis
The frequency analysis of the anti-2 molecule, using the 3-21G method, is given below. This provided a breakdown of the total energy into its different forms.
| Energy/a.u. | |
|---|---|
| Electronic and zero-point | -231.53954 |
| Electronic and thermal | -231.53257 |
| Electronic and thermal Enthalpies | -231.53162 |
| Electronic and thermal Free Energies | -231.57092 |
| Table 3. | |
At room temperature the analysis of the re-optimized anti-2 molecule is as follows.
| Energy/a.u. | |
|---|---|
| Electronic and zero-point | -234.46921 |
| Electronic and thermal | -234.46187 |
| Electronic and thermal Enthalpies | -234.46091 |
| Electronic and thermal Free Energies | -234.50082 |
| Table 4. | |
The analysis at 0K was unsuccessful, due to the fact that Gaussian automatically corrected the temperature to 298.15K. Therefore, the analysis was rerun at 0.1K to give the following.
| Energy/a.u. | |
|---|---|
| Electronic and zero-point | -234.46921 |
| Electronic and thermal | -234.46921 |
| Electronic and thermal Enthalpies | -234.46921 |
| Electronic and thermal Free Energies | -234.469211 |
| Table 5. | |
The thermal contributions to the energies and enthalpies are negligible at this temperature, as expected.
Optimization of the Chair and Boat Transition Structures
Chair
Using Hartree Fock, two optimised allyl fragments were arranged in a chair structure.
An Opt+Freq job was then run, with the optimisation being to a Berny transition state.
Here is the log file for this process.
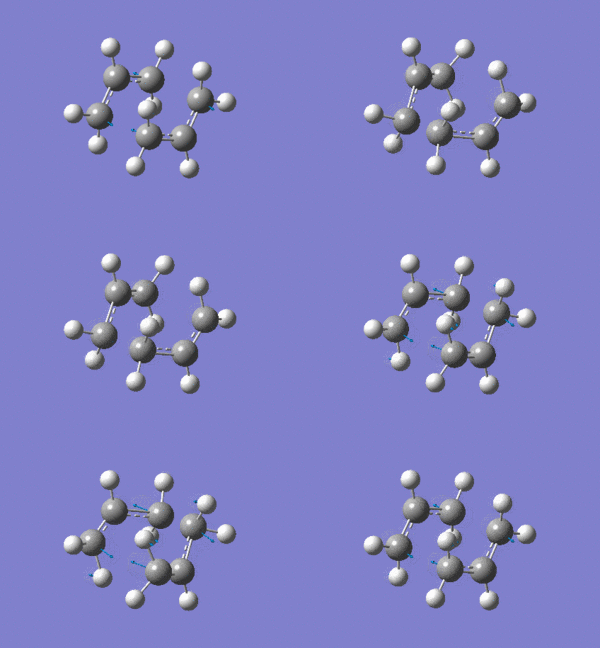
Shown above is the vibration that corresponds to the rearrangement. This has a frequency of -817cm-1. The fact that this eigenvalue is negative indicates that it is a maximum on the potential energy curve, since the frequency analysis gives the second derivative of this curve.
After this, the guess structure was reoptimised, with the distances between the bond forming carbons being frozen at a distance as close as possible to 2.2Ao.
These bonds were then set to derivative, using the redundant coordinate editor, and the molecule was reoptimised, with frequency analysis also performed, shown here.
This was, again, reoptimised, this time using B3LYP/6-31G(d). This method has already been shown by Houk to be an accurate method for predicting the regio- and stereoselectivity of the cycloaddition of Danishefski's diene with acrylonitrile.[2]
The final transition state is shown, . This Jmol shows the four partial double bonds as two double and two single bonds, unlike gaussview itself, which does show all four as partial double bonds.
IRC analysis follows the minimum energy pathway from a transition state down to a minimum on a potential energy curve. The direction of reaction was only carried out in the forward direction, since, in this instance, the reaction coordinate is symmetrical. 50 points were specified. When IRC analysis was performed on the transition state, this
product was formed.
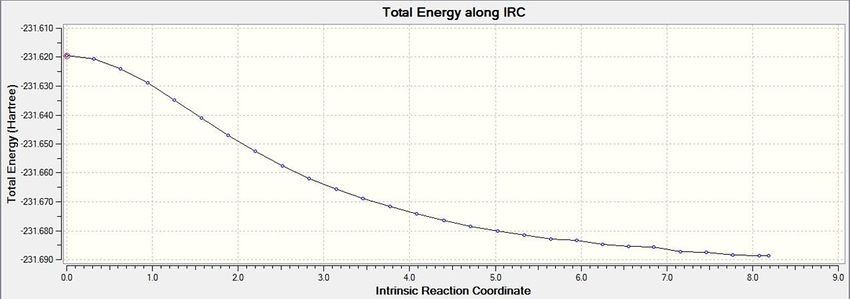
This product is the gauche2 conformer, based on its geometry, despite the fact that its energy is slightly different. It can also clearly be seen that a minimum has been reached.
Boat
The boat intermediate was modeled using the QST2 method, with the HF/3-21G basis set. This technique requires the input of both a reactant and a product molecule. Gaussian then linearly interpolates between the molecules to find a transition structure.
Both the reactant and the product molecule were the previously optimised anti2 molecule, the numbering of the atoms was simply changed on the product moelcule. However, the central dihedral angle was adjusted to 0o. In addition, the following bond angles were adjusted to 100o.
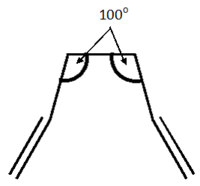
Without these corrections to the bond angles, the job fails, due to Gaussian's inability to consider this rotation.
This is the opt+freq job.
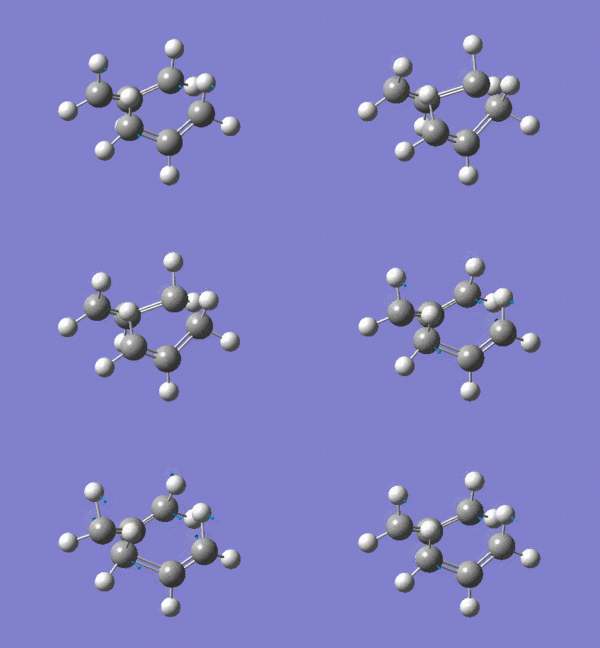
The frequency of this vibration is -840cm-1, again showing that it is a maximum and a transition state.
A very similar transition state was also found, using the QST3 method. This involves a guess structure being imputed, together with a reactant and product molecule. In this instance, the guess structure used was the product of the QST2 analysis.
Comparison
| Chair TS | Boat TS | Reactant molecule* | |||
|---|---|---|---|---|---|
| Energy/a.u. | HF/3-21G | Electronic | -231.61932 | -231.60280 | -231.69254 |
| Electronic and Zero Point | -231.46670 | -231.45093 | -231.53954 | ||
| Electronic and Thermal | -231.46134 | -231.44530 | -231.53257 | ||
| Electronic and Thermal Enthalpy | -231.46040 | -231.44436 | -231.53162 | ||
| Free Energy | -231.49521 | -231.47977 | -231.57092 | ||
| B3LYP/6-31G(d) | Electronic | -234.55695 | -234.54309 | -234.61170 | |
| Electronic and Zero Point | -234.41490 | -234.40231 | -234.46921 | ||
| Electronic and Thermal | -234.40898 | -234.39596 | -234.46186 | ||
| Electronic and Thermal Enthalpy | -234.40803 | -234.39502 | -234.46091 | ||
| Free Energy | -234.44312 | -234.43175 | -234.50082 | ||
| Table 6. | |||||
*The reactant molecule is the anti2 molecule.
| Temperature/K | ΔE Chair | ΔE Boat | |||
|---|---|---|---|---|---|
| Activation Energy/kcal/mol | HF/3-21G | 0 | 45.7 | 55.6 | |
| 298.15 | 47.5 | 57.2 | |||
| B3LYP/6-31G(d) | 0 | 34.1 | 42.0 | ||
| 298.15 | 36.2 | 43.3 | |||
| Experimental[3] | 0 | 33.5±0.5 | 44.7±2.0 | ||
| Table 7. | |||||
The ΔE values for 0K were calculated using the electronic potential and zero-point vibrational energies. The values for 298.15K, at 1atm, were calculated using the free energy values. This consists of the electronic potential energy, as well as the translational, rotational and vibrational energies. In addition to this, it consists of a correctional "+RT" term and an entropic "-TS" term. The ΔE values were calculated by subtracting the value of the particular energy type, of the reactant, from the value of that for the transition state, obviously. Comparing these values to the experimental values, the B3LYP/6-31G(d) basis set gave values that are very close to these experimental values. HF/3-21G gave values that were over 10kcal/mol too high.
Diels Alder Cycloaddition
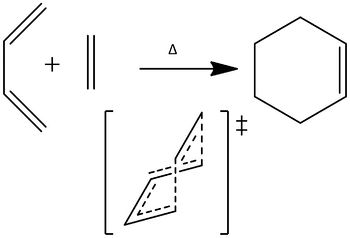
The Diels–Alder reaction is a reaction , specifically, a [4s + 2s] cycloaddition between a conjugated diene and a substituted dienophile, to give a cyclohexene system. It involves the breaking of 3 π bonds, the formation of 1, and, more importantly, the formation of 2 C-C σ bonds. The following examples are under thermal conditions. Furthermore, since they involve 4n+2 electrons, they proceed via a Hückel transition state. The reaction, therefore, proceeds with superfacial topology.
Cis-Butadiene
Firstly, cis-butadiene was analysed. The log file for the 3-21G optimisation is here. This is the log file for the 6-31G(d) optimisation.
The population analysis, using the AM1 semi-empirical method, is here.
| MO | Symmetry | |
|---|---|---|
| LUMO | 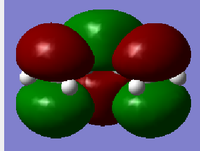 |
s |
| HOMO | 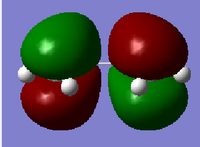 |
a |
| Table 8. | ||
Cyclohexene
The transition formed in the synthesis of cyclohexene, shown above, was modeled. The log file for the 3-21G optimisation is here.
This is the log file for the 6-31G(d) optimisation.
This was done, initially using the QST2 method. This failed. Therefore, a berny transition state was found instead. The population analysis, using the AM1 semi-empirical method, is here.
| MO | Symmetry | |
|---|---|---|
| LUMO | 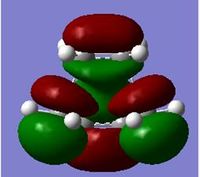 |
s |
| HOMO | 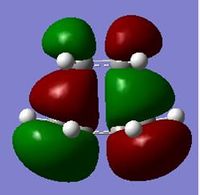 |
a |
| Table 9. | ||
The HOMO is formed by the overlap of the HOMO on the cis-butadiene with the π* on the ethylene, which is the LUMO. This reaction is allowed, due to the fact that a HOMO and a LUMO, that both are anti-symmetric, are overlapping. The LUMO is formed by the mixing of the LUMO on the cis-butadiene with π on the ethylene, which is the HOMO. This is again allowed, due to the fact that a HOMO and a LUMO, that both are symmetric, are overlapping.
The distance between the σ bond forming carbons are both 2.12Ao, shown . The Van der Waals radius of a carbon atom is 1.7Ao.[4] Therefore, it can be said that there is a bond between the carbon atoms, since the bond distance of 2.17Ao is less than 3.4Ao, double the Van der Waals radius. Due to the fact that sp3 C-H bonds typically have a length of 1.10Ao and sp2 C-H bonds normally have a length of 1.09Ao [5], and that the C-H bonds in this transition state have a length of 1.10Ao it can be said that the bond forming carbons have some partial sp3 character. This is expected, since these carbons are going from sp2 to sp3. With a sp3 C-C bond being approximately 1.54Ao, these carbon atoms are too far apart to be considered an actual bond, in the traditional sense of the word, despite the fact that there is clearly an interaction between them.
NBO analysis was then performed using the HF/3-21G basis set. Although this method does not consider the molecule to be a transition state, it still models this system reasonably well. Interestingly, the C-H bonds were shown to have a carbon atom of 28% s character and 72% p character. Again, this shows that these carbon atoms are in between sp2 and sp3 hybridization, in this transition state.
The vibrational mode of -956cm-1 is shown below.
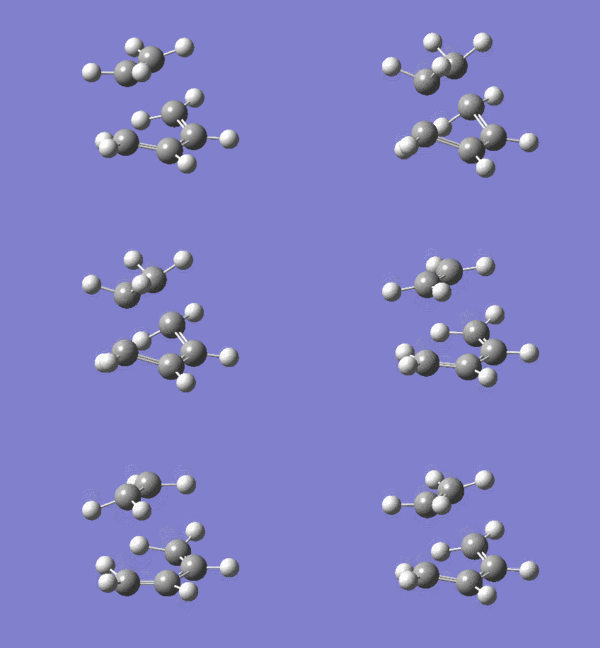
Looking at this vibrational mode, it clearly shows the that the bond formation is synchronous. The fact that the negative mode is shows synchronous bond formation indicates that the reaction proceeds in a concerted fashion.
Considering the lowest positive mode at 147cm-1, it shows partially forming bonds bending.
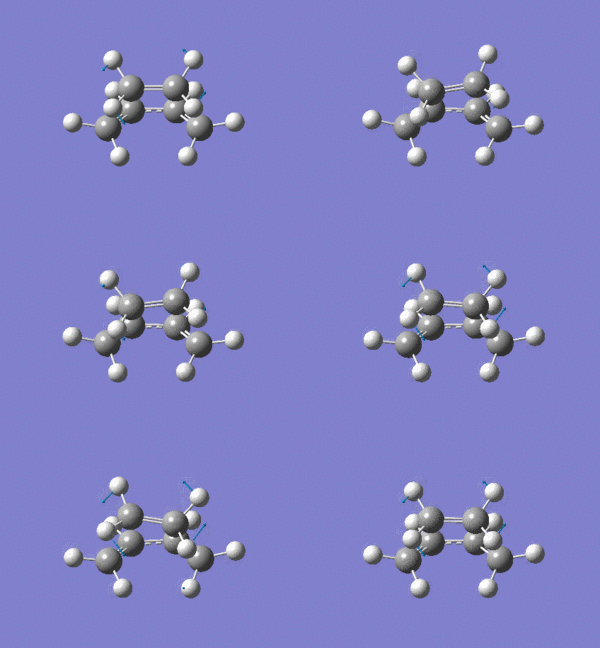
This mode, that has a frequency of 422cm-1, shows asynchronous bond formation.
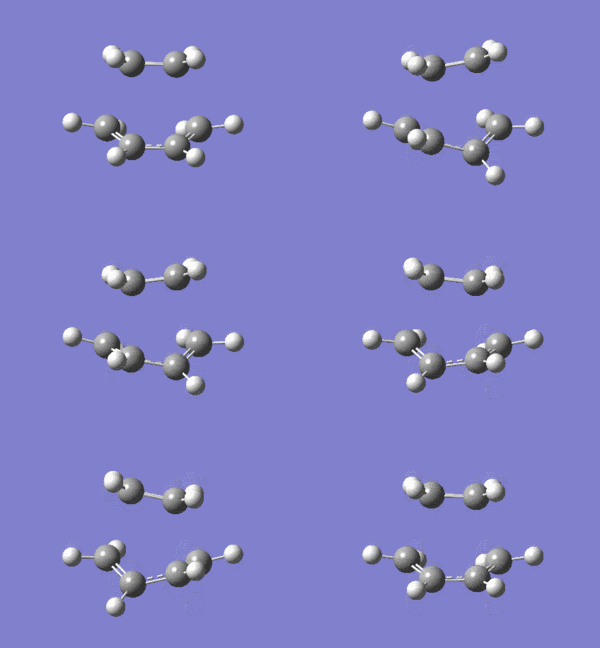
Exo transition state
The reaction here is as follows.

The initial optimisation for the product is here.
This is the reoptimisation.
The population analysis gave transition state.
| MO | Energy/a.u. | Symmetry | |
|---|---|---|---|
| LUMO | 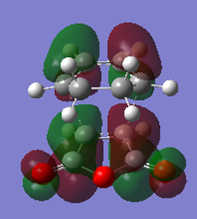 |
-0.04046 | a |
| HOMO | 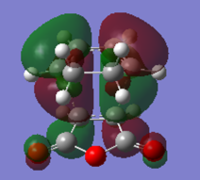 |
-0.34274 | a |
| Table 10. | |||
The frequency analysis gave the following vibration, at -812cm-1.
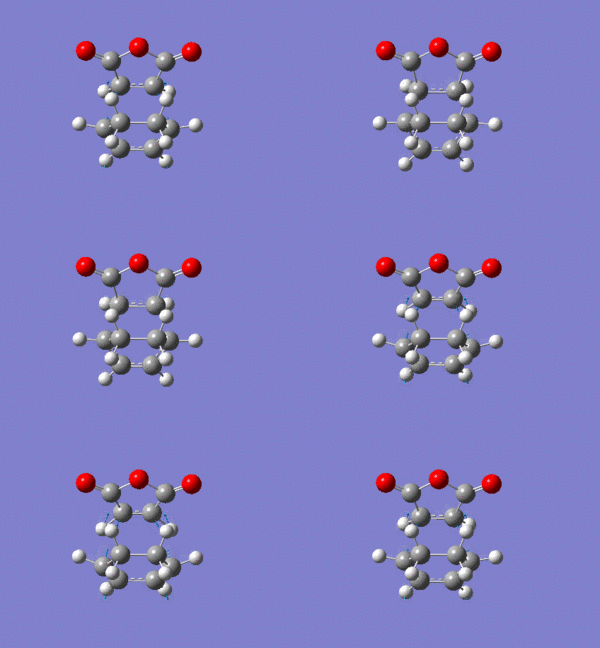
IRC analysis produced the following result, showing that the exo product is a minimum.
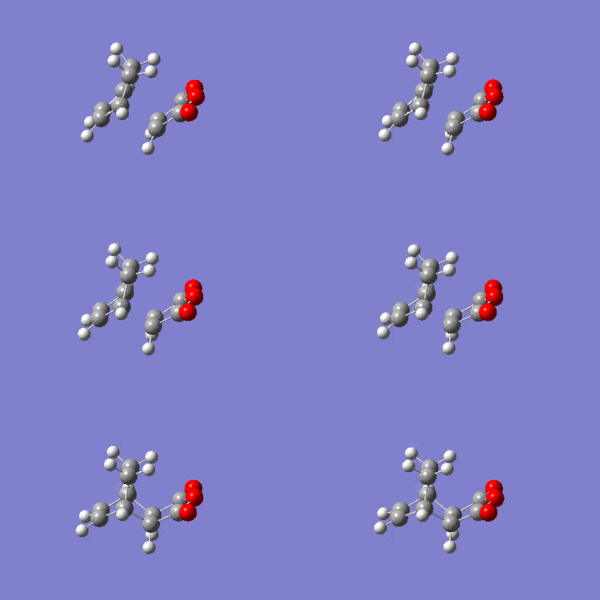
These graphs show that a minimum has been reached, since the root mean square gradient is close to zero. The analysis was run in both directions, since the reaction coordinate is not symmetrical.
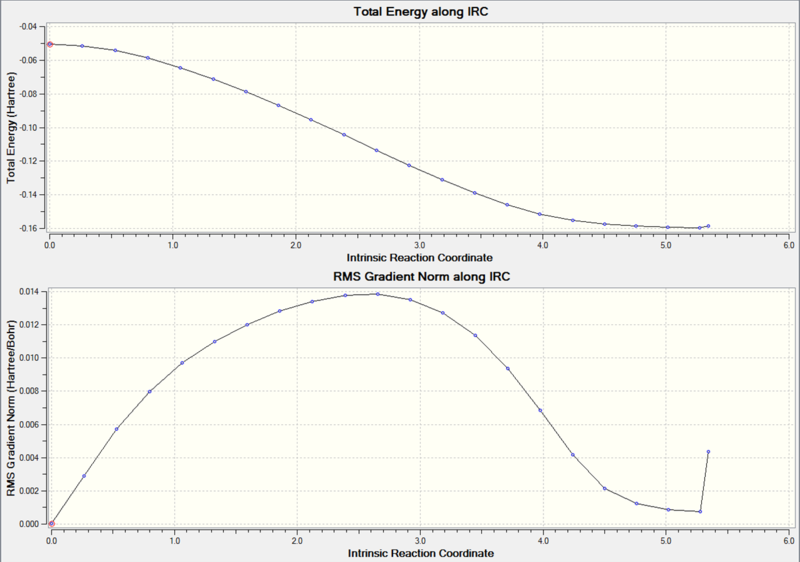
The minimum is the penultimate point, rather than the final one, because Gaussian is confirming that a minimum is found.
Endo transition state
This reaction gives the endo product.

The HF/3-21G optimisation for the product is here.
This is the B3LYP/6-31G(d) optimisation.
This frequency analysis gave the following vibration, at -806cm-1.
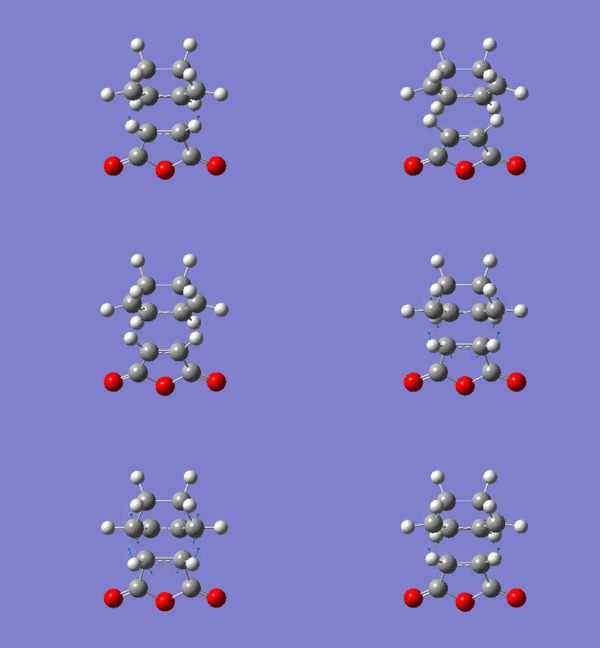
The population analysis is here.
| MO | Energy/a.u. | Symmetry | |
|---|---|---|---|
| LUMO |  |
-0.03569 | a |
| HOMO |  |
-0.34505 | a |
| Table 11. | |||
Considering endo transition state
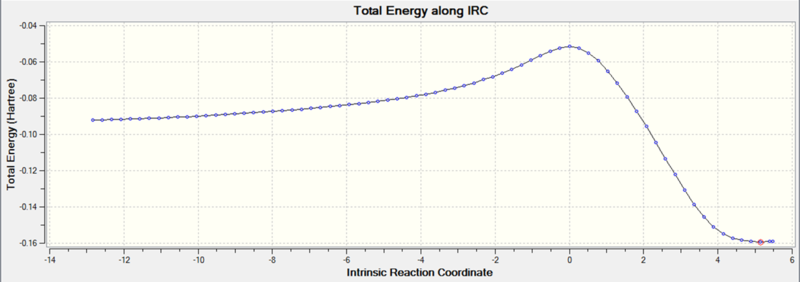
The IRC analysis of the endo transition state gave the following.
Endo and Exo Comparison
| Electronic Energy of TS/kcal/mol | |
|---|---|
| Exo | -31.64 |
| Endo | -32.32 |
| Table 12. | |
The difference between the endo and the exo transition state is that, for the endo the C-O-C in the maleic anhydride is pointing in the same direction as the C=C bonds on the cyclohexadiene, but the opposite direction for the endo. There are two key factors that affect their energies. The first of these is the so-called secondary overlap effect, a stabilizing effect that exist in the endo, but not the exo form. It involves the overlap of the orbital on the maleic anhydride, consisting of the filled p orbitals in the carbon atoms that form the C=C and C=O bonds, with the π bonds on the diene. This can clearly be seen below.


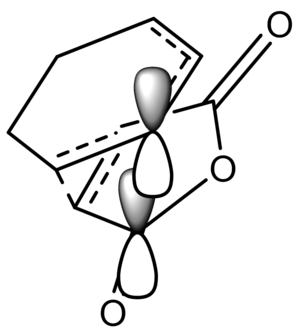
The other factor is steric hinderince. Due to the fact that the transition state must have the dieneophile as parallel as possible to the diene to maximise orbital overlap, there are also increased steric clashes between the -CH=CH- and (C=O)-O-(C=O) fragments in the . The , in contrast does not have this overlap, and can be more orthogonal to avoid these clashes. The through space distances, shown in the Jmols, 2.89Ao for the endo and 2.94Ao for the exo, demonstrate this. In this instance, the orbital overlap is dominating factor, in terms of affecting the energy of the transition state. This explains why the endo product is the kinetic one.
Additional Points to Consider
In order to consider the reasons for the inaccuracies in this experiment, the details of the AM1 method must be discussed.
The Austin Model 1 method uses parameters to match experimental heats of formation, dipole moments, ionisation potentials and geometries. Specifically, it takes into account electrostatic repulsion and exchange stabilization. All calculated values are evaluated by approximate means. The key difference between AM1 and most other methods is that AM1 does not overestimate repulsions between atoms when they at around their van der Waals distance apart, as many other methods do. This is done in two ways. First, one or more attractive Gaussians are added to compensate the overly large repulsions directly, specifically in the region where the repulsions were excessive. Second, repulsive Gaussians were added at smaller internuclear separations. It may be these overly emphasised interatomic repulsions that cause the HF/3-21G analysis to overestimate the energy of the transition states in the Cope Rearrangement.[6]
Also, AM1 is based on the NDDO, the neglect of Differential Diatomic Overlap. In the Neglect of Diatomic Differential Overlap (NDDO) method, a restricted basis set of one s orbital and three p orbitals, a px, a py and a pz. In addition, overlap integrals are ignored, that is, mathematically speaking, the overlap matrix, S, is replaced with the unit matrix, I. The Hartree-Fock Secular equation, |H-ES|=0, becomes |H-E|=0. It is for these reasons that nbo analysis could not be performed on the cyclohexene transition state using the AM1 method.[7][8]
Conclusion
The computational methods that have been used are very powerful and fast tools for analysis of simple C,H,N and O containing organic molecules, with the B3LYP/6-31Gd in particular giving good agreement with experimental data. The AM1 population analysis of the transition states also proved to be useful method of analysis, providing explanations for the endo product being the kinetic one, from a molecular orbital perspective. It also allowed for the explanation of the formation of cyclohexene, using a symmetry argument. Frequency analysis was also useful in confirming that potential energy maximum had been reached, as well as showing whether a reaction proceeded in a synchronous or asynchronous manner.
References
- ↑ http://www.ch.ic.ac.uk/local/organic/conf/
- ↑ Ujaque, G.; Norton, J. E.; Houk, K. N. J. Org. Chem. 2002, 67, 7179.
- ↑ Olaf Wiest , Kersey A. Black , K. N. Houk J. Am. Chem. Soc., 1994, 116 (22), pp 10336–10337
- ↑ Rowland RS, Taylor R (1996). "Intermolecular nonbonded contact distances in organic crystal structures: comparison with distances expected from van der Waals radii". J. Phys. Chem. 100 (18): 7384–7391
- ↑ Fox, Marye Anne; Whitesell, James K. (1995). Organische Chemie: Grundlagen, Mechanismen, Bioorganische Anwendungen
- ↑ AM1: A New General Purpose Quantum Mechanical Molecular Model’ Michael J. S. Dewar,* Eve G. Zoebisch, Eamonn F. Healy, and James J. P. Stewart, J. Am. Chem. SOC. 1985, 107, 3902-3909.
- ↑ http://en.wikipedia.org/wiki/NDDO
- ↑ http://openmopac.net/manual/semiempirical_theory.html
