Rep:Mod:SheridanClohessy
BH3
B3LYP/6-31G(d,p) level
        Item               Value     Threshold  Converged?
 Maximum Force            0.000407     0.000450     YES
 RMS     Force            0.000266     0.000300     YES
 Maximum Displacement     0.001617     0.001800     YES
 RMS     Displacement     0.001058     0.001200     YES
BH3 frequency analysis log file
 Low frequencies ---   -0.0736   -0.0037   -0.0003   68.1470   68.1471   68.8261
 Low frequencies --- 1164.5013 1214.1650 1214.1652
optimised BH3 molecule |
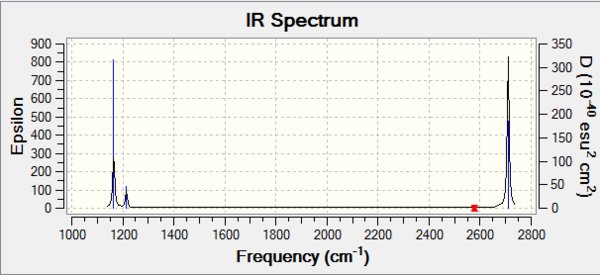
Vibrational spectrum for BH3
| wavenumber (cm-1 | Intensity (arbitrary units) | symmetry | IR active? | type |
| 1165 | 92 | A2" | yes | out-of-plane bend |
| 1214 | 14 | E' | yes | bend |
| 1214 | 14 | E' | yes | bend |
| 2577 | 0 | A1' | no | symmetric stretch |
| 2710 | 127 | E' | yes | asymmetric stretch |
| 2710 | 127 | E' | yes | asymmetric stretch |
- 6 vibrational modes are expected from the 3N-6 rule
- Modes 2 & 3 are degenerate so only give 1 peak; so are modes 5 & 6
- Mode 4 has no dipole moment, so is not IR active (so has no peak)
- Therefore only 3 peaks are seen on the spectrum
MO Diagram
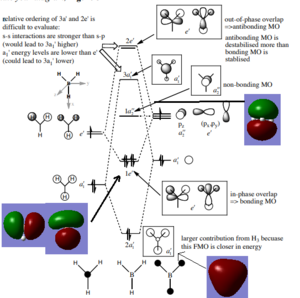
Are there any significant differences between the real and LCAO MOs?
Every single LCAO has the same basic structure as the real MOs. However, the qualitative LCAOs do not show extent of mixing between the fragment orbitals, and underestimate the size of the MOs.
Although not that accurate, the fact that they represent the shape of the real ones means they are a useful tool in exploring steroelectronic effects.
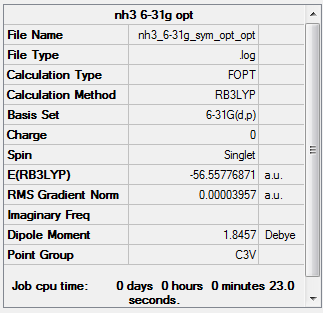
NH3
B3LYP/6-31G(d,p) level
        Item               Value     Threshold  Converged?
 Maximum Force            0.000050     0.000450     YES
 RMS     Force            0.000035     0.000300     YES
 Maximum Displacement     0.000220     0.001800     YES
 RMS     Displacement     0.000096     0.001200     YES
 Low frequencies ---  -28.3665  -28.3664  -25.1016   -0.0012    0.0011    0.0032
 Low frequencies --- 1088.2829 1693.7780 1693.7780
NH3 frequency analysis log file
optimised NH3 molecule |
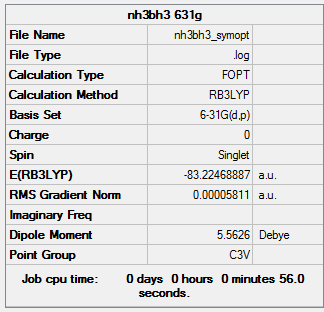
NH3BH3
B3LYP/6-31G(d,p) level
        Item               Value     Threshold  Converged?
 Maximum Force            0.000138     0.000450     YES
 RMS     Force            0.000038     0.000300     YES
 Maximum Displacement     0.000765     0.001800     YES
 RMS     Displacement     0.000181     0.001200     YES
 Low frequencies ---  -12.8312   -0.0300   -0.0051    0.0011    9.7169    9.7211
 Low frequencies ---  262.7864  631.2150  638.0748
NH3BH3 frequency analysis log file
optimised NH3BH3 molecule |
E(NH3)= -56.26 a.u.
E(BH3)= -26.62 a.u.
E(NH3BH3)= -83.22 a.u.
ΔE=E(NH3BH3)-[E(NH3)+E(BH3)]
ΔE= -0.04 a.u.
ΔE= -100 kJ/mol
This represents the energy of formation of the B-N dative bond (so the bond entahlpy is +100 kJ/mol). It is quite weak compared to typical covalent bonds - for example the N-H bond energy in ammonia +450 kJ/mol. 1
Smf115 (talk) 19:25, 23 May 2018 (BST)Correct calculation and nice reference for the literature value referenced. However, the numbers being manipulated have been rounded too far and too early, full decimal places can be used for the calculation and the final value only has to adhere to the correct accuracy. The answer seems to have also been converted incorrectly from a.u. to kJ/mol.
BBr3
B3LYP/6-31G(d,p) level
The correct point group is D3H, I have spoken to a demonstrator who confirmed it is ok to use this optimisation.
        Item               Value     Threshold  Converged?
 Maximum Force            0.000009     0.000450     YES
 RMS     Force            0.000005     0.000300     YES
 Maximum Displacement     0.000039     0.001800     YES
 RMS     Displacement     0.000026     0.001200     YES
 Low frequencies ---   -2.2682   -0.2047   -0.0002   -0.0001    0.0001    1.0519
 Low frequencies ---  155.9355  155.9453  267.6878
optimised BBr3 molecule |
[N(CH3)4]+
B3LYP/6-31G(d,p) level
        Item               Value     Threshold  Converged?
 Maximum Force            0.000124     0.000450     YES
 RMS     Force            0.000048     0.000300     YES
 Maximum Displacement     0.000411     0.001800     YES
 RMS     Displacement     0.000163     0.001200     YES
 Low frequencies ---   -0.0010   -0.0007   -0.0007   17.9443   17.9443   17.9443
 Low frequencies ---  184.1249  289.8769  289.8769
[N(CH3)4]+ frequency analysis log file
optimised [N(CH3)4]+ molecule |
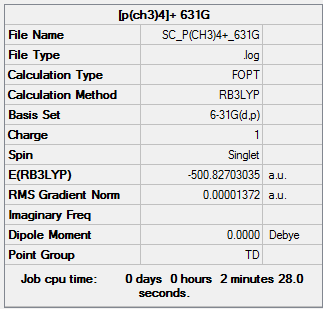
[P(CH3)4]+
B3LYP/6-31G(d,p) level
         Item               Value     Threshold  Converged?
 Maximum Force            0.000065     0.000450     YES
 RMS     Force            0.000015     0.000300     YES
 Maximum Displacement     0.000251     0.001800     YES
 RMS     Displacement     0.000110     0.001200     YES
 Low frequencies ---   -0.0045   -0.0041   -0.0028   24.0481   24.0481   24.0482
 Low frequencies ---  159.9671  194.7486  194.7486
[P(CH3)4]+ frequency analysis log file
optimised [P(CH3)4]+ molecule |
Analysis
| [N(CH3)4]+ | [P(CH3)4]+ | ||
|---|---|---|---|
| Atom | Charge | Atom | Charge |
| N | -0.295 | P | +1.667 |
| C | -0.483 | C | -1.060 |
| H | +0.269 | H | +0.298 |

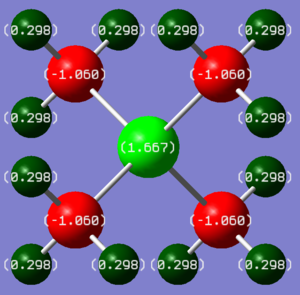
This charge distribution analysis has shown that the typical depiction of [NR4]+, with a positive charge on the nitrogen centre, is completely wrong. The positive charge is actually distributed over the hydrogen atoms, and the nitrogen atom has a slight negative charge. This makes sense for 2 reasons. Firstly, nitrogen is much more electronegative than hydrogen, so will attract electron density. Secondly, a comparison can be made with carbocations (carbon is only slightly less electronegative than nitrogen). Their positive charge is caused by electron deficiency - the carbon only has 6 valence electrons, and an empty p-orbital. As well as this, the positive charge is stabilised by sigma-conjugation with adjacent alkyl groups. In [N(CH3)4]+, the positive charge is caused by an extra -CH3+ group, and the valence orbitals are filled completely. This means that if the positive charge was centered on nitrogen, it would be a very unstable molecule.
The traditional picture is based on "formal charge", which assumes electrons from bonds are divided equally between atoms.
Conversely, [P(CH3)4]+ does have a large positive charge on the phosphorus atom. This is explained by the electronegativity difference: N > C > P/H. Its electropositive nature, and large size means it can more readily stabilise a positive charge. H cannot sustain the same level of positvie charge due to its small size - its nucleus is only a proton so the maximum it could have is +1.
Smf115 (talk) 23:14, 22 May 2018 (BST)Good explaination of the +1 charge location on the traditional description of [N(CH3)4]+ and on the real molecule. To improve the colour range to show the charge distribution should have been the same across the two molecules. Other features such as symmetry, or comparison of the similar H charges, could have been mentioned to develop the analysis further, although good discussion of electronegativities.
An interesting aspect of the MO analysis is the level of degeneracy - only 1/15 valence MOs is non degenerate. This is explained by the high symmetry of the compound (it has a Td point gorup_


Smf115 (talk) 19:24, 23 May 2018 (BST)Nice comment about the degeneracy and clearly presented MO images. Great identification of the FOs and LCAOs with some additional comments on the interactions.
Smf115 (talk) 19:24, 23 May 2018 (BST)Overall a well presented wiki report and great project section.


