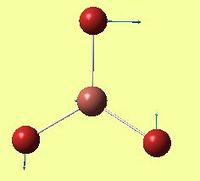
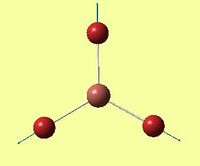
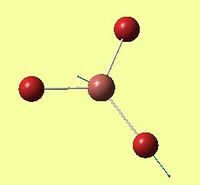
Rep:Mod:SabrinaTwo
Sabrina Maas, CID: 00595314, Module: 2
This module aims to explore the power of computational methods within inorganic molecules. It aims to show how these methods can be used to determine the most stable (low energy) conformation of a particular compound, by comparing the energies of their optimised structures. These predictions and calculations will be carried out using Gaussian, and the results viewed in Gaussview. These calculations will be explored using different methods and basis sets, in order to determine the most suitable for each set of compounds investigated. Additionally, the vibrational frequencies of the compouds will be predicted, which allow for the location of either transition states or global energy minima. Also, molecular orbital and natural bond orbital analysis will be used to investigate the electron density and therefore bonding interactions between atoms. These analyses are difficult to obtain in an experimental lab - this underlines the importance of computational methods to confirm and explain any data collected.
Bonding - ab initio and density functional molecular orbitals
BH3
This section aims to show how the geometry of a simple molecule such as BH3 can be optimised using Gaussian, and viewed on Gaussview. It also aims to show how this optimised geometry can be used to predict IR absorptions as well as molecular orbitals.
Geometry Optimisation
A molecule of BH3 was drawn in GaussView using the trigonal planar template geometry. The B-H bond lengths were then set to 1.5Å. This molecule was then submitted to Gaussian using the DFT/B3LYP method and primitive STO 3-21g basis set, in order for its geometry to be optimised. This method is suitable for the BH3 molecule as it is small and highly symmetric, and therefore not very complex. A 3D view of the optimised molecule can be seen here.
The relevant information obtained from the resulting output LOG file is shown below:
 ----------------------------
                          !   Optimized Parameters   !
                          ! (Angstroms and Degrees)  !
--------------------------                            --------------------------
! Name  Definition              Value          Derivative Info.                !
--------------------------------------------------------------------------------
! R1    R(1,2)                  1.1935         -DE/DX =    0.0004              !
! R2    R(1,3)                  1.1935         -DE/DX =    0.0004              !
! R3    R(1,4)                  1.1935         -DE/DX =    0.0004              !
! A1    A(2,1,3)              120.0            -DE/DX =    0.0                 !
! A2    A(2,1,4)              120.0            -DE/DX =    0.0                 !
! A3    A(3,1,4)              120.0            -DE/DX =    0.0                 !
! D1    D(2,1,4,3)            180.0            -DE/DX =    0.0                 !
--------------------------------------------------------------------------------
This shows that the geometry was successfully optimised in 4 iterations, as the gradient became 0 during the 4th step.
Item               Value     Threshold  Converged?
Maximum Force            0.000413     0.000450     YES
RMS     Force            0.000271     0.000300     YES
Maximum Displacement     0.001610     0.001800     YES
RMS     Displacement     0.001054     0.001200     YES
Predicted change in Energy=-1.071764D-06
Optimization completed.
   -- Stationary point found.
The RMS (Root Mean Squared) force value is converged and negligible, which suggests the optimisation has been successful as force is the slope of the graph of energy vs distance. The displacements are also converged, suggesting that for a small displacement, the energy is constant.

Figure 1 above shows that the dipole moment of the molecule is zero Debye. This is as expected for the highly symmetrical molecule, which has a point group of D3h. The optimised molecule showed B-H bond lengths of 1.193Å and a H-B-H bond angle of 120.0°, consistent with literature. [1] The RMS gradient has a very small value, which is also indicated by the graphs in figures 2 and 3 below. Specifically, figure 3 shows a final RMS value at the fourth iteration of 0.0002067 Hartree/Bohr.


Figure 2 shows that the energy reached a minimum once optimised. The analysis of the log output file therefore strongly suggests the BH3 molecule has an optimised geometry that can now be further analysed.
Frequency Analysis
Frequency analysis was carried out on the optimised BH3 molecule. This was primarily done to confirm that the structure is one of minimum energy (ie the optimisation was successful), rather than a transition state. Considering a potential energy surface, it is obvious that when the first derivative of this surface is zero, it is indicative of minimum or maximum at this point. However, in order to differentiate between a minimum or maximum, the second derivative must be calculated. This is carried out by a frequency analysis. Positive frequencies confirm a minimum, one negative frequency suggests a transition state, and more negative frequencies suggests the optimisation has not been successful. Another reason for the freqency analysis is that is produces an IR spectrum, which can be easily compared to literature and therefore the reliability of the method for optimisation can be assessed.
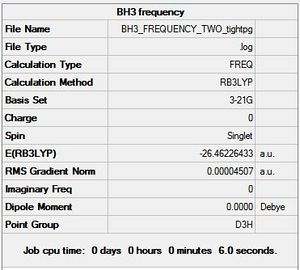
When figure 4 is compared to figure 1, it can be seen that they have the same total energy, which means the frequency analysis was performed on the optimised structure.
| Description for Mode of Vibration | Type of Vibrational Mode | Intensity of Absorption | Frequency of Absorption (cm-1) | Literature value for Frequency (cm-1) [2] | Percentage Error (%) | Diagram |
|---|---|---|---|---|---|---|
| Umbrella deformation - all hydrogen atoms move in a concerted manner between the two faces of the boron atom | A2 " | 93 | 1146 | 1148 | -1.35 | 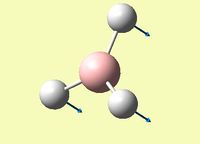 |
| Symmetric B-H scissoring - one B-H bond is fixed and the other two move in a concerted, symmetric manner | E' | 12 | 1205 | 1182 | 1.95 | 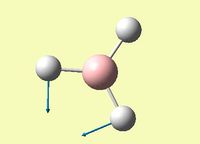 |
| Asymmetric B-H rock - all B-H bonds rock in different directions | E' | 12 | 1205 | 1182 | 1.95 | 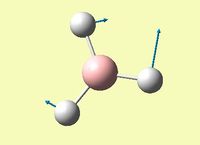 |
| Symmetric B-H stretch - all B-H bonds stretch and contract towards and away from boron in a concerted manner | A1' | 0 | 2592 | 2503 | 3.6 | 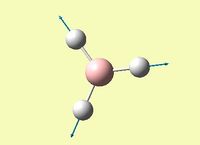 |
| Asymmetric B-H stretch - two B-H bonds stretch symmetrically with eachother and the other B-H bond stretches asymmetrically with respect to the other two | E' | 104 | 2730 | 2597 | 5.1 |  |
| Asymmetric B-H stretch - one B-H bond remains fixed while the other two stretch asymmetrically | E' | 104 | 2730 | 2597 | 5.1 |  |
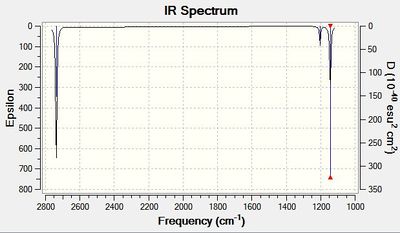
From the table above, it can be seen that the percentage error between the predicted frequency of vibration and the literature value becomes larger at higher frequencies. This was also found in module 1, where many different predicted IR spectra where compared to literature. [3] The IR spectrum is shown in figure 5. It does not show 6 peaks although there are 6 different vibrational modes above. This is because the A1' vibration is totally symmetric and therefore does not induce a dipole moment and is not visible in the IR spectrum. (predicted absorption = 0) The pairs of E' type vibrational modes are degenerate, therefore only only one peak is found in the spectrum.
Molecular Orbital Analysis
The optimised BH3 structure was used to undergo molecular orbital analysis. The calculation was set up in Gaussview as an energy analysis with the parameters 'pop=full' and 'full nbo' selected, and sent to the HPC server,resulting in an output formatted checkpoint file.[4] This was then opened in Gaussview in order to visualise the molecular orbitals. The relative energies of the eight lowest energy molecular orbitals are shown in figure 6.
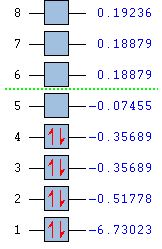
From this figure it can be seen that the lowest energy molecular orbital, labelled 1, is extremely low in energy relative to the other occupied molecular orbitals. This corresponds to the 1s orbital of boron and suggests that it may be too low in energy to interact with the hydrogen fragment.
In order to assess the reliability and accuracy of the calculated and predicted molecular orbitals using computational methods, these molecular orbitals will be compared to the orbitals predicted by the LCAO qualitative approach. To draw the molecular orbital diagram qualitatively, the BH3 molecule was split into a H3 fragment and the boron atom fragment. These fragments are of similar electronegativity, with H being 2.08 and B being 1.85.[5] The boron fragment was therefore placed at a slightly higher energy than the H3 fragment. Each atomic orbital is assigned a symmetry label, and those with the same symmetry label from different fragments were combined. This is shown in figure 7, along with the calculated molecular orbitals for comparison.

Qualitatively, it is not obvious whether the 3a' level or the 2e' level is higher in energy. It can be thought that the 3a' molecular orbital is lower in energy because the a' fragment it is made from is lower in energy than the e' fragments that constitute 2e'. On the other hand, it could be thought that the 2e' orbital should be lower in energy, as the two e' fragments show a worse overlap (s/p overlap vs s overlap) than the two a' fragments producing 3a'. Without computational methods, this issue would be difficult to resolve. However, Gaussian clearly produced energies for each orbital, showing that the 3a' molecular orbital is higher in energy than the 2e' by 0.00357 Ha, or 2.24 kcalmol-1.
The calculated molecular orbitals are shown from different angles in table 2 below, in order to fully appreciate their shapes.
| HOMO -3 | HOMO -2 | HOMO -1 | HOMO | LUMO | LUMO +1 | LUMO +2 | LUMO +3 |
|---|---|---|---|---|---|---|---|
 |
 |
 |
 |
 |
 |
 |
 |
Natural Bond Orbital Analysis
When performing the MO analysis, the 'full nbo' option was chosen, allowing for this same output file as a .log file[4] to be used for the natural bond orbital analysis. When this is opened in Gaussview, it is possible to view the charge distribution of the molecule. The resulting visual representation of the charges, along with the calculated charge is shown in figure 8 below.

The green colour indicates a positive charge, and the red indicates a negative charge. The boron atom is highly electron deficient which a charge of +0.332, which is as expected seeing as it acts as a strong lewis acid because of its low-lying empty pz orbital. The hydrogen atoms have a negative charge of -0.111.
These values are also found in the .log file:
          Summary of Natural Population Analysis:
                          Natural Population
               Natural  -----------------------------------------------
   Atom  No    Charge         Core      Valence    Rydberg      Total
-----------------------------------------------------------------------
     B    1    0.33161      1.99903     2.66935    0.00000     4.66839
     H    2   -0.11054      0.00000     1.11021    0.00032     1.11054
     H    3   -0.11054      0.00000     1.11021    0.00032     1.11054
     H    4   -0.11054      0.00000     1.11021    0.00032     1.11054
=======================================================================
  * Total *    0.00000      1.99903     6.00000    0.00097     8.00000
This shows that the overall charge of the molecule is neutral, as the negative natural charges of the 3 hydrogen molecules cancel out with the positive natural charge of the boron atom.
      (Occupancy)   Bond orbital/ Coefficients/ Hybrids
---------------------------------------------------------------------------------
    1. (1.99853) BD ( 1) B   1 - H   2
               ( 44.48%)   0.6669* B   1 s( 33.33%)p 2.00( 66.67%)
                                           0.0000  0.5774  0.0000  0.0000  0.0000
                                           0.8165  0.0000  0.0000  0.0000
               ( 55.52%)   0.7451* H   2 s(100.00%)
                                           1.0000  0.0000
    2. (1.99853) BD ( 1) B   1 - H   3
               ( 44.48%)   0.6669* B   1 s( 33.33%)p 2.00( 66.67%)
                                           0.0000  0.5774  0.0000  0.7071  0.0000
                                          -0.4082  0.0000  0.0000  0.0000
               ( 55.52%)   0.7451* H   3 s(100.00%)
                                           1.0000  0.0000
    3. (1.99853) BD ( 1) B   1 - H   4
               ( 44.48%)   0.6669* B   1 s( 33.33%)p 2.00( 66.67%)
                                           0.0000  0.5774  0.0000 -0.7071  0.0000
                                          -0.4082  0.0000  0.0000  0.0000
               ( 55.52%)   0.7451* H   4 s(100.00%)
                                           1.0000  0.0000
    4. (1.99903) CR ( 1) B   1           s(100.00%)
                                           1.0000  0.0000  0.0000  0.0000  0.0000
                                           0.0000  0.0000  0.0000  0.0000
    5. (0.00000) LP*( 1) B   1           s(100.00%)
    6. (0.00000) RY*( 1) B   1           s(  0.00%)p 1.00(100.00%)
The above table found in the .log file shows that for each B-H bond, 44.48% of the bond is a contribution from the boron orbitals, and 55.52% is a contribution from the relevant hydrogen orbital. It can also be seen that the boron orbital is 33.33% s character and 66.67% p character, whereas the hydrogen orbital contributing to the bond is 100% s character. The 4th orbital shown corresponds to the 1s atomic orbital of boron, which is too low in energy to mix with hydrogen orbitals, and is therefore 100% s as expected. The 5th orbital should be the empty pz orbital on the boron atom, which therefore should not be 100% s character, but rather 100% p character. This suggests the 6th orbital corresponds to the empty pz orbital. The reason for this mismatch may be due to the nbo analysis being unable to correctly characterise unoccupied orbitals. The Second Order Perturbation Theory Analysis of Fock Matrix in NBO Basis shows values in the E(2) column very close to zero, and therefore negligible. This suggests there is no significant second order mixing between bonding natural bond orbitals and non-bonding orbitals in BH3.
TlBr3
In this section, a molecule of TlBr3 will be computationally analysed. Although TlBr3 has a trigonal planar geometry like BH3, it is a much more complex molecule due to its many electrons - Tl contributes 81 electrons, and Br contributes 35 electrons each. Both Br and Tl are known to show relativistic effects, which is common for heavier elements as their electrons reach relativistic speeds. The effect of this is that these show differences to the non-relativistic approach which can be solved using Schrödingers equation. The assumption is used that valence electrons are dominant in bonding, therefore, to simplify the calculation, the core electrons of the molecule can be modelled by pseudo-potentials. To increase the accuracy of the calculations, a different and higher level basis set must be used than was previously used with BH3. The basis set that was chosen was LANL2DZ as it takes into account the above mentioned pseudo potentials.
Geometry Optimisation
A molecule of TlBr3 was drawn in Gaussview and optimised using the DFT-B3LYP method with the LANL2DZ basis set, with the point group set to D3h with a very tight tolerance of 0.0001. The optimised molecule is shown below in figure 10, and shows Tl-Br bond lengths of 2.651Å and Br-Tl-Br angles of 120.0°. These correspond to the literature values of 2.52Å[6] and 120°[7]. A 3D view of the optimised molecule can be seen here.
The relevant information obtained from the resulting output LOG file is shown below:
----------------------------
                          !   Optimized Parameters   !
                          ! (Angstroms and Degrees)  !
--------------------------                            --------------------------
! Name  Definition              Value          Derivative Info.                !
--------------------------------------------------------------------------------
! R1    R(1,2)                  2.651          -DE/DX =    0.0                 !
! R2    R(1,3)                  2.651          -DE/DX =    0.0                 !
! R3    R(1,4)                  2.651          -DE/DX =    0.0                 !
! A1    A(2,1,3)              120.0            -DE/DX =    0.0                 !
! A2    A(2,1,4)              120.0            -DE/DX =    0.0                 !
! A3    A(3,1,4)              120.0            -DE/DX =    0.0                 !
! D1    D(2,1,4,3)            180.0            -DE/DX =    0.0                 !
--------------------------------------------------------------------------------
This following table shows that the optimisation was successful as the RMS values are very close to zero, as was explained in the BH3 optimisation.
  Item               Value     Threshold  Converged?
Maximum Force            0.000002     0.000450     YES
RMS     Force            0.000001     0.000300     YES
Maximum Displacement     0.000022     0.001800     YES
RMS     Displacement     0.000014     0.001200     YES
Predicted change in Energy=-6.083953D-11
Optimization completed.
   -- Stationary point found.
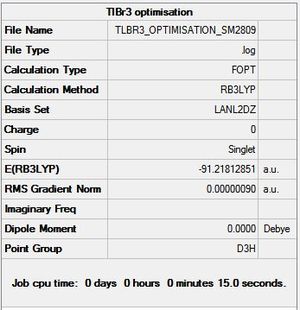

Figure 9a shows the molecule does not have a dipole moment, which is expected seeing as it is a highly symmetrical molecule, just like BH3. Figure 9b shows that the optimisation was completed after three iterations.
In order to confirm this is a global energy minimum and not a transition state, a frequency analysis was carried out.
Frequency Analysis
A global minimum will be confirmed if all vibrations are positive. The summary of the frequency analysis is shown in figure 10 below, and the resulting IR spectrum is shown in figure 11.
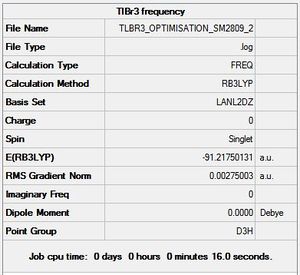
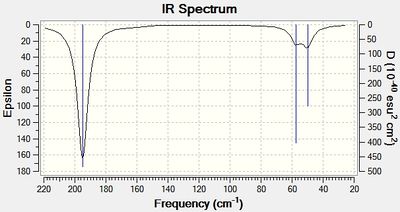
The IR spectrum shows 3 peaks, which is consistent with literature.[8] however 6 distinct vibrational modes were predicted. These are shown in table 3 below.
The A1' vibration is totally symmetric and therefore does not induce a dipole moment and is not visible in the IR spectrum. (predicted absorption = 0) The pairs of E' type vibrational modes are degenerate, therefore only only one peak is found in the spectrum. The following low frequencies in cm-1 were found in the log file:
Low frequencies ---   -0.0008   -0.0004   -0.0003   18.6824   19.5014   19.5014
Low frequencies ---   49.9765   49.9768   57.4606
The lowest 'real' normal mode is therefore 50cm-1 for the e' symmetry vibrational mode. The closer to zero the low frequencies are, the more reliable and accurate the results.
As no negative frequencies were calculated, the optimisation was successfully an energy minimum.
What is a bond?
Whilst optimising some molecules, it was found that the resulting optimised structure sometimes showed a lack of bonds between atoms that are known to be bonded to one another. This was the case for the Molybdenum complexes analysed below. This observation shows brings up the question - what is a bond?
A bond is an area of high electron density between two atoms that are close enough to experience attraction - whether it be in an ionic bond, where there are electrostatic attractions between oppositely charged nuclei, in a metallic bond, where delocalised electrons are attracted to positively charged ions, or in a covalent bond, where the high electron density is due to the overlap of molecular orbitals of two atoms in proximity.
There is, however, an ambiguity to these definitions. How does one know the extent to which two atoms are bonded? Single, double, or triple bonds are difficult to distinguish without looking at the distances between two atoms, and should really be continuous rather than discrete. This is how Gaussview represents bonds - it is a representation of the distance between two atoms. If Gaussview does not draw a bond, this does not mean there is no bond present, but rather merely means the distance between two longer than Gaussview is programmed to consider a bond. This often occurs for heavier elements, as they are larger and are therefore further apart that the organic molecules Gaussview is used to dealing with.
Isomers of Mo(CO)4(L)2
In this section, the cis and trans isomers of Mo(CO)4(L)2 will have their geometries optimised. Once optimised, a frequency analysis will be carried out. This will be done to confirm and understand the results obtained in the second year inorganic chemistry course, where the cis- isomer produced 4 distinct peaks in IR, and trans- only produced 1 peak. In this experiment, the complex Mo(CO)4(PPh3)2 was used. This complex would require high computing power to be analysed computationally, as the bulky PPh3 ligands contain many electrons. For this reason, a simpler complex of Mo(CO)4(PCl)2 will be used as an appropriate model as these ligands are known to have similar electronic contributions. Another aim of this section is to predict, using computational methods, the relative stabilities of the isomers, which is a difficult task to do experimentally.
Geometry Optimisation
Firstly, both the cis and trans isomers of Mo(CO)4(PCl3)2were drawn in Gaussview and optimised using the B3LYP method and low level basis set LANL2MB with the additional keywords opt=loose, in order to set loose convergence criteria and thus obtain convergence. These output log files for cis[9] and trans[10] are given.
CIS:
 Item               Value     Threshold  Converged?
Maximum Force            0.001301     0.002500     YES
RMS     Force            0.000248     0.001667     YES
Maximum Displacement     0.003615     0.010000     YES
RMS     Displacement     0.000946     0.006667     YES
Predicted change in Energy=-5.579334D-07
Optimization completed.
   -- Stationary point found.
TRANS:
 Item               Value     Threshold  Converged?
Maximum Force            0.000185     0.002500     YES
RMS     Force            0.000058     0.001667     YES
Maximum Displacement     0.004453     0.010000     YES
RMS     Displacement     0.001747     0.006667     YES
Predicted change in Energy=-7.732158D-07
Optimization completed.
   -- Stationary point found.
Although it can be seen above that a stationary point was found for both the cis and trans isomers, in this case it is uncertain whether this is the lowest energy minimum on the potential surface. In order to arrive at the optimum geometry corresponding to the lowest energy minimum, the torsion angle of the PCl3 groups were altered.
In the cis isomer, one chlorine atom of one PCl3 group was set to a torsion angle of 0° with respect to a carbonyl group, and one chlorine atom of the other PCl3 group was set to have a torsion angle of 180° with respect to that same carbonyl group. In the trans isomer, both PCl3 groups were set to be eclipsed with one Cl being parallel to one carbonyl group.
These loosely optimised geometries which were edited manually were then further optimised using a higher level basis set-B3YLP method with LANL2DZ and tighter convergence criteria, obtained by adding the keywords: int=ultrafine scf=conver=9. The resulting log files for cis[11] and trans[12] are given.
CIS:
        Item               Value     Threshold  Converged?
Maximum Force            0.000016     0.000450     YES
RMS     Force            0.000003     0.000300     YES
Maximum Displacement     0.000623     0.001800     YES
RMS     Displacement     0.000169     0.001200     YES
Predicted change in Energy=-3.666266D-09
Optimization completed.
   -- Stationary point found.
TRANS:
 Item               Value     Threshold  Converged?
Maximum Force            0.000070     0.000450     YES
RMS     Force            0.000023     0.000300     YES
Maximum Displacement     0.001223     0.001800     YES
RMS     Displacement     0.000238     0.001200     YES
Predicted change in Energy=-9.685907D-08
Optimization completed.
   -- Stationary point found.
Although this method once again found stationary points and used a higher basis set, it is still unable to deal with the phosphorus atoms properly. They are treated as having s and p orbitals only, however it is known that the low-lying d orbitals in phosphorus can also be used. Additional d atomic orbital functions can be added to the input file, as shown below.
Advanced Geometry Optimisation
In order to add the d orbital function, the output log file from the previous optimisation was opened and saved as .gjf file. This was then edited so that it included the keyword: extrabasis and 4 additional lines were added to the end of the document in order for the extra basis to run correctly. This new edited file was then submitted to the HPC server and resulted in new cis[13] and trans[14] log files. The optimised geometries can be viewed here for cis and trans.
CIS:
        Item               Value     Threshold  Converged?
Maximum Force            0.000140     0.000450     YES
RMS     Force            0.000045     0.000300     YES
Maximum Displacement     0.001108     0.001800     YES
RMS     Displacement     0.000425     0.001200     YES
Predicted change in Energy=-2.464393D-07
Optimization completed.
   -- Stationary point found.
TRANS:
 Item               Value     Threshold  Converged?
Maximum Force            0.000017     0.000450     YES
RMS     Force            0.000006     0.000300     YES
Maximum Displacement     0.001612     0.001800     YES
RMS     Displacement     0.000357     0.001200     YES
Predicted change in Energy=-1.681058D-08
Optimization completed.
   -- Stationary point found.
The optimised geometries were compared to literature by virtue of measuring the bond lengths in the complex. This comparison is shown in table 4 below.
| Bond | Cis- Isomer Bond Length (Å) | Literature[15] Bond Length (Å) | Percentage error (%) | Trans- Isomer Bond Length (Å) | Literature[16] Bond Length (Å) | Percentage error (%) |
|---|---|---|---|---|---|---|
| Mo-C | 2.05a / 2.02b | 2.01 | -1.95 | 2.06 | 1.87 | 9.22 |
| C-O | 1.175a / 1.176b | 1.15 | 1.74 | 1.17 | 1.15 | 1.74 |
| Mo-P | 2.48 | 2.58 | -3.88 | 2.42 | 2.37 | 2.11 |
| P-Cl | 2.12 | 2.06[17] | 2.91 | 2.12 | 2.06[17] | 2.91 |
a This bond length corresponds to the Mo-C/C-O bond of the carbonyl trans to another carbonyl. b This bond length corresponds to the Mo-C/C-O bond of the carbonyl trans to a PCl3 group NB: the literature bond lengths reported are for the cis- and trans- isomers of Mo(CO)4(PPh3)2. The literature bond lengths for P-Cl were only found for a different molecule, therefore the percentage errors are approximate.
The bond length that is the most different for the cis- and trans- isomers is the Mo-P bond, which differs by 0.06Å. This could be due to the lengthening of the cis- Mo-P bond to avoid steric hindrance of the two neighboring bulky PCl3 ligands. The Mo-C bond lengths differ within the cis- isomer. This is due to the trans effect. The phosphorus atoms on the PCl3 ligands are able to donate electron density towards the metal. This means the metal is then able to donate electron density towards the empty π* orbital of the carbonyl. This donation of electron density towards the carbonyl has an effect of strengthening the Mo-C bond and weakening the carbon oxygen bond. Therefore, it is seen that for the carbonyl ligands that are trans to PCl3 groups, the Mo-C bond is slightly shorter and stronger. Conversely, the C-O bond should be longer in these cases, as electron density is pushed into an anti-bonding orbital. This is also observed in the cis- optimised structure.
Energies Analysis
The advanced geometry optimisation summaries are shown below in figures 12 and 13 in order to compare the relative stabilities of the cis and trans isomers.
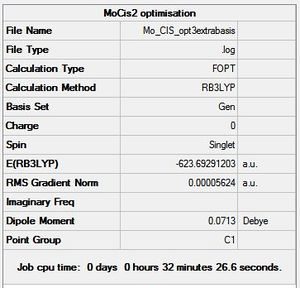

By comparing the total energies calculated for each isomer, it can be determined which isomer is the most stable and thus the thermodynamic product. According to figures 12 and 13 above, the cis- isomer has a total energy of -623.6929 Hartrees, which is 3.27 kJmol-1 higher than the trans isomer, which has a total energy of -623.6942 Hartrees. This suggests the trans- isomer is the thermodynamic product, which is confirmed by literature,[18] which states that the cis- isomer interconverts to the trans form readily. The reason for the trans isomer being more thermodynamically stable than the cis- isomer is most likely due to sterics. The PCl3 groups are bulky and therefore sterically demanding, and prefer to be further apart from each other.
Using this sterics argument, a way in which the stability of these isomers could be reversed, is to create ligands that have an attractive interaction and therefore prefer to be in close proximity as a cis- isomer. An example of such an attractive interaction is hydrogen bonding. For this reason, a complex such as Mo(CO)4(POH3)2 or Mo(CO)4(PNH2)2 would be expected to show the cis- isomer being the thermodynamic product.
Frequency Analysis
The advanced geometry optimised isomers of Mo(CO)4(PCl3)2 were set up for a frequency analysis and sent to the HPC server. The resulting output log files for the cis[19] and trans[20] isomer are given. The predicted Infrared spectra are shown in figures 14 and 15 below.
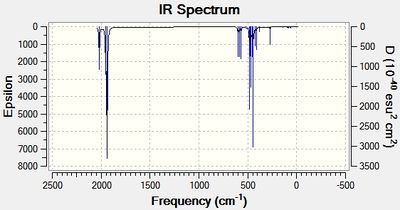
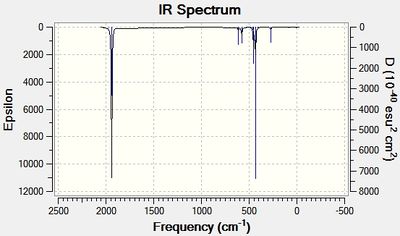
The absence of negative frequencies suggests the previous optimisation was successful. The vibrational modes are further analysed below, where they are compared to literature values. These vibrational modes were assigned using the point groups of the molecules: cis - C2v and trans - D4h. These point groups were not correctly assigned by GaussView, which will be explained shortly. Tables 4 and 5 below show how each carbonyl stretch is assigned a different symmetry label. These tables also include the low frequency vibrations which are due to Mo-P rotations. These rotations occur at such a low frequency due to the large substituents on both atoms. At room temperature, these Mo-P rotations occur readily as the energy exceeds the energy required for the rotation. Seeing as Gaussian does not consider the rotation of these Mo-P bonds, which results in a loss of symmetry of the complexes, this may be the reason for the incorrect assignment of the point groups.
| Description for Mode of Vibration | Type of Vibrational Mode | Intensity of Absorption | Frequency of Absorption (cm-1) | Literature value for Frequency (cm-1)[21] | Percentage Error (%) | Diagram |
|---|---|---|---|---|---|---|
| Rotation of the PCl3 groups - both PCl3 groups rotate symmetrically around the Mo-P bond | - | 0 | 12 | - | - | 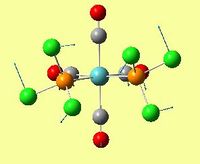 |
| Rotation of the PCl3 groups - both PCl3 groups rotate asymmetrically around the Mo-P bond | - | 0 | 20 | - | - |  |
| Asymmetric carbonyl stretch - two carbonyl groups trans to eachother stretch asymmetrically | B2 | 1605 | 1938 | 1986 | -2.41 |  |
| Asymmetric carbonyl stretch - two carbonyl groups trans to PCl3 groups stretch asymmetrically | B2' | 813 | 1942 | 1994 | -2.11 | 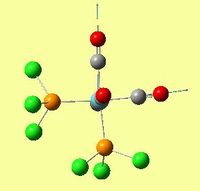 |
| Asymmetric carbonyl stretch - all four carbonyl groups stretch- two carbonyls stretch asymmetrically with respect to each other | A1' | 588 | 1952 | 2004 | -2.59 | 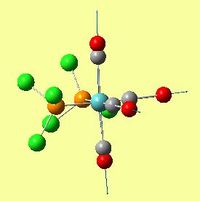 |
| Asymmetric carbonyl stretch - all four carbonyl groups stretch- two carbonyls stretch symmetrically with respect to each other | A1' | 545 | 2019 | 2072 | -2.55 | 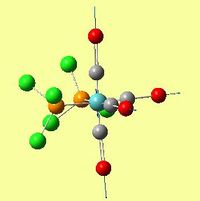 |
| Description for Mode of Vibration | Type of Vibrational Mode | Intensity of Absorption | Frequency of Absorption (cm-1) | Literature value for Frequency (cm-1)[22] | Percentage Error (%) | Diagram |
|---|---|---|---|---|---|---|
| Rotation of the PCl3 groups - both PCl3 groups rotate symmetrically around the Mo-P bond | - | 0 | 4 | - | - |  |
| Rotation of the PCl3 groups - both PCl3 groups rotate asymmetrically around the Mo-P bond | - | 0 | 7 | - | - | 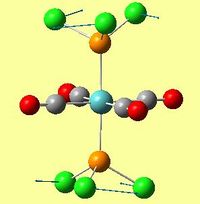 |
| Asymmetric carbonyl stretch - two carbonyl groups trans to eachother stretch asymmetrically | Eu | 1606 | 1939 | 1896vs | 2.27 | 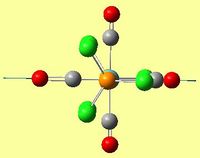 |
| Asymmetric carbonyl stretch - other two carbonyl groups trans to each other stretch asymmetrically | Eu | 1606 | 1940 | 1896vs | 2.32 | 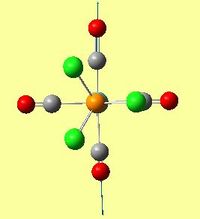 |
| Asymmetric carbonyl stretch - all four carbonyl groups stretch- two carbonyls stretch asymmetrically with respect to each other | B1g | 6 | 1967 | 1953m | 0.71 | 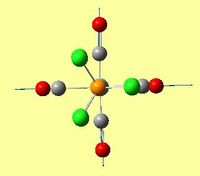 |
| Asymmetric carbonyl stretch - all four carbonyl groups stretch- two carbonyls stretch symmetrically with respect to each other | A1g | 5 | 2026 | - | - | 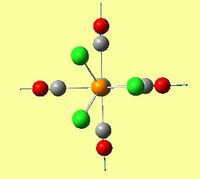 |
Tables 4 and 5 above show that the predicted IR spectra are very close to literature. The low frequency vibrations corresponding to the Mo-P rotations are not recorded in literature, as they are outside the usual region of measurement. For the cis- isomer, the predicted carbonyl peaks are very close to literature, with minor percentage errors of around -2% for each peak. For the trans- isomer, the percentage error between the predicted peaks and the two peaks found in literature was also very small. This suggests that firstly, the molecule was correctly optimised, and secondly, that the prediction method using the B3YLP method with the LANL2DZ basis set and extrabasis option is suitable for this complex.
For the cis- isomer, 4 distinct carbonyl vibrational modes were predicted, each with relatively high intensities. For the trans- isomer, 4 distinct carbonyl vibrational modes were predicted, however two of these modes have very low intensities. This is because these two asymmetric carbonyl stretches, B1g and A1g, do not distort the overall dipole moment of the molecule, and therefore are not apparent in IR. In figures 16 and 17 below, the carbonyl stretch regions of the IR spectra are shown. From these it can be clearly seen that the cis- isomer produces 4 peaks, yet two of them overlap due to their close proximity. The trans- isomer, on the other hand, shows 2 vibrational modes that have similar wavenumbers, therefore creating one overall, overlapping peak.


Mini Project - CpBeH and CpLi
This section of module 2 aims to use the techniques previously learned to further investigate the potential of computational methods to predict electronic structure and behaviour of inorganic molecules. The chosen molecules for this investigation are cyclopentadienylberyllium hydride, CpBeH, and cyclopentadienyllithium, CpLi. Using ab initio methods, the geometries of these complexes will be optimised, in order to find the lowest energy conformation. Then, a vibrational frequency study will be carried out, in order to confirm the optimisation was successful, and to compare the outcome with literature experimental values. Additionally, a molecular orbital and natural bond orbital analysis will be used to explain the dipole moments, charges, and bonding within these complexes.
Geometry Optimisation
As both complexes contain cyclopentadienyl ligands which are known to have variable hapticities, it would be ideal if the lowest energy conformation of both complexes would be analysed computationally. However, many problems were encountered upon doing so. Optimising the geometries always gave the ɳ5- cyclopentadienyl ligand, even with constrained point groups, suggesting this was indeed the lowest energy conformation for both complexes. Gaussview did not easily allow constraining certain bonds and angles whilst optimising. It was found that a visualisation program called Molden would be useful to implement these constraints, however within the scope of this project, it was not possible to explore it fully.
A report was found which investigated the ɳ1-, ɳ2- and ɳ5- geometries of these complexes using computational methods, in particular HF restricted STO-3G, and found the pentahapto bonding to be the most stable in both.[23] It was therefore decided to focus on the ɳ5- conformations of CpBeH and CpLi.
To optimise their geometries, firstly a lower level basis set was used - DFT B3YLP with 3-21G, then with a higher level basis set - DFT B3LYP with 6-31+G (d,p). Lastly, it was deemed to be necessary to use the MP2 method with 6-31+G (d,p), as this is known to include electron correlations and can therefore better model the π systems within the cyclopentadienyl ligands.
The log files for each of these optimisations can be found below.
| Complex | DFT B3YLP with 3-21G | DFT B3LYP with 6-31G + (d,p) | MP2 with 6-31G + (d,p) |
|---|---|---|---|
| CpBeH | DOI:10042/to-12983 | DOI:10042/to-12984 | DOI:10042/to-12985 |
| CpLi | DOI:10042/to-12988 | DOI:10042/to-12986 | DOI:10042/to-12987 |
A full analysis of geometries with bond lengths and angles can be seen in tables 8 and 9 below, including 3D structures. This is for the fully optimised structures using the MP2 method.
| Parameter | CpBeH Experimental [24] | CpBeH Computational |
|---|---|---|
| C-C (Å) | 1.423 | 1.423 |
| C-H (Å) | 1.09 | 1.08 |
| Be-ring (Å) | 1.49 | 1.90 |
| Be-H (Å) | 1.32 | 1.33 |
| C-H bending angle (°) | 0.9 [23] | 3.85a |
| Point Group | C5v | C1 |
a A positive angle signifies the hydrogen atom points out of the plane of the ring towards the Be atom.
| Parameter | CpLi Experimental [24] | CpLi Computational |
|---|---|---|
| C-C (Å) | 1.423 | 1.422 |
| C-H (Å) | 1.09 | 1.08 |
| Li-ring (Å) | 1.96 [25] | 2.15 |
| C-H bending angle (°) | -3.6 [23] | -2.17 b |
| Point Group | C5v | C1 |
b A negative angle signifies the hydrogen atom points out of the plane of the ring away from the Li atom.
The tables above show very good correlation between the literature values obtained experimentally and those predicted by the fully optimised structures created. When comparing CpBeH and CpLi, two large differences are seen. Firstly, the literature distance between the metal and the ring is larger for CpLi by 0.47Å. This could be attributed to the relative sizes of Li and Be, as Be is smaller and can therefore be closer to the Cp ring, but may also suggest a different bonding interaction may be present in CpLi to that found in CpBeH. The different possibilities to explain this outcome will be further analysed when looking at molecular orbitals and charge distributions. Secondly, another difference between the two structures is the C-H bending angle. For CpBeH, the hydrogen atoms point slightly towards the Be atom, whereas in CpLi, the hydrogen atoms point away from the Li atom. These out of plane C-H bending angles will also be further explained in the molecular orbital analysis.
The miscorrelation between the point groups expected and those assigned by Gaussview is most likely due to low frequency vibrations which distort the symmetry of the compounds, as was the case with the molybdenum complexes previously studied.
Frequency Analysis
Although a frequency analysis was obtained for all optimisation stages in order to confirm a successful optimisation, the fully optimised vibrational modes and spectra will be explained in detail in this section. The output .log files for CpBeH[26] and CpLi[27] are given.
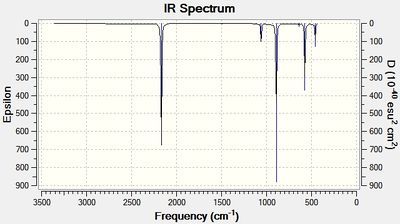
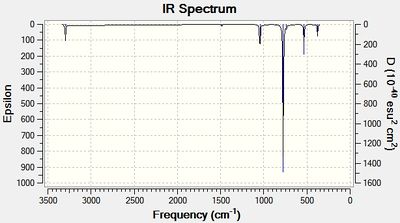
As can be seen in tables 10 and 11, the frequencies were positive suggesting a minimum in the potential energy surface was found.
The low frequencies found in the log files are also given below.
| Description for Mode of Vibration | Type of Vibrational Mode | Intensity of Absorption | Frequency of Absorption (cm-1) | Literature Frequency (cm-1 [28] | Diagram |
|---|---|---|---|---|---|
| Asymmetric Be-Cp rock - Be rocks back and forth with respect to Cp ring | E1 | 14.9 | 460 | 427 | 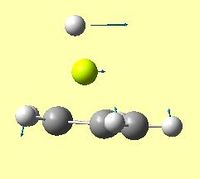 |
| Symmetric Be-Cp rock - Be rocks back and forth with respect to Cp ring | E1 | 14.9 | 460 | 427 | 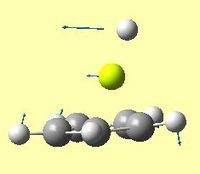 |
| Be-H bend- Be-H bond bends back and forth over Cp ring | E1 | 53.4 | 575 | 552 |  |
| Be-H bend - 'Be-H bond bends back and forth over Cp ring in a different direction | E1 | 53.4 | 575 | 552 | 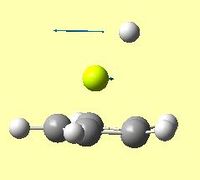 |
| C-H bend - all C-H bonds bend above and below plane of ring in a concerted manner | A1 | 196.7 | 892 | 875 |  |
| C-C stretch - two other C-C bonds stretch symmetrically with each other and the other C-C bond stretches asymmetrically with respect to the other two | A1 | 20.9 | 1060 | 1148 |  |
| C-C stretch - two other C-C bonds stretch symmetrically with each other and the other C-C bond stretches asymmetrically with respect to the other two | A1 | 20.9 | 1060 | 1148 | 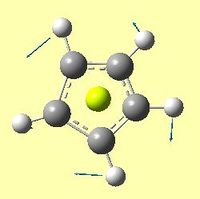 |
| Be-H stretch - Be-H bond contracts and lengthens | A1 | 245.5 | 2169 | 2106 | 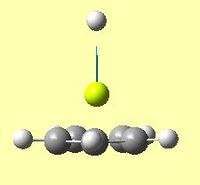 |
Low frequencies ---   -5.5329   -0.0011   -0.0005   -0.0004    0.2959    1.4766
Low frequencies ---  459.7549  459.7662  574.4568
| Description for Mode of Vibration | Type of Vibrational Mode | Intensity of Absorption | Frequency of Absorption (cm-1) | Literature Frequency (cm-1 [29] | Diagram |
|---|---|---|---|---|---|
| Asymmetric Li-Cp rock - Li rocks back and forth with respect to Cp ring | - | 10.95 | 377 | - |  |
| Symmetric Li-Cp rock - Li rocks back and forth with respect to Cp ring | - | 10.95 | 377 | - | 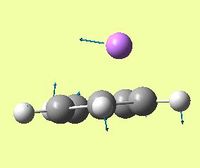 |
| Li-Cp stretch- Li-Cp bond lengthens and contracts | - | 40 | 533 | - | 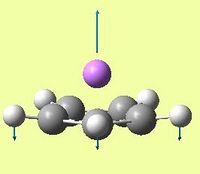 |
| C-H bend - all C-H bonds bend above and below plane of ring in a concerted manner | E1 | 289 | 775 | 759 | 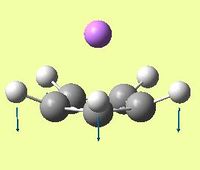 |
| C-C stretch - two C-C bonds stretch symmetrically with each other and the other C-C bond stretches asymmetrically with respect to the other two | E2 | 32.39 | 1045 | 1067 | 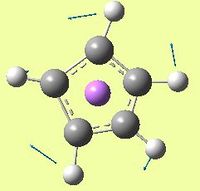 |
| C-C stretch - two other C-C bonds stretch symmetrically with each other and the other C-C bond stretches asymmetrically with respect to the other two | E2 | 32.40 | 1045 | 1067 | 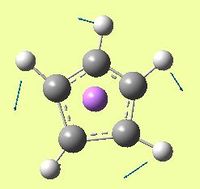 |
| Asymmetric C-H stretch - one C-H bond remains fixed while the other two pairs stretch asymmetrically | A1 | 15.358 | 3296 | 3104 | 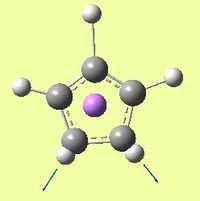 |
| Asymmetric C-H stretch - one C-H bond remains fixed while the other two pairs stretch asymmetrically | A1 | 15.36 | 3296 | 3104 | 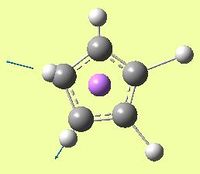 |
Low frequencies ---   -3.9787   -0.0001    0.0003    0.0011    0.1990    3.0849
Low frequencies ---  377.4722  377.6756  533.5827
Tables 10 and 11 above show the vibrational modes predicted for CpBeH and CpLi. It can be seen that they have similar vibrational modes concerning the Cp ring. For CpBeH, the C-H stretches at high frequencies are predicted, however at an intensity of 0, and are therefore not observable in the IR spectrum.
The Be-Cp and Li-Cp rocking vibrational bodes are perhaps the cause of Gaussview not being able to correctly predict the point groups for these complexes. At room temperature, these Be-Cp and Li-Cp vibrations occur readily as the energy exceeds the energy required for the rotation. Gaussian does not consider the vibration of these bonds, which result in a loss of symmetry of the complexes.
Natural Bond Order Analysis
The charge distributions for both compounds can be seen in figures 21 and 22, where bright red corresponds to a very negative charge, and bright green to a very positive charge. These were calculated using the .log files[30][31] from the molecular orbital analysis shown in the section below.
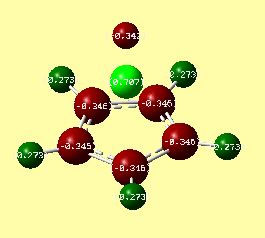

The results seem to indicate that Li is more positively charged than Be. Similarly, the Cp ring in the lithium complex is more negatively charged than in the beryllium complex. This suggests a more ionic bonding character in CpLi.
The data from the log file is shown below.
CpBeH:
  Summary of Natural Population Analysis:

                                      Natural Population
               Natural  -----------------------------------------------
   Atom  No    Charge         Core      Valence    Rydberg      Total
-----------------------------------------------------------------------
     C    1   -0.34643      1.99893     4.32197    0.02552     6.34643
     H    2    0.27346      0.00000     0.72508    0.00147     0.72654
     C    3   -0.34643      1.99893     4.32198    0.02552     6.34643
     H    4    0.27346      0.00000     0.72508    0.00147     0.72654
     C    5   -0.34643      1.99893     4.32197    0.02552     6.34643
     H    6    0.27346      0.00000     0.72508    0.00147     0.72654
     C    7   -0.34644      1.99893     4.32198    0.02552     6.34644
     H    8    0.27346      0.00000     0.72508    0.00147     0.72654
     C    9   -0.34641      1.99893     4.32196    0.02552     6.34641
     H   10    0.27345      0.00000     0.72508    0.00147     0.72655
    Be   11    0.70708      1.99927     1.28104    0.01260     3.29292
     H   12   -0.34222      0.00000     1.33990    0.00232     1.34222
=======================================================================
  * Total *    0.00000     11.99394    27.85619    0.14988    40.00000
CpLi:
Summary of Natural Population Analysis:

                                      Natural Population
               Natural  -----------------------------------------------
   Atom  No    Charge         Core      Valence    Rydberg      Total
-----------------------------------------------------------------------
     C    1   -0.39456      1.99902     4.37055    0.02500     6.39456
     H    2    0.24694      0.00000     0.75160    0.00147     0.75306
     C    3   -0.39439      1.99902     4.37038    0.02500     6.39439
     H    4    0.24693      0.00000     0.75160    0.00146     0.75307
     C    5   -0.39466      1.99902     4.37065    0.02500     6.39466
     H    6    0.24695      0.00000     0.75159    0.00147     0.75305
     C    7   -0.39456      1.99902     4.37055    0.02500     6.39456
     H    8    0.24695      0.00000     0.75159    0.00147     0.75305
     C    9   -0.39439      1.99902     4.37038    0.02500     6.39439
     H   10    0.24693      0.00000     0.75160    0.00146     0.75307
    Li   11    0.73786      1.99857     0.25973    0.00383     2.26214
=======================================================================
  * Total *    0.00000     11.99366    25.87021    0.13614    38.00000
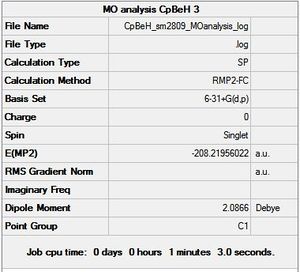
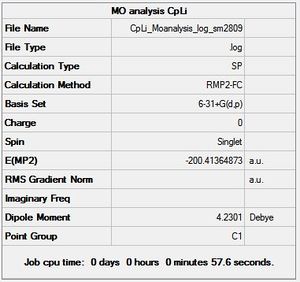
The dipole moments of these complexes were also analysed, and showed some interesting information. Firstly, the magnitude of the dipoles predicted which are shown in figures 23 and 24 are consistent with literature.[23] The magnitude of the dipole moment of CpLi is more than twice that of CpBeH, which once again confirms ionic bonding character in CpLi.
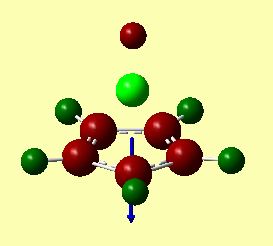
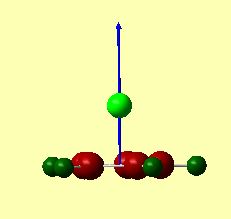
A pictorial representation of the dipole moments is given in figures 25 and 26. These were calculated by Gaussian, and represented to scale by Gaussview. These images clearly show that the dipole moments are in opposite directions. The arrowhead points towards the positively charged area. For CpBeH, the dipole surprisingly shows the negative end of the dipole closer to the Be-H. This confirms that the complex is highly covalently bound. If it were ionic, ie. Cp-BeH+, the dipole would have pointed towards the hydrogen.
For CpLi, the dipole moment is as expected for an ionic complex. The dipole points towards Li, suggests this is the positive end of the molecule, i.e. Cp-Li+ is predominant.
A highly covalent compound suggests there is some degree of electron donation from the Cp ring into the empty Be p orbitals, which should not be the case for CpLi. This information can be found in the .log files under the section 'Second Order Perturbation Theory Analysis,' which focuses on the interaction between certain molecular orbitals. Within this second order perturbation analysis, the relevant sections were chosen to illustrate this point- ie from unit 1 (the Cp ring) to unit 2 (the main group element fragment).
CpBeH:
Second Order Perturbation Theory Analysis of Fock Matrix in NBO Basis
    Threshold for printing:   0.50 kcal/mol
   (Intermolecular threshold: 0.05 kcal/mol)
                                                                             E(2)  E(j)-E(i) F(i,j)
        Donor NBO (i)                     Acceptor NBO (j)                 kcal/mol   a.u.    a.u.
===================================================================================================
 from unit  1 to unit  2
  1. BD (   1) C   1 - H   2        / 21. LP*(   1)Be  11                    1.42    0.97    0.035
  1. BD (   1) C   1 - H   2        / 22. LP*(   2)Be  11                    3.18    0.97    0.052
  1. BD (   1) C   1 - H   2        / 23. LP*(   3)Be  11                    5.43    1.12    0.073
  1. BD (   1) C   1 - H   2        /114. RY*(   1)Be  11                    0.18    1.63    0.015
  2. BD (   1) C   1 - C   3        / 22. LP*(   2)Be  11                    6.17    1.11    0.078
  2. BD (   1) C   1 - C   3        / 23. LP*(   3)Be  11                   24.40    1.26    0.164
 2. BD (   1) C   1 - C   3        /114. RY*(   1)Be  11                    0.07    1.77    0.010
  2. BD (   1) C   1 - C   3        /118. RY*(   5)Be  11                    0.11    2.47    0.015
  2. BD (   1) C   1 - C   3        /121. RY*(   8)Be  11                    0.09    1.83    0.012
  2. BD (   1) C   1 - C   3        /128. RY*(   1) H  12                    0.10    2.01    0.013
  2. BD (   1) C   1 - C   3        /144. BD*(   1)Be  11 - H  12            1.40    1.49    0.041
  3. BD (   2) C   1 - C   3        / 21. LP*(   1)Be  11                    0.07    0.61    0.006
  3. BD (   2) C   1 - C   3        / 22. LP*(   2)Be  11                   52.58    0.61    0.164
  3. BD (   2) C   1 - C   3        / 23. LP*(   3)Be  11                   70.62    0.76    0.212
  3. BD (   2) C   1 - C   3        /114. RY*(   1)Be  11                    0.10    1.26    0.011
  3. BD (   2) C   1 - C   3        /115. RY*(   2)Be  11                    2.23    1.41    0.054
  3. BD (   2) C   1 - C   3        /118. RY*(   5)Be  11                    0.07    1.97    0.011
  3. BD (   2) C   1 - C   3        /123. RY*(  10)Be  11                    0.51    0.73    0.019
  3. BD (   2) C   1 - C   3        /125. RY*(  12)Be  11                    0.58    3.33    0.043
  3. BD (   2) C   1 - C   3        /128. RY*(   1) H  12                    0.26    1.51    0.019
  3. BD (   2) C   1 - C   3        /144. BD*(   1)Be  11 - H  12            0.69    0.98    0.025
  4. BD (   1) C   1 - C   7        / 21. LP*(   1)Be  11                    6.04    1.12    0.077
  4. BD (   1) C   1 - C   7        / 22. LP*(   2)Be  11                    1.24    1.12    0.035
  4. BD (   1) C   1 - C   7        / 23. LP*(   3)Be  11                   27.08    1.27    0.173
  4. BD (   1) C   1 - C   7        /114. RY*(   1)Be  11                    0.06    1.77    0.010
  4. BD (   1) C   1 - C   7        /117. RY*(   4)Be  11                    0.06    2.48    0.011
  4. BD (   1) C   1 - C   7        /118. RY*(   5)Be  11                    0.06    2.48    0.011
  4. BD (   1) C   1 - C   7        /120. RY*(   7)Be  11                    0.08    1.83    0.011
  4. BD (   1) C   1 - C   7        /128. RY*(   1) H  12                    0.09    2.02    0.012
  4. BD (   1) C   1 - C   7        /144. BD*(   1)Be  11 - H  12            1.46    1.49    0.042
  5. BD (   1) C   3 - H   4        / 21. LP*(   1)Be  11                    1.74    0.97    0.039
  5. BD (   1) C   3 - H   4        / 22. LP*(   2)Be  11                    2.86    0.97    0.050
  5. BD (   1) C   3 - H   4        / 23. LP*(   3)Be  11                    5.44    1.12    0.073
  5. BD (   1) C   3 - H   4        /114. RY*(   1)Be  11                    0.18    1.63    0.015
  6. BD (   1) C   3 - C   5        / 21. LP*(   1)Be  11                    7.97    1.13    0.089
  6. BD (   1) C   3 - C   5        / 22. LP*(   2)Be  11                    0.65    1.13    0.025
  6. BD (   1) C   3 - C   5        / 23. LP*(   3)Be  11                   30.46    1.28    0.184
  6. BD (   1) C   3 - C   5        /114. RY*(   1)Be  11                    0.06    1.79    0.009
  6. BD (   1) C   3 - C   5        /118. RY*(   5)Be  11                    0.08    2.49    0.013
  6. BD (   1) C   3 - C   5        /120. RY*(   7)Be  11                    0.09    1.85    0.012
  6. BD (   1) C   3 - C   5        /128. RY*(   1) H  12                    0.08    2.03    0.011
  6. BD (   1) C   3 - C   5        /144. BD*(   1)Be  11 - H  12            1.55    1.51    0.043
  7. BD (   1) C   5 - H   6        / 21. LP*(   1)Be  11                    4.05    0.97    0.059
  7. BD (   1) C   5 - H   6        / 22. LP*(   2)Be  11                    0.55    0.97    0.022
  7. BD (   1) C   5 - H   6        / 23. LP*(   3)Be  11                    5.44    1.12    0.073
  7. BD (   1) C   5 - H   6        /114. RY*(   1)Be  11                    0.18    1.63    0.015
  8. BD (   1) C   5 - C   9        / 21. LP*(   1)Be  11                    1.91    1.11    0.043
  8. BD (   1) C   5 - C   9        / 22. LP*(   2)Be  11                    4.24    1.11    0.064
  8. BD (   1) C   5 - C   9        / 23. LP*(   3)Be  11                   24.42    1.26    0.164
  8. BD (   1) C   5 - C   9        /114. RY*(   1)Be  11                    0.07    1.77    0.010
  8. BD (   1) C   5 - C   9        /117. RY*(   4)Be  11                    0.09    2.47    0.014
  8. BD (   1) C   5 - C   9        /121. RY*(   8)Be  11                    0.07    1.83    0.010
  8. BD (   1) C   5 - C   9        /128. RY*(   1) H  12                    0.10    2.01    0.013
  8. BD (   1) C   5 - C   9        /144. BD*(   1)Be  11 - H  12            1.39    1.49    0.041
  9. BD (   2) C   5 - C   9        / 21. LP*(   1)Be  11                   16.33    0.61    0.091
  9. BD (   2) C   5 - C   9        / 22. LP*(   2)Be  11                   36.18    0.61    0.136
  9. BD (   2) C   5 - C   9        / 23. LP*(   3)Be  11                   70.72    0.76    0.212
  9. BD (   2) C   5 - C   9        /114. RY*(   1)Be  11                    0.10    1.26    0.011
  9. BD (   2) C   5 - C   9        /115. RY*(   2)Be  11                    1.54    1.41    0.045
  9. BD (   2) C   5 - C   9        /116. RY*(   3)Be  11                    0.69    1.41    0.030
 [...]
 10. BD (   1) C   7 - H   8        / 22. LP*(   2)Be  11                    0.27    0.97    0.015
 10. BD (   1) C   7 - H   8        / 23. LP*(   3)Be  11                    4.29    1.12    0.065
 10. BD (   1) C   7 - H   8        /114. RY*(   1)Be  11                    0.19    1.63    0.016
 10. BD (   1) C   7 - H   8        /116. RY*(   3)Be  11                    0.07    1.77    0.010
 11. BD (   1) C   7 - C   9        / 21. LP*(   1)Be  11                    2.27    1.12    0.047
 11. BD (   1) C   7 - C   9        / 22. LP*(   2)Be  11                    4.99    1.12    0.070
 11. BD (   1) C   7 - C   9        / 23. LP*(   3)Be  11                   27.09    1.27    0.173
 11. BD (   1) C   7 - C   9        /114. RY*(   1)Be  11                    0.06    1.77    0.010
 11. BD (   1) C   7 - C   9        /117. RY*(   4)Be  11                    0.10    2.48    0.014
 [...]
 18. CR (   1) C   9                / 23. LP*(   3)Be  11                    6.79   11.48    0.263
 18. CR (   1) C   9                /114. RY*(   1)Be  11                    0.33   11.99    0.056
 18. CR (   1) C   9                /115. RY*(   2)Be  11                    0.12   12.13    0.034
 18. CR (   1) C   9                /119. RY*(   6)Be  11                    0.09   12.03    0.029
 18. CR (   1) C   9                /122. RY*(   9)Be  11                    0.08   11.40    0.026
 18. CR (   1) C   9                /144. BD*(   1)Be  11 - H  12            0.13   11.71    0.035
 20. LP (   1) C   7                / 21. LP*(   1)Be  11                   44.42    0.37    0.143
 20. LP (   1) C   7                / 22. LP*(   2)Be  11                    3.58    0.37    0.041
 20. LP (   1) C   7                / 23. LP*(   3)Be  11                   42.73    0.52    0.166
 20. LP (   1) C   7                /115. RY*(   2)Be  11                    0.10    1.17    0.013
 20. LP (   1) C   7                /116. RY*(   3)Be  11                    1.21    1.17    0.046
 20. LP (   1) C   7                /118. RY*(   5)Be  11                    0.09    1.73    0.015
 20. LP (   1) C   7                /124. RY*(  11)Be  11                    0.32    0.50    0.015
 20. LP (   1) C   7                /125. RY*(  12)Be  11                    0.23    3.09    0.032
 20. LP (   1) C   7                /128. RY*(   1) H  12                    0.08    1.27    0.012
 20. LP (   1) C   7                /144. BD*(   1)Be  11 - H  12            0.39    0.75    0.021
134. BD*(   2) C   1 - C   3        / 21. LP*(   1)Be  11                   46.27    0.12    0.112
134. BD*(   2) C   1 - C   3        / 22. LP*(   2)Be  11                    0.06    0.12    0.004
134. BD*(   2) C   1 - C   3        /116. RY*(   3)Be  11                    0.55    0.92    0.040
134. BD*(   2) C   1 - C   3        /117. RY*(   4)Be  11                    0.12    1.48    0.024
134. BD*(   2) C   1 - C   3        /124. RY*(  11)Be  11                    0.24    0.25    0.014
140. BD*(   2) C   5 - C   9        / 21. LP*(   1)Be  11                   31.92    0.12    0.093
140. BD*(   2) C   5 - C   9        / 22. LP*(   2)Be  11                   14.40    0.12    0.063
140. BD*(   2) C   5 - C   9        /115. RY*(   2)Be  11                    0.17    0.92    0.022
140. BD*(   2) C   5 - C   9        /116. RY*(   3)Be  11                    0.38    0.92    0.033
140. BD*(   2) C   5 - C   9        /118. RY*(   5)Be  11                    0.11    1.48    0.023
140. BD*(   2) C   5 - C   9        /123. RY*(  10)Be  11                    0.07    0.25    0.008
140. BD*(   2) C   5 - C   9        /124. RY*(  11)Be  11                    0.16    0.25    0.011
CpLi:
 Second Order Perturbation Theory Analysis of Fock Matrix in NBO Basis
    Threshold for printing:   0.50 kcal/mol
   (Intermolecular threshold: 0.05 kcal/mol)
                                                                             E(2)  E(j)-E(i) F(i,j)
        Donor NBO (i)                     Acceptor NBO (j)                 kcal/mol   a.u.    a.u.
===================================================================================================
 from unit  1 to unit  2
  1. BD (   1) C   1 - H   2        / 20. LP*(   1)Li  11                    0.52    0.89    0.020
  1. BD (   1) C   1 - H   2        / 21. LP*(   2)Li  11                    0.68    0.89    0.023
  1. BD (   1) C   1 - H   2        / 22. LP*(   3)Li  11                    1.15    1.17    0.033
  1. BD (   1) C   1 - H   2        / 23. LP*(   4)Li  11                    0.29    0.82    0.014
  1. BD (   1) C   1 - H   2        /114. RY*(   1)Li  11                    0.09    1.37    0.010
  2. BD (   1) C   1 - C   3        / 21. LP*(   2)Li  11                    1.55    1.05    0.037
  2. BD (   1) C   1 - C   3        / 22. LP*(   3)Li  11                    3.95    1.33    0.065
  2. BD (   1) C   1 - C   3        / 23. LP*(   4)Li  11                    1.29    0.98    0.032
  2. BD (   1) C   1 - C   3        /117. RY*(   4)Li  11                    0.06    1.17    0.008
  3. BD (   2) C   1 - C   3        / 20. LP*(   1)Li  11                    0.13    0.51    0.008
  [...]
 16. CR (   1) C   7                / 21. LP*(   2)Li  11                    0.11   11.24    0.033
 16. CR (   1) C   7                / 22. LP*(   3)Li  11                    2.02   11.53    0.137
 16. CR (   1) C   7                / 23. LP*(   4)Li  11                    0.46   11.17    0.064
 16. CR (   1) C   7                /117. RY*(   4)Li  11                    0.12   11.36    0.033
 17. CR (   1) C   9                / 21. LP*(   2)Li  11                    0.74   11.24    0.083
 17. CR (   1) C   9                / 22. LP*(   3)Li  11                    2.01   11.53    0.137
 17. CR (   1) C   9                / 23. LP*(   4)Li  11                    0.46   11.17    0.064
 17. CR (   1) C   9                /117. RY*(   4)Li  11                    0.12   11.36    0.033
 19. LP (   1) C   5                / 20. LP*(   1)Li  11                   14.65    0.28    0.072
 19. LP (   1) C   5                / 21. LP*(   2)Li  11                    0.77    0.28    0.017
 19. LP (   1) C   5                / 22. LP*(   3)Li  11                    3.83    0.57    0.054
 19. LP (   1) C   5                / 23. LP*(   4)Li  11                    0.30    0.21    0.009
 19. LP (   1) C   5                /114. RY*(   1)Li  11                    0.13    0.76    0.012
 19. LP (   1) C   5                /116. RY*(   3)Li  11                    0.34    1.07    0.023
 19. LP (   1) C   5                /117. RY*(   4)Li  11                    0.07    0.40    0.006
 19. LP (   1) C   5                /118. RY*(   5)Li  11                    0.07    1.12    0.010
 19. LP (   1) C   5                /123. RY*(  10)Li  11                    0.08    0.85    0.010
130. BD*(   2) C   1 - C   3        / 20. LP*(   1)Li  11                   26.90    0.05    0.061
130. BD*(   2) C   1 - C   3        / 21. LP*(   2)Li  11                    0.21    0.05    0.005
130. BD*(   2) C   1 - C   3        /116. RY*(   3)Li  11                    0.15    0.84    0.020
130. BD*(   2) C   1 - C   3        /119. RY*(   6)Li  11                    0.09    0.89    0.016
138. BD*(   2) C   7 - C   9        / 20. LP*(   1)Li  11                   19.97    0.05    0.053
138. BD*(   2) C   7 - C   9        / 21. LP*(   2)Li  11                    7.15    0.05    0.031
138. BD*(   2) C   7 - C   9        /116. RY*(   3)Li  11                    0.11    0.84    0.017
138. BD*(   2) C   7 - C   9        /118. RY*(   5)Li  11                    0.07    0.89    0.014
Firstly, it is important to note a much larger number of donor-acceptor interactions within the CpBeH complex. In fact, when looking at those which yield an E(2) energy of over 20kcalmol-1, and are therefore representative of significant mixing between orbitals, the CpLi complex clearly shows less donor-acceptor interactions. The yellow highlighted interactions are those of a large degree and therefore of importance. For CpBeH, the yellow higlighted interactions are between carbon lone pairs and Be anti-bonding lone pairs. When looking closely, there are also interactions between bonding carbon orbitals and beryllium anti-bonding orbitals. An example is shown by the pink highlighted line. This corresponds to the Cp ring donating electron density into the empty beryllium p orbital.
These findings therefore further support the notion that the CpBeH complex consists of highly covalent bonding interactions, whereas CpLi consists of mainly ionic interactions.
MO Analysis
CpBeH - chk file[30]
The molecular orbital diagram expected for CpBeH was qualitatively drawn below in figure 27. This diagram includes only the Cp π interactions with the Be-H fragment valence electrons. It can be seen that the Be-H fragment is slightly more complicated than expected, as the anti-bonding molecular orbital concerning the Be-H s orbital overlap mixes with the Be p orbitals, giving an a1 sp H-Be orbital. This affects the molecular orbitals of CpBeH.

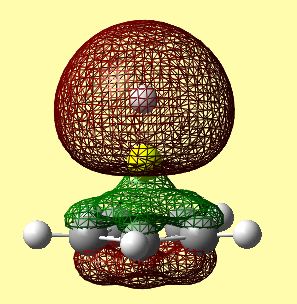
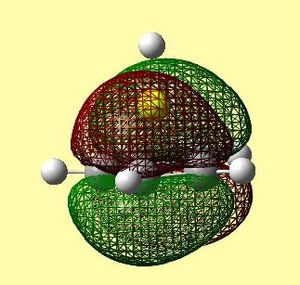
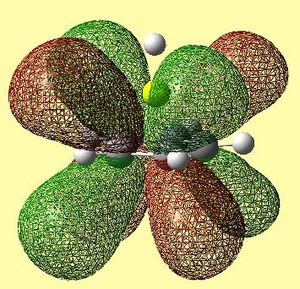
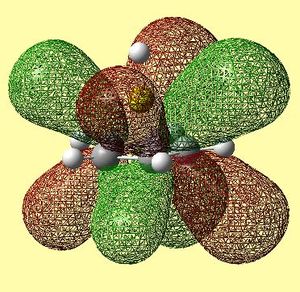
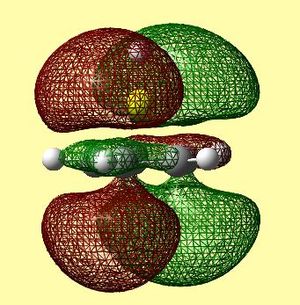
The molecular orbitals shown above can be compared to the calculated molecular orbitals shown in the table below.
| HOMO -2 | HOMO -1 | HOMO | HOMO |
|---|---|---|---|
 |
 |
 |
 |
| LUMO | LUMO | LUMO + 1 | LUMO +1 | LUMO + 2 |
|---|---|---|---|---|
 |
 |
 |
 |
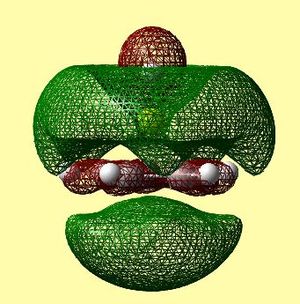 |
Firstly, it is noted that the calculation using gaussian produced 20 occupied molecular orbitals, which is as expected seeing as there are a total of 40 electrons in the complex. For those orbitals which were expected to be degenerate, degeneracy was found in the predicted molecular orbitals.
However, when comparing figure 22 and tables 12 and 13, it can clearly be seen that the order of many orbitals was misjudged. A large discrepancy that arises is the order of the molecular orbitals. Many orbitals that correspond to the Cp ring with contributions from py and pz carbon atomic orbitals are so high in energy that they come between the HOMO and the HOMO-1. This means the labelling of these in table 10 is merely to be able to compare the qualitative diagram to the calculated orbitals, and not, because this is the exact energy order outcome from the calculations. The two degenerate HOMO's are very similar qualitatively and quantitatively. The order of what should be the HOMO-1 and HOMO-2 are inversed in the calculated orbitals. This may depict reality, or could be due to an error relating to the method used.
The HOMO-2 orbital seems to correlate to the qualitative MO diagram, however it looks as though there is a slight bonding interaction, although it was suspected to be non-bonding. This is because the small lobe of the p orbital is perfectly positioned to interact with the π system of the Cp ring. This can be seen in table 12, as the green electron density from the Cp ring rises towards the Be. The HOMO-1 orbital also correlates- in table 12 it can be seen that a small gap in the electron density occurs above the Be atom. However, it is difficult to tell whether this is a nodal region or a region of oppositely phased electron density.
Table 13 shows the LUMO range of molecular orbitals. The two degenerate LUMO orbitals are similar to what was predicted qualitatively, however, the pz orbitals seem to be slightly bent outwards. The degenerate LUMO+1 orbitals and the LUMO+2 orbital are also similar to those predicted qualitatively. Again, these unoccupied orbitals were not in the order as was expected - there were many anti-bonding orbitals corresponding to px and py π ring contributions altering the order.
CpLi - chk file[31]
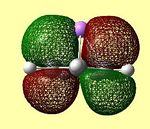
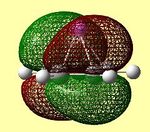
When taking into account the natural bond order analysis above, it is expected to find mainly ionic interactions between the Cp ring, which is therefore Cp-, and Li+. With this in mind, the molecular orbitals calculated by gaussian should mainly be the relative atomic orbitals of Cp and Li, and not many interactions between them, as the atomic orbitals do not linearly overlap to form molecular orbitals as they did in CpBeH.
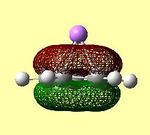
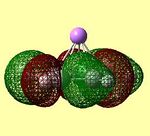
| LUMO | LUMO | HOMO | HOMO | HOMO - 1 | HOMO -2 | HOMO -3 |
|---|---|---|---|---|---|---|
 |
 |
 |
 |
 |
 |
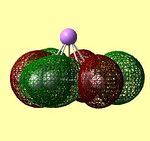 |
These molecular orbitals clearly show that the contributions are either from the Cp ring, or from the Li atom, but not from both, suggesting ionic character. In the case of an ionic complex, the molecular orbital diagram is merely the atomic orbitals from each fragment in the correct energy order. These are then filled from the lowest energy upwards. The orbital diagrams above show that the lithium s orbital electrons are lower in energy than the cyclopentadienyl pz electrons, as the lithium orbitals do not feature in the 'molecular' orbitals. This is as expected as s orbitals are closer to the nucleus and therefore lower in energy. The HOMO-2 and HOMO-3 orbitals consist of px and py orbital contributions from the carbon atoms in the Cp ring. The HOMO-1 orbital consists of the carbon pz orbitals all in the same phase above and below the Cp ring. The degenerate HOMO orbitals also consist of the carbon pz orbitals with differing phases on adjacent carbon atoms. (the e1 Cp fragment orbitals) All HOMO orbitals decribe the Cp fragment orbitals that can be seen in figure 22 above, and exclude the notion of mixing between Li and Cp orbitals. The degenerate LUMO orbitals show the empty px and py orbitals on Li. This shows the extent to which the empty Li p orbitals are high in energy, as they have a higher energy than the cyclopentadienyl carbon p orbitals, which are therefore occupied.
C-H bond bending out of plane of Cp ring
One of the aims of the molecular orbital analysis was to explain the C-H bend angle out of the plane, which is present in both complexes. As shown in the geometry optimization section, the hydrogen atoms in the Cp ring are slightly angled towards Be in CpBeH, and slightly angled away from Li in CpLi. This is primarily due to the fact that both complexes want to improve their orbital overlap between the carbon pz orbitals and the main group element. The diffuse nature of the main group orbitals causes the π orbitals of the Cp ring to rehybridise by bending the C-H bonds out of the plane of the ring in order to increase the overlap and decrease size mismatch. Li has more diffuse orbitals than Be, as it is the first element in its period. Seeing as Li therefore has p orbitals that are larger than the optimum size for the best overlap with the Cp π orbitals, the hydrogen atoms bend away from Li in order to create a larger π-p overlap.[32] The opposite is true for Be - smaller p orbitals require the π orbitals of the Cp ring to bend inwards, forcing the C-H bonds to bend towards the beryllium. This can be clearly seen in figure 28. Another explanation has been proposed by K. Waterman and A. Streitwieser,[33] who suggests that the bending of the hydrogen atoms away from the lithium is due to coulombic forces as it is a partly ionic compound. A positively charged metal centre, such as Li, will prefer greater electron density (negatively charged) on the face of the Cp ring that is closest to it. The effect of this is the bending of the hydrogen atoms away from Li, so that the p lobes of the carbon π orbitals on the side of Li are closer.
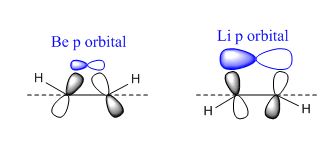
Unfortunately, this phenomenon is difficult to see by analysing the molecular orbitals, as the carbon p orbitals create one large, delocalised π system, hindering the ability to view the bending of the individual p orbitals. However, as the bend angles were measured, the effect can be confirmed to be present.
Conclusion
In conclusion, computational methods have made it possible to confirm the covalency within ɳ5-CpBeH, and the ionic bonding character of ɳ5-CpLi which is cited in literature.[23] This was done using a natural bond order analysis, which confirmed oppositely directioned dipole moments. Similarly, the molecular orbital analysis showed a large degree of fragment orbital mixing to form molecular orbitals for CpBeH, and a non-existant degree of fragment orbital mixing in CpLi. Aditionally, the optimised geometries showed that the hydrogen atoms were bent out of the plane of the cyclopentadenyl ring. For CpBeH, the hydrogen atoms were bent towards Be by 3.85°, whereas in CpLi, the hydrogen atoms were bent away from Li by 2.17°. Overall, the MP2 method was successful in optimising the geometry of the complexes, and predicting the delocalisation in the Cp rings which was apparent in the molecular orbitals produced.
References
- ↑ M. S. Schuurman, W. D. Allen, H. F. Schaefer, Journal of Computational Chemistry, 2005, 26, 1106 DOI:10.1002/jcc.20238
- ↑ B. Khater, J. Guillemin, A. Benidar, D. Bégué, C. Pouchan. J. Chem. Phys. 129, 224308 (2008)DOI:10.1063/1.3035902
- ↑ https://wiki.ch.ic.ac.uk/wiki/index.php?title=Mod:Sabrina
- ↑ 4.0 4.1 DOI:10042/to-12898
- ↑ J. Mullay, J. Am. Chem. Soc., 106, 1984, pp 5842 - 5847
- ↑ J. Blixt et al., J. Am. Chem. Soc., 117, 1995, pp 5089 - 5104
- ↑ M. Anatosov et al., J. Phys. Chem., 105, 2001, pp 5450 - 5467
- ↑ J. Blixt, J. Glaser, J. Mink, I. Persson, P. Persson, M. Sandstroem. J. Am. Chem. Soc., 1995, 117 (18), pp 5089–5104 DOI:10.1021/ja00123a011
- ↑ DOI:10042/to-12909
- ↑ DOI:10042/to-12910
- ↑ DOI:10042/to-12916
- ↑ DOI:10042/to-12913
- ↑ DOI:10042/to-12920
- ↑ DOI:10042/to-12919
- ↑ F. A. Cotton, Inorg. Chem., 21, 1982, pp 294 - 299
- ↑ D. W. Bennett, J. Chem. Cryst., 34(6), 2004, pp 353 - 359
- ↑ 17.0 17.1 R. Wehmschulte, M. A. Khan, S. I. HossainInorg. Chem. 40, 2001. pp2756-2762DOI:10.1021/ic0014538
- ↑ Donald J. Darensbourg. Inorg. Chem., 1979, 18 (1), pp 14–17
- ↑ DOI:10042/to-12922
- ↑ DOI:10042/to-12923
- ↑ E. C. Alyea, S. Song. Inorg. Chem., 1995, 34 (15), pp 3864–3873 DOI:10.1021/ic00119a006
- ↑ M. Ardon, G. Hogarth, D. Oscroft. J. Organometallic Chem. 689 (15) 2004 pp2429-2435 DOI:10.1016/j.jorganchem.2004.04.030
- ↑ 23.0 23.1 23.2 23.3 23.4 E.l D. Jemmis, S. Alexandratos,P v. R. Schleyer, A. Streitwieser, H. F. Schaefer. J. Am. Chem. Soc. 100, (18), 1978, pp 5695 DOI:10.1021/ja00486a018
- ↑ 24.0 24.1 T. C. Bartke, A. Bjorseth, A. Haaland, K. Marstokk, and H. Mollendal. J. Organomet. Chem., 271(85),1975
- ↑ J. Leal,V. Cachata, A. Carvalho. European Journal of Inorganic Chemistry, 6, 2001, pp. 1587 - 1592
- ↑ DOI:10042/to-13015
- ↑ DOI:10042/to-13016
- ↑ M. Hurtado, A. Lamsabhi,O. Mo, M. Yannez, J. Guillemin. Dalton Transactions, 39, 2010 pp. 4593 - 4601
- ↑ I. Garbuzova, O. Garkusha, B. Lokshin, G. Borisov, T.Morozova. Journal of Organometallic Chemistry, 1985 , vol. 279, pp. 327 - 336
- ↑ 30.0 30.1 DOI:10042/to-13099
- ↑ 31.0 31.1 DOI:10042/to-13100
- ↑ E. Jemmis, P. Schleyer. J. Am. Chem. Soc. 104 (18), 1982, pp. 4787 DOI:10.1021/ja00382a008
- ↑ K. Waterman and A. Streitwieser. J. Am. Chem. Soc., 106, 1984, pp 3140 DOI:10.1021/ja00323a012


