Rep:Mod:SabrinaThree
Sabrina Maas, CID: 00595314, Module 3
Previously, we have used computational methods to optimise structures, predict spectra and analyse molecular orbitals. This module aims to optimise reactants in order to then optimise transition states of pericyclic reactions. The molecular orbitals of these transition states, as well as their relative energies, will be used to determine and explain their relative stabilities. This will allow the computational calculations to explain results about reaction pathways seen experimentally. As the transition state is a maximum on a potential energy surface, the Schrödinger equation will be used to calculate the potential energy surfaces of a Cope rearrangement and two Diels Alder cycloadditions.
The Cope Rearrangement
Introduction
This section aims to investigate the pericyclic Cope rearrangement of 1,5-hexadiene by analysing the reactants, products, and transition states computationally. The mechanism of this reaction, including the possible transition states, can be found in figure 1 below.
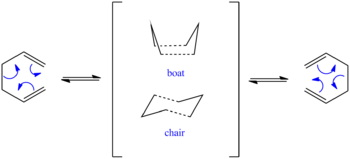
By optimising the geometries of several different possible anti and gauche conformations, the most thermodynamically stable conformations will be found. Then, it will be investigated whether the reaction is more likely to proceed via a chair or boat transition state by comparing the energies of each conformation.
Throughout this section, the molecules are drawn in Gaussview, however optimisation and frequency calculations were performed using Gaussian through the SCAN server.
Optimisation
Due to the free rotation of the C-C single bonds, there are many possible conformations of 1,5-hexadiene. These different geometries of 1,5-hexadiene were optimised using a low level basis set in order to obtain the most thermodynamically stable conformations by analysing their relative energies. The method used was Hartree-Fock / 3-21G. As it was expected that the eclipsed conformations would be higher in energy than the staggered conformations due to steric hindrance, the staggered conformations were the main focus of this optimisation. In total, 10 different staggered conformations were found - 6 are gauche and 4 are anti-periplanar. These different conformations were drawn in Gaussview using the dihedral driver to change the dihedral angles, (anti: 180° and gauche: 60°) creating the respective products. These geometries were then cleaned in Gaussview and then sent to SCAN to be optimised with a %memory limit 250MB. The resulting conformations can be seen in table 1 below, with their respective log files. A 3D representation of each conformer can be seen by clicking on the conformer titles.
| Conformer (with LOG File) | Total Energy (Hartrees) | Relative Energy (Kcal mol-1) | Point Group |
|---|---|---|---|
| Anti 1[1] | -231.69260 | +0.04 | C2 |
| Anti 2[2] | -231.69254 | +0.08 | Ci |
| Anti 3[3] | -231.68907 | +2.25 | C2h |
| Anti 4[4] | -231.69097 | +1.06 | C1 |
| Gauche 1 [5] | -231.68772 | +3.10 | C2 |
| Gauche 2 [6] | -231.69167 | +0.62 | C2 |
| Gauche 3 [7] | -231.69266 | 0.00 | C1 |
| Gauche 4 [8] | -231.69153 | +0.71 | C2 |
| Gauche 5 [9] | -231.68962 | +1.91 | C1 |
| Gauche 6 [10]
|
-231.68916 | +2.20 | C1 |
Table 1 above shows that on average, the gauche conformations are higher in energy than the anti conformations. This may be due to the unfavourable steric intereactions which originate from the proximity of the two terminal alkenes. The three most stable conformers are anti 1, anti 2 and gauche 3, with gauche 3 being the most stable conformer by 0.04 kcalmol-1 relative to anti 1 and 0.08 kcalmol-1 relative to anti 2. These three most stable conformations were re-optimised with DFT/B3LYP method with a 6-31G(d) basis set. This aims to give a more accurate representation of the relative energies, as the B3LYP method better models the effect of electron correlation. The results can be seen in table 2 below, along with log files and 3D representations.
| Conformer (with LOG File) | Total Energy (Hartrees) | Relative Energy (Kcal mol-1) | Point Group |
|---|---|---|---|
| Anti 1 [11] | -234.61179 | 0.00 | C2 |
| Anti 2 [12] | -234.61171 | +0.05 | Ci |
| Gauche 3 [13] | -234.61133 | +0.29 | C1 |
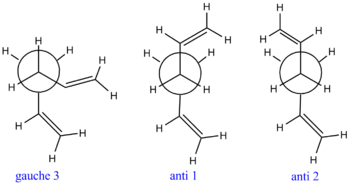
This method proves to be more accurate as it depicts the expected situation where the anti conformers are lower in energy than the gauche conformer. The anti conformers are expected to be lower in energy due to the optimum orbital overlap between the anti-periplanar allyl functional groups. The number of stabilising anti-periplanar relationships between the σ C-H / σ* C-C and σ C-C / σ* C-C orbitals is larger in the anti conformers than in the gauche conformer. This is due to the dihedral angle in the gauche conformer being 66.3°, whereas the optimum dihedral angle for gauche conformers is 60°. The optimum orbital overlap is achieved with a dihedral angle of 180°. Anti 1 shows a dihedral angle of 176.7°, and anti 2 shows a dihedral angle of 180.0°. THe newman projections of these three conformers are shown in figure 2 below. This clearly shows that gauche 3 experiences the most steric repulsion of the allyl groups, contributing to its higher energy.
Frequency Analysis
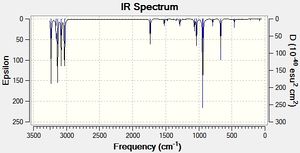
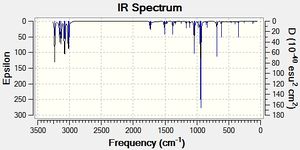
A frequency analysis of the three most stable conformers of 1,5-hexadiene was carried out. This was primarily done to confirm that each structure is one of minimum energy (ie the optimisation was successful), rather than a transition state. Considering a potential energy surface, it is obvious that when the first derivative of this surface is zero, it is indicative of minimum or maximum at this point. However, in order to differentiate between a minimum or maximum, the second derivative must be calculated. This is carried out by a frequency analysis. Positive frequencies confirm a minimum, one negative frequency suggests a transition state, and more negative frequencies suggests the optimisation has not been successful.
| Conformer (with LOG File) | Symmetric C=C Stretch | Asymmetric C=C Stretch (cm-1) | ||
|---|---|---|---|---|
| Frequency (cm-1) | Intensity | Frequency (cm-1) | Intensity | |
| Anti 1 [14] | 1732 | 5 | 1735 | 14 |
| Anti 2 [15] | 1731 | 0 | 1734 | 18 |
| Gauche 3 [16] | 1732 | 7 | 1733 | 6 |
The C=C stretches were found in the expected[17] region of the IR spectrum. The log files showed no negative frequencies, thus confirming the conformers to beat global energy minima. The full IR spectra can be seen in figures 3,4 and 5.
 |
 |
 |
Thermochemical Data Analysis
Thermochemical data at 298.15K was obtained from the frequency analysis log files of each conformer. The data at a temperature of 0K was obtained by editing the input file for the frequency analysis at 298.15K with the keywords freq=readisotopes, and the temperature set to 0.00001K, as Guassian is unable to deal with 0K. Aditionally, the isotope masses of the atoms were included at the end of the log file. A list of energies (in Hartrees) was obtained for each of the 3 conformers at both 298.15 and 0K . Their significances are shown below.
- Sum of electronic and zero-point Energies - potential energy at 0 K including the zero-point vibrational energy (E = Eelec + ZPE)
- Sum of electronic and thermal Energies - energy including contributions from the translational, rotational, and vibrational energy modes at the specific temperature (E = E + Evib + Erot + Etrans)
- Sum of electronic and thermal Enthalpies - additional correction for RT (H = E + RT)
- Sum of electronic and thermal Free Energies - contribution to the free energy (G = H - TS)
Anti 1: [0K log [18]]
Sum of electronic and zero-point Energies= -234.469298 -234.469298
Sum of electronic and thermal Energies= -234.461966 -234.469298
Sum of electronic and thermal Enthalpies= -234.461022 -234.469298
Sum of electronic and thermal Free Energies= -234.500862 -234.469298
Anti 2: [0K log [19] ]
Sum of electronic and zero-point Energies= -234.469204 -234.469204
Sum of electronic and thermal Energies= -234.461857 -234.469204
Sum of electronic and thermal Enthalpies= -234.460913 -234.469204
Sum of electronic and thermal Free Energies= -234.500777 -234.469204
Gauche 3: [0K log [20] ]
Sum of electronic and zero-point Energies= -234.468693 -234.468693
Sum of electronic and thermal Energies= -234.461464 -234.468693
Sum of electronic and thermal Enthalpies= -234.460520 -234.468693
Sum of electronic and thermal Free Energies= -234.500105 -234.468693
The main difference between the properties calculated at 298.15K and at 0K is that at 0K, each property gives the same total energy. This directly suggests that there is no thermal contribution to the total electronic and zero-point energies at this temperature. Therefore, all properties give the same total, which is essentially the total electronic energy including the zero-point energy.
Going from 0K to 298.15K, it can be seen that terms increase, (become more positive) except for the contribution to the free energy, which decreases. This can be explained by looking at the equation for the Gibbs free energy, G= H - TS. As the temperature rises, G decreases, resulting in a smaller contribution at 0K than at 298.15K.
Also, it can be noted that the sum of electronic and zero-point energies is identical at 0K and 298.15K. This is because the zero point energy is not affected by temperature.
Transition State Optimisation
CHAIR
Two different methods of optimising the chair transition state were investigated and compared. The allyl fragment CH2CHCH2 was optimised using HF/ 3-21G [21] and then two identical optimised fragments were placed in a new window and their relative positions altered to resemble a chair. The terminal carbon atoms were placed 2.2Å apart. This structure was the starting point for both methods outlined below.
Force Constant Matrix
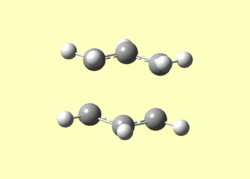
This method consists of the optimisation of the transition state by computing a Hessian matrix at each step. This was carried out by a Opt+Freq with HF/3-21G calculation, and the option 'Optimise to a TS (Berny).' This was selected so that so that a transition state (maximum) rather than a product (minimum) was found, and force constants were set to be calculated once. 'Opt=NoEigen' was added to the keywords in order for a global maximum to be found. If successful, an imaginary negative vibration should be predicted, corresponding to the attainment of a transition state. The output log file[22] was obtained, and showed one negative vibration.
| Animation of Frequency | Frequency of Absorption (cm-1) | Energy (Ha) |
|---|---|---|
 |
-818 | -231.61932 |
Freezing Reaction Coordinates
This method involved placing constraints on the fragments during optimisation. It was decided that the two pairs of two terminal carbons would be set to 2.2Å apart. This structure was then optimised with a HF/ 3-21G method and basis set. The output log file can be found here[23] and the resulting geometry of the structure corresponds to the rest of the molecule having an optimised geometry, however with a fixed distance between the two fragments. Now, in order to achieve the true transition state, this interatomic distance constraint was removed, and the structure was optimised to a transition state again with a HF/ 3-21G method and basis set. This allowed the structure to find the optimum transition state distance between the two fragments. The output log file can be found here[24], and the final 3D optimised structure is shown in figure 6. This geometry was also showed one negative frequency and an energy equal to the results obtained when the structure was optimised using the force constant matrix method.
| |||
| Figure 6- 3D representation of the optimised transition state using the freezing coordinates method |
BOAT
The boat transition state was optimised using a different technique to the chair optimisation. This involved drawing both the reactant and product 1,5-hexadiene molecules, and altering the numbering of the atoms so that the product is distinguishable from the reactant. The calculation then involved finding a transition state between the reactant and product structures, called the QTS2 method. This method does not involve having to 'guess' the transition structure as was done for the chair conformation above, but instead invloves quadratically interpolating between product and reactant geometries to get closer to the quadratic region of the potential energy surface.
It is vital for the labelling of the reactant and product and their orientations to be correct, as otherwise, this optmisation fails due to multiple angle and dihedral rotations that need to be carried out along the reaction pathway. The atoms were labelled as in figures 6a and 6b below, and given a geometry with a dihedral angle of the central four carbon atoms equal to 0°. The angles between carbons 1,2,3 and 4,5,6 were set to 100°. The structures used were the anti 2 1,5-hexadiene conformations, which had been optimised using DFT/6-31G(d).
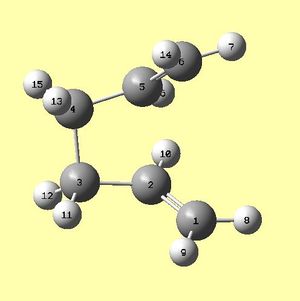 |
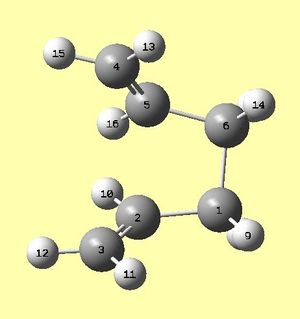 |
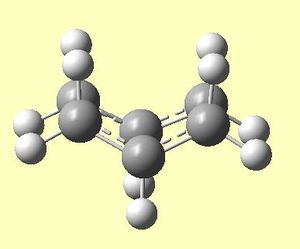
This resulted in an output .chk file[25] and the optimised boat structure seen in figures 7a and 7b below.
 |
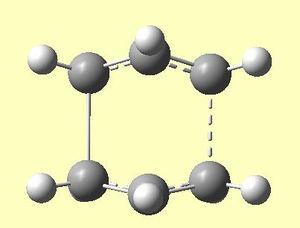 |
Figure 7b clearly confirms a transition state as the dashed bond indicates the formation of a bond. This is further confirmed by one negative, imaginary frequency.
| Animation of Frequency | Frequency of Absorption (cm-1) | Energy (Ha) |
|---|---|---|
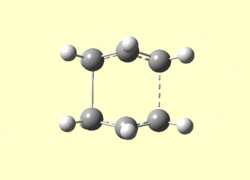 |
-840 | -231.60280 |
By comparing the energies of the optimised boat and chair transition states, it can be seen that the chair transition state is lower in energy and therefore more thermodynamically stable. The reasons for this will be fully explored by investigating the activation energies.
Intrinsic Reaction Coordinate
It is extremely difficult to predict which conformers of 1,5-hexadiene are formed from the boat and chair structures by merely inspecting the structures. In order to determine which conformer is created from the transition state to the end of the reaction pathway, the intrinsic reaction method, or IRC, can be used. This allows the following of the minimum energy pathway from a transition structure to its local minimum on the potential energy surface. For a system with zero kinetic energy, this path is the path from the highest energy saddle point to the minima on either side - which correspond to the reactant and product. Seeing as the reactant and product in this Cope rearrangement are identical, the IRC will be run in the forward direction only.
CHAIR
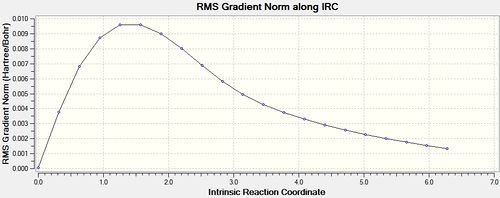
An IRC starting at the chair transition state structure was run as a new calculation with the method: IRC, HF /3-21G. The force constants were set to be calculated once, and the maximum number of points along the IRC was set to 50. This resulted in a .chk file [26] which did not reach a minimum geometry. This can be seen below, as the slope of the IRC graph, after 21 steps, is not yet 0. Additionally, the total energy of the geometry after 21 steps does not correlate with any of the conformations of 1,5-hexadiene investigated previously. (see table 1)
| Energy and RMS Graphs | Animation | Energy (Ha) |
|---|---|---|
 |
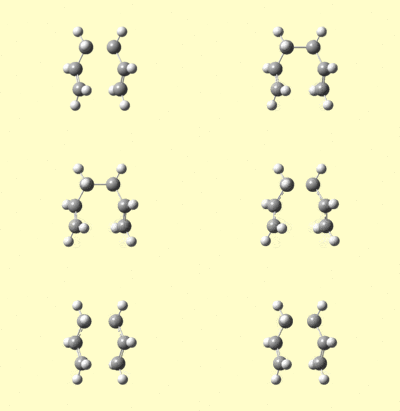 |
-231.62897 |
|
In order to obtain the minimum energy geometry, three possible routes will be taken. Firstly, the structure for the last IRC iteration can be taken and optimised. Secondly, the IRC can be re-run with a larger maximum number of iterations, so that the calculation can proceed to completion and find a minimum. Thirdly, the IRC can be re-run with the specification that the force constants be calculated at every step of the pathway. The outcomes of each of these methods are shown below.
- Optimising the structure from the last IRC iteration
This method proves to be extremely rapid and easy, however, in the case where the final iteration of the IRC is not close to the required minimum, the optimised structure may be incorrect. The structure from the final iteration was optimised using HF/ 3-21G resulting in an output file [27] and the following structure and energy:
| Final Optimised Product | Energy (Ha) | Point Group | |||
|---|---|---|---|---|---|
|
-231.69167 | C2 |
The energy and point group of this optimised structure are identical to those of the gauche 2 conformer.
- IRC with larger maximum number of iterations
This method requires slightly more computational power, and in this case, produces the exact same results as the previous method explained. This is because the number of iterations still remains 21, although a maximum of 200 points was chosen, therefore not altering the minimum geometry found. This method therefore would only prove to be useful if the calculation had not reached a minimum after proceeding for 50 iterations. The output file can be accessed here[28], and resulted in a gauche 2 geometry with point group C2 as above.
- IRC with force constants at every step
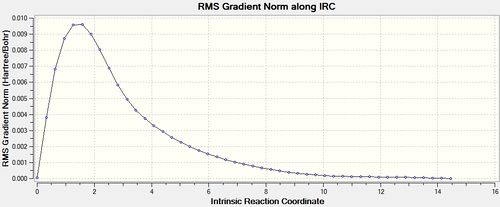
This method is the most computationally demanding, however also the most reliable. As can be seen in the figures below, the optimisation was run to completion after 47 steps as the gradient approaches and reaches 0. The force constant calculation was set to 'always,' resulting in an output file [29] and the following results:
| Energy and RMS Graphs | Animation | Energy (Ha) |
|---|---|---|
 |
 |
-231.69167 |
|
This method also results in the gauche 2 conformer of 1,5-hexadiene with a point group of C2.
BOAT
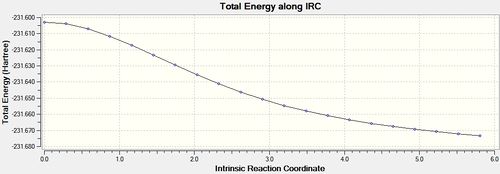
The same procedures were carried out using the boat transition state as a starting point for the IRC. Calculation: IRC, HF /3-21G. The force constants were set to be calculated once, and the maximum number of points along the IRC was set to 50. This resulted in a .chk file [30] which again did not reach a minimum geometry after 21 steps.
| Energy and RMS Graphs | Animation | Energy (Ha) |
|---|---|---|
 |
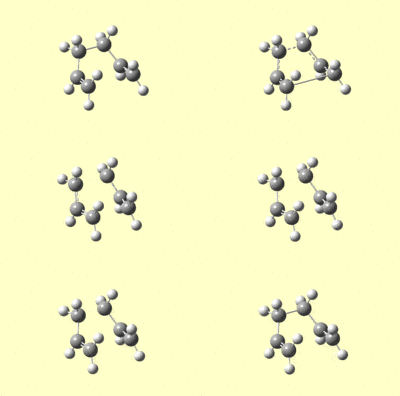 |
-231.67317 |

|
- Optimising the structure from the last IRC iteration
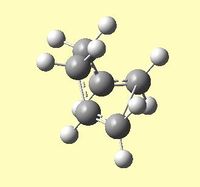
The structure from the final iteration was optimised using HF/ 3-21G resulting in an output file [31] and the following structure and energy:
| Final Optimised Product | Energy (Ha) | Point Group |
|---|---|---|
|
-231.68303 | C1 |
Although the energy does not correspond to any 1,5-hexadiene conformations previously ivestigated, the point group as well as the overall structure seems to be closely correlated to the gauche 3 conformer. During optimisation, Gaussian is not programmed to show the formation or breaking of bonds in terms of drawing in a new bond or showing one bond less. For this reason, the resulting geometry shows a C-C bond between the two allyl groups of over 4.8Å, although in reality no bond is present.
- IRC with larger maximum number of iterations
This method resulted in an output file[32] that terminated after 21 iterations and gave the same structure as using the method above.
- IRC with force constants at every step
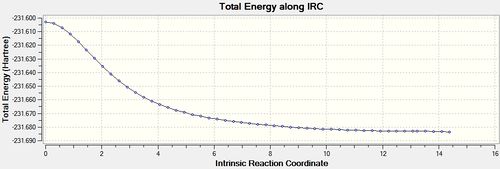
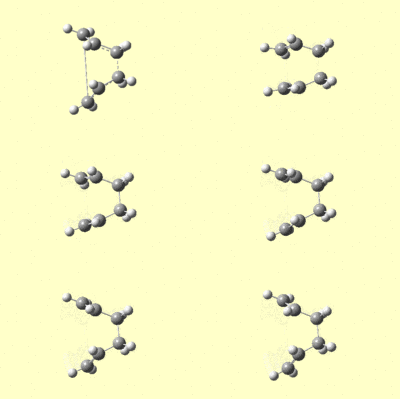
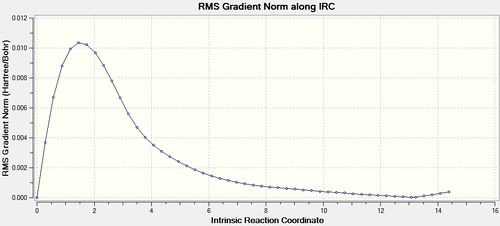
The force constants were calculated at every step, resulting in an optimisation that ran to completion after 51 iterations. The output file can be found here,[33] and the results are shown below.
| Energy and RMS Graphs | Animation | Energy (Ha) |
|---|---|---|
 |
 |
-231.68369 |
|
The final structure has a point group of C1, and a geometry similar to the gauche 3 1,5-hexadiene conformer if the bond drawing of Gaussview is ommitted.
Activation Energy
The activation energy is equal to the energy difference between a reactant and its transition state. In this case, for the HF calculations, the lowest energy reactant was the gauche 3 conformer of 1,5-hexadiene. This will be used to compare the energies of the transition states, and therefore find the activation energies for each. For the DFT calculations, it was earlier discovered that the anti 1 conformer of 1,5-hexadiene was the most thermodynamically stable, so this energy is used to calculate the activation energies for the DFT calculated transition state.
The DFT optimised boat[34] and chair[35]output files are given.
| HF/3-21G | B3LYP/6-31G(d) | Experimental Activation Energy (kcal/mol)[36] | |||||||
|---|---|---|---|---|---|---|---|---|---|
| Transition State | Gauche 3 Energy (Hartrees) | TS Energy (Hartrees) | Activation Energy (Hartrees) | Activation Energy (kcal/mol) | Anti 1 (Hartrees) | TS Energy (Hartrees) | Activation Energy (Hartrees) | Activation Energy (kcal/mol) | |
| Chair | -231.69266 | -231.61932 | 0.07334 | 46.0 | -234.61179 | -234.55698 | 0.06092 | 38.2 | 33.5±0.5 |
| Boat | -231.69266 | -231.60280 | 0.08986 | 56.4 | -234.61179 | -234.54309 | 0.0687 | 43.1 | 44.7±2.0 |
Table 4 above shows that the higher level calculation using DFT B3LYP/ 6-31G(d) gives an activation energy that is closer to the experimental activation energies. It can also be seen that the activation energy for the reaction to proceed via the boat transition state is significantly higher than if it were to proceed via the chair transition state.
Conclusion
This investigation has led to various results. Firstly, the most stable conformations of 1,5-hexadiene were found to be the anti 1, anti 2 and gauche 3 conformers at the B3LYP/6-31G(d) level. The chair transition state was found to be lower in energy by 0.01652 Ha than the boat transition state. The chair transition state seemed to lead to the gauche 2 conformation of 1,5-hexadiene, whereas the boat transition state seemed to lead to the gauche 3 conformation. Furthermore, the activation energy for the cope rearrangement to proceed via a chair transition state was found to be less than via a boat transition state.
The Diels Alder Cycloaddition
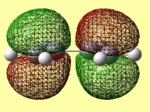
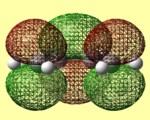
A Diels Alder reaction is a widely used [4π+2π] pericyclic cycloaddition between an electron-rich dienophile and an electron-deficient diene. In this section, the electron-rich dienophile investigated is cis-butadiene, and the electron-deficient diene is ethene. The mechanism for this reaction is given in figure 8. It is known that the π orbitals of the dienophile form new sigma bonds with the π orbitals of the diene. Generally, the HOMO of one fragment interacts with the LUMO of the other, or vice versa, to form one new bonding and one new anti-bonding molecular orbital. However, this only occurs if the HOMO is of the same symmetry as the LUMO, allowing for greater overlap of electron density. This orbital interaction will be further analysed by calculating and viewing the molecular orbitals of the transition state of this cycloaddition.

Optimisation of Ethene and Butadiene
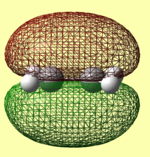
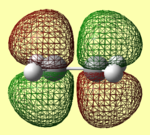
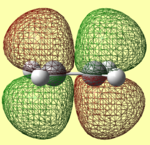
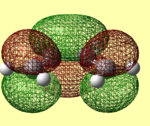
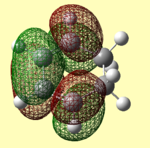
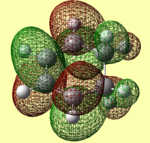
Ethene and butadiene were drawn in Gaussview and optimised using both the semi-empirical AM1 method[37] [38] and the higher level DFT B3LYP/ 6-31G (d) [39][40]. The resulting .chk files given were opened and the molecular orbitals were visualised. These are shown in tables 5 and 6 below. The symmetry of the molecular orbitals was either assigned a, asymmetric with respect to the plane, or s, symmetric with respect to the plane. This is important as it was mentioned above that only orbitals with the same symmetry are able to interact.
The energies given by the AM1 method compared to the DFT optimised methods varies greatly for both ethene and butadiene. Although these energies differ, the molecular orbitals are extremely similar. This is as expected, as the system is relatively simple. If a more complex system of molecules were used, a larger difference between the AM1 and DFT results would be expected. It can also be noted that the symmetry of the HOMO of butadiene and LUMO of ethene both have an antisymmetric symmetry with respect to the C2 plane. As butadiene is electron rich, the interaction between its HOMO and the LUMO of the electron deficient ethene is expected.
Transition State of Ethene and Butadiene Cycloaddition
The transition state of the cycloaddition of ethene and butadiene is known to have an envelope-type structure. This was used as a starting point to optimise the transition state. The envelope structure was guessed by drawing the two fragments in one molecule window and setting the terminal carbon/carbon distances to 2.2Å. These were then constrained to this distance during optimisation (+freq) to a minimum (AM1), following the freezing coordinate method employed in the Cope rearrangement section. The output file is given.[41] This optimised structure was once again optimised but to a transition state, however without the distance constraints, resulting in an output file,[42] and the following results in table 7 below. The same procedure was carried out under the B3LYP/ 6-31G(d) method. [43] [44]
Transition states were successfully optimised as a negative vibration was found using both methods. The molecular orbitals were found to have a different order for each method - the DFT optimised transition structure gives a HOMO which is equal to the AM1 optimised structure's HOMO-1, and vice versa. This difference is most likely due to the varying accuracies of the methods, with DFT being known to be more accurate and therefore reliable.
The transition state structures can also be analysed by the C-C bond lengths. Van der Waals attractive interactions are felt between two atoms when their molecular orbitals begin to overlap. The van der Waals radius of a carbon atom is approximately 1.6Å, therefore when two carbon atoms approach each other along a potential energy surface, they begin to undergo attractive interactions at approximately 3.2Å. Table 8 below shows the bond lengths between the two approaching carbon atoms forming a bond, as well as the carbon-carbon bond lengths within the fragments of the transition state.
| Method | Ethene C=C | Diene C=Cs | Diene C-C | Terminal C-C distance/bond being formed |
|---|---|---|---|---|
| AM1 | 1.38 | 1.38 | 1.40 | 2.12 |
| B3LYP/6-31G(d) | 1.39 | 1.38 | 1.41 | 2.27 |
Table 8 above shows that the distance between the two carbon atoms of the bonds being formed are less than 3.2Å, and they are therefore undergoing an attractive interaction. The DFT optimised transition state shows a larger terminal C-C bond distance than the AM1 method. This may be because the DFT method is known to largely account for steric repulsions. It can also be seen that the difference between single and double carbon carbon bonds is small, confirming the notion of a delocalised transition state where bonds are being broken and formed.
IRC of transition state
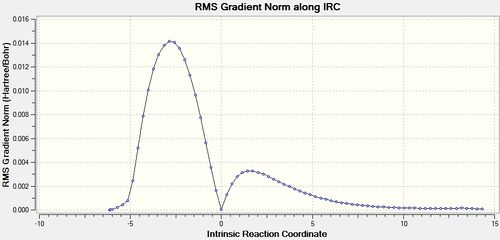
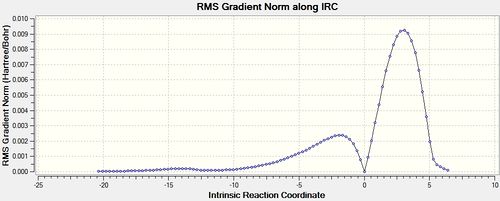
An IRC of the diels alder cycloaddition starting from the transition state optimised using DFT above was run in both directions, with force constants calculated at every step. [45] The IRC displayed some interesting information, shown below.
| Energy and RMS Graphs | Animation | Energy of Product (Ha) |
|---|---|---|
 |
 |
-234.6392 |
|
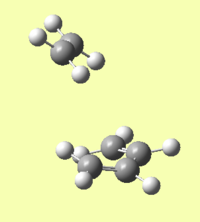
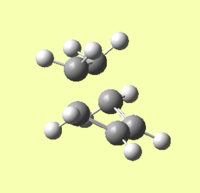
In this case, the products of the cycloaddition are formed in the reverse direction from the transition state. This can be seen in figure 9b. This can be seen because the IRC graph is at a minimum to the left of the transition state, ie when the reaction coordinate is negative relative to the transition state. The forward reaction therefore produces the reactants, which are shown in figure 9a. This suggests that in terms of the potential energy surface, the transition state is closer to the reactant structures than the product structures.
Reactant/Products:
 |
 |
Regioselectivity of the Diels Alder Cycloaddtion
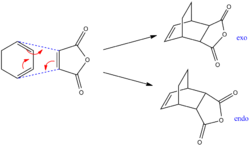
In order to investigate the regioselectivity of the diels alder cycloaddition, the reaction of cyclohexa-1,3-diene and maleic anhydride, which can give either the endo or exo product, will be examined. The mechanism of this reaction can be seen in figure 10. It is known that the endo product is dominant, and that the reaction is kinetically controlled. This suggests that the exo transition state is higher in energy than the endo transition state, as the transition state with the lowest energy (and therefore the lowest activation energy) will be formed first. This notion will be confirmed by computationally analysing the energies and molecular orbitals of the endo and exo transition states.
Reactant Optimisation
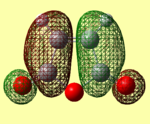
Both maleic anhydride and cyclohexa-1,3-diene were first optimised using AM1[46] [47] and then using the DFT method B3LYP/6-31G(d). [48] [49] The results are shown in tables 9 and 10 below.
| Method | HOMO | LUMO | Energy of Optimised Structure (Ha) |
|---|---|---|---|
| AM1 Optimised |  |
 |
-0.12182 |
| B3LYP/ 6-31G (d) Optimised | 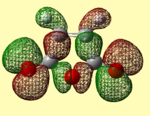 |
 |
-379.2895 |
| Method | HOMO | LUMO | Energy of Optimised Structure (Ha) |
|---|---|---|---|
| AM1 Optimised | 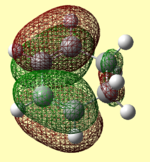 |
 |
-0.02771 |
| B3LYP/ 6-31G (d) Optimised | 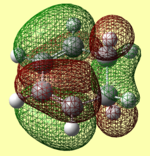 |
 |
-233.4189 |
The HOMOs and LUMOs have the correct symmetry to form attractive, favourable interactions. The anomolous molecular orbital is the HOMO of maleic anhydride when optimised using the AM1 method. Upon further investigation, this was found to be due to the switching of the HOMO-1 and HOMO orbitals, as for the butadiene and ethene cycloaddition.
Endo and Exo Transition State Optimisation
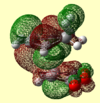
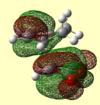
The endo and exo structures were guessed by drawing the two fragments in one molecule window and setting the carbon/carbon distances between those carbon atoms bonded in the product to 2.2Å. These were then constrained to this distance during optimisation (+freq) to a minimum (AM1), following the freezing coordinate method employed in the Cope rearrangement section. The output file is given for both exo and endo.[50] [51] This optimised structure was once again optimised but to a transition state, however without the distance constraints, resulting in an output file for both exo and endo,[52] [53] and the following results in table 11 below. The same procedure was carried out under the B3LYP/ 6-31G(d) method, [54] with results in table 12. [55] [56] [57]
| Method | LUMO+2 | LUMO+1 | LUMO | HOMO | HOMO-1 | Energy of Optimisation (Ha) | Imaginary Vibration Animation | Frequency of Vibration (cm-1) | 3D Representation | |||
|---|---|---|---|---|---|---|---|---|---|---|---|---|
| AM1 Optimised |  |
 |
 |
 |
 |
-0.045999 |  |
-811 |
| |||
| DFT Optimised |  |
 |
 |
 |
 |
-612.67931 | 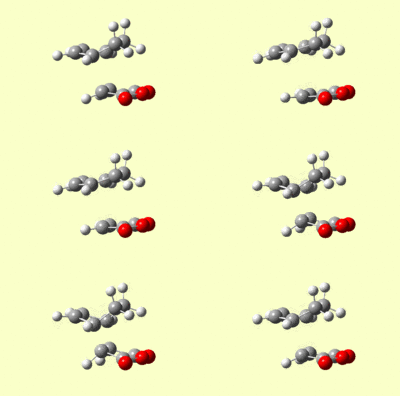 |
-449 |
|
| Method | LUMO+2 | LUMO+1 | LUMO | HOMO | HOMO-1 | Energy of Optimisation (Ha) | Imaginary Vibration Animation | Frequency of Vibration (cm-1) | 3D Representation | |||
|---|---|---|---|---|---|---|---|---|---|---|---|---|
| AM1 Optimised | 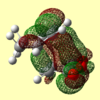 |
 |
 |
 |
 |
-0.05136 | 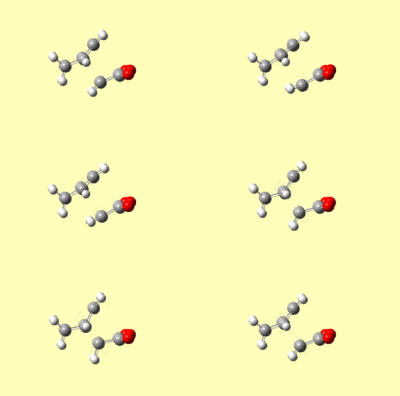 |
-787 |
| |||
| DFT Optimised |  |
 |
 |
 |
 |
-612.68340 | 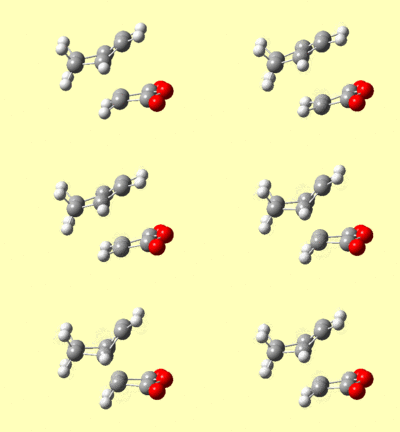 |
-447 |
|
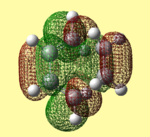
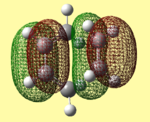
Both AM1 and B3LYP/6-31G(d) methods support the notion that the endo transition state is lower in energy and therefore more stable. The reason for the endo transition state being lower in energy can be rationalised by inspecting and comparing the molecular orbitals associated with both the endo and exo transition states. Unexpectedly, when looking at the HOMO orbitals for both transition states, there is no visible difference between them. They also show no stabilising interaction between the -(C=O)-C-(C=O)- fragment of maleic anhydride and the cyclohexadiene orbitals. However, this stabilising interaction is visibly present in the endo transition state LUMO+1 and LUMO+2 molecular orbitals. This is called the secondary orbital overlap effect, which is not present in the LUMO+1 and LUMO+2 molecular orbitals of the exo transition state, where instead, a nodal plane is observed. Although this secondary orbital overlap may explain why the endo transition state is more stable, the LUMO+1 and LUMO+2 orbitals are obviously unoccupied. This raises the question as to how much stability is due to this effect. Another aspect that could influence the relative stability of the endo and exo transition states is steric hindrance.
Steric hindrance is greater in the exo transition state, as the maleic anhydride is much closer to the bridging carbon atoms in the cyclohexadiene fragment. This results in higher torsional strain, making the exo transition state more unfavourable. This can be seen in table 13, where bond lengths and angles are shown.
| Method | Transition State | Cyclohexene (C=C) | Cyclohexene (C-C) | Maleic anhydride (C=C) | Forming C-C | Repulsive C-C | Forming C-C bond angle |
|---|---|---|---|---|---|---|---|
| AM1 | exo | 1.39 | 1.52 | 1.41 | 2.21 | 2.95 | 99.8 degrees |
| endo | 1.39 | 1.52 | 1.41 | 2.16 | 2.89 | 94.8 degrees | |
| DFT | exo | 1.39 | 1.56 | 1.40 | 2.29 | 3.03 | 99.2 degrees |
| endo | 1.39 | 1.56 | 1.39 | 2.27 | 2.99 | 94.2 degrees |
Table 13 above shows that the forming C-C bond is shorter for the endo transition state than for the exo transition state. This is due to the secondary overlap interaction mentioned above, making the endo transition state more favourable. As discussed before, this forming C-C bond is attractive, as it is less than the sum of the two carbon's van der Waals radii, which would be 3.4Å. The forming C-C bond angle largely varies for the endo and exo transition state. The exo transition state has an angle 5° larger than the endo transition state, confirming the presence of steric hindrance. By increasing the angle between the forming bonds, the exo transition state aims to minimise the steric hindrance which is causing it to be less stable than the endo transition state.
IRC Analysis
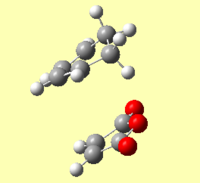
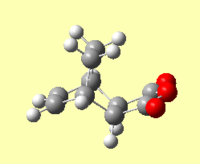
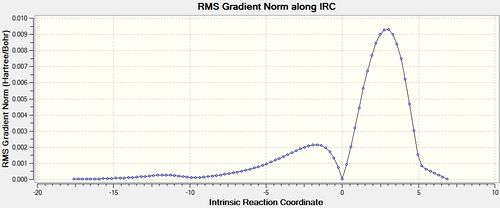
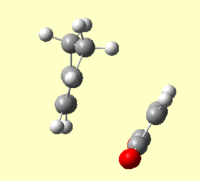
An IRC of the diels alder cycloaddition starting from both the exo and endo transition states optimised using DFT above was run in both directions, with force constants calculated at every step.[58] [59]
| Energy and RMS Graphs | Animation | Energy of Product (Ha) |
|---|---|---|
 |
 |
-612.7556 |
|
 |
 |
| Energy and RMS Graphs | Animation | Energy of Product (Ha) |
|---|---|---|
 |
 |
-612.75829 |
|
 |
 |
The IRC analysis enables the comparison of product energies. The product formed via the exo transition state is 1.69 kcalmol-1 less stable than the product formed via the endo transition state, suggesting the endo transition state leads to the most thermodynamically stable product.
Activation Energies
The activation energies of the cycloaddition of maleic anhydride and cyclohexadiene are shown in table 14. The reactant energies were calculated by adding the two energies of the reactants. The transition state energies were taken from tables 11 and 12.
| HF/3-21G | B3LYP/6-31G(d) | |||||||
|---|---|---|---|---|---|---|---|---|
| Transition State | Reactant Energy (Hartrees) | TS Energy (Hartrees) | Activation Energy (Hartrees) | Activation Energy (kcal/mol) | Reactant Energy (Hartrees) | TS Energy (Hartrees) | Activation Energy (Hartrees) | Activation Energy (kcal/mol) |
| Exo | -0.08629 | -0.045999 | 0.040291 | 25.3 | -612.70848 | -612.67931 | 0.02917 | 18.3 |
| Endo | -0.08629 | -0.05136 | 0.03493 | 21.9 | -612.70848 | -612.68340 | 0.02508 | 15.7 |
It can be seen that the Hartree-Fock method predicts the endo transition state to have a lower activation energy by 3.4kcalmol-1, and the DFT method predicts the endo transition state to have a lower activation energy by 2.6kcalmol-1. This confirms the notion that the endo transition state is kinetically favoured, as the activation energy is lowest, and it would therefore be formed faster than the exo transition state. This does not, however, determine which transition state forms the most thermodynamically stable product.
Diels Alder Conclusion
The cycloaddition of ethene and butadiene was investigated by optimising the transition state of the reaction using AM1 and DFT methods. The molecular orbitals of the transition state were also generated, and the transition state was confirmed to have been found due to a negative vibration.
The computational methods used showed that the endo transition state is lower in energy and therefore kinetically favoured over the exo transition state in the cycloaddition of maleic anhydride and cyclohexadiene. Furthermore, the product energies showed that the endo transition state pathway formed the most thermodynamically stable product.
Overall, the computational methods used were successful in modelling the pericyclic reactions studied in this module. The semi-empirical AM1 method proved to be useful in determining transition states and molecular orbitals, however the higer level DFT-B3LYP/ 3-21G(d) method was found to predict these with more accuracy as the energies found were in closer agreement to literature.
It would be interesting to investigate the effect of different functional groups of the cyclohexadiene, for example to make it a more electron rich diene, and how this would effect the molecular orbitals and secondary orbital overlap. This could lead on to a study of which functional groups on the reactants cause a larger energy difference in the exo and endo transition states, and therefore which functional groups could cause either exo or endo selectivity exclusively.
References
- ↑ DOI:10042/to-13251
- ↑ DOI:10042/to-13252
- ↑ DOI:10042/to-13253
- ↑ DOI:10042/to-13254
- ↑ DOI:10042/to-13235
- ↑ DOI:10042/to-13240
- ↑ DOI:10042/to-13241
- ↑ DOI:10042/to-13242
- ↑ DOI:10042/to-13243
- ↑ DOI:10042/to-13250
- ↑ DOI:10042/to-13255
- ↑ DOI:10042/to-13256
- ↑ DOI:10042/to-13257
- ↑ DOI:10042/to-13258
- ↑ DOI:10042/to-13259
- ↑ DOI:10042/to-13260
- ↑ Socrates, George. Infrared and Raman characteristic group frequencies: tables and charts. John Wiley & Sons: New Jersey ,2001.
- ↑ DOI:10042/to-13268
- ↑ DOI:10042/to-13309
- ↑ DOI:10042/to-13316
- ↑ DOI:10042/to-13325
- ↑ DOI:10042/to-13271
- ↑ DOI:10042/to-13272
- ↑ DOI:10042/to-13273
- ↑ DOI:10042/to-13344
- ↑ DOI:10042/to-13361
- ↑ DOI:10042/to-13362
- ↑ DOI:10042/to-13363
- ↑ DOI:10042/to-13364
- ↑ DOI:10042/to-13365
- ↑ DOI:10042/to-13366
- ↑ DOI:10042/to-13375
- ↑ DOI:10042/to-13374
- ↑ DOI:10042/to-13376
- ↑ DOI:10042/to-13377
- ↑ Module 3 wiki:https://wiki.ch.ic.ac.uk/wiki/index.php?title=Mod:phys3
- ↑ DOI:10042/to-13402
- ↑ DOI:10042/to-13410
- ↑ DOI:10042/to-13400
- ↑ DOI:10042/to-13419
- ↑ DOI:10042/to-13429
- ↑ DOI:10042/to-13424
- ↑ DOI:10042/to-13420
- ↑ DOI:10042/to-13428
- ↑ DOI:10042/to-13464
- ↑ DOI:10042/to-13456
- ↑ DOI:10042/to-13460
- ↑ DOI:10042/to-13455
- ↑ DOI:10042/to-13459
- ↑ DOI:10042/to-13509
- ↑ DOI:10042/to-13472
- ↑ DOI:10042/to-13508
- ↑ DOI:10042/to-13519
- ↑ DOI:10042/to-13468
- ↑ DOI:10042/to-13467
- ↑ DOI:10042/to-13518
- ↑ DOI:10042/to-13513
- ↑ DOI:10042/to-13547
- ↑ DOI:10042/to-13629

