Rep:Mod:SSYL Computational Labs - Module 2
Selina Leung
PART 1 - Introduction: Computational Labs Module 2
This project involves the use of computational chemistry in order to predict properties including structure, bonding, energies and charge distributions for molecules. Molecular orbitals can also be computed using this method, as shown in this project, in order to visualise the orbitals of the molecule. This is highly useful to generate important information and determine properties of these compounds and for the study of main group compounds and catalysis.
Optimisations of BH3, TlBr3 and BBr3
In this part, three different molecules (BH3, TlBr3, BBr3) were computed in GaussView. Each molecule was first optimised to calculate its geometry and bond lengths.
Optimisations of BH3
B3LYP and 3-21G Basis Set
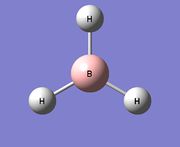
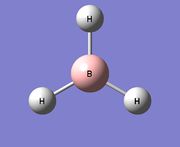
A BH3 molecule was created in Gaussview and before running the optimisation calculation, each of the B-H bonds were set to a length of 1.50 Å. The Job-Type was set as Optimisation and method as B3LYP using a 3-21G basis set. The following results were obtained:
In order to confirm whether the molecule has been fully converged, the table below can also be obtained from the LOG file. As "YES" is stated in the column titled "Converged?", it is shown that the opimisation was successful.
        Item               Value     Threshold  Converged?
Maximum Force            0.000413     0.000450     YES
RMS     Force            0.000271     0.000300     YES
Maximum Displacement     0.001610     0.001800     YES
RMS     Displacement     0.001054     0.001200     YES
Predicted change in Energy=-1.071764D-06
Optimization completed.
   -- Stationary point found.
Optimisation: Download Log File
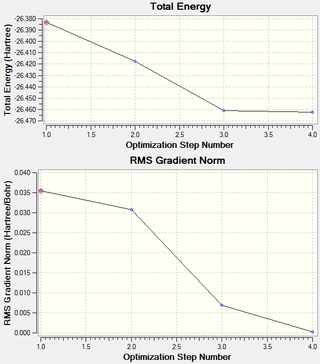
It is possible to obtain information about each step of the optimisation of the molecule. The two graphs in the image below show the total energy and the RMS Gradient Norm at each optimisation step. The "RMS Gradient Norm" shows whether the geometry has been converged successfully after optimisation. As the gradient is very small, i.e. very close to zero, it shows that the molecule has been converged with reasonable accuracy. The gradient represents the energy change at each stage of the optimisation and approaches zero after each optimisation step number. It can also be seen that the total energy of the molecule also decreases as the molecule is stabilised.
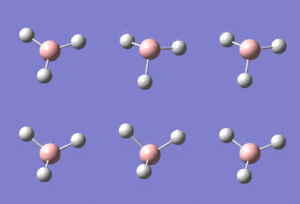
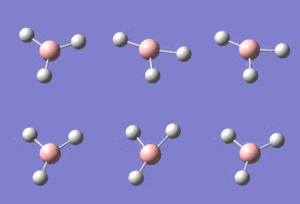
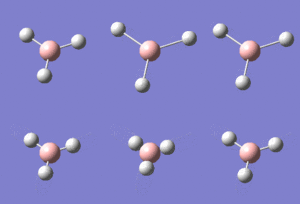
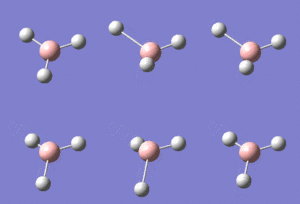
The image below shows the BH3 molecule at the four steps of optimisation. The first two steps represents the molecule without any bonds and the hydrogen atoms "approach" the boron center at each step. This is explained later.

6-31G (d,p) Basis Set
The 3-21G optimised BH3 molecule was then optimised using a higher-level basis set: 6-31G(d,p). This was set up using the same method and Job-Type as the previous but changing the basis set in the calculation. The results are tabulated below.
Again, the results were checked to see whether the job had sucessfully been carried out.
        Item               Value     Threshold  Converged?
Maximum Force            0.000005     0.000450     YES
RMS     Force            0.000003     0.000300     YES
Maximum Displacement     0.000019     0.001800     YES
RMS     Displacement     0.000012     0.001200     YES
Predicted change in Energy=-1.304899D-10
Optimization completed.
   -- Stationary point found.
Optimisation: Download Log File
Comparison of Results from the Different Basis Sets
There is a difference in the energies from the optimisation of the BH3 molecules optimised using the 3-21G and 6-31G(d,p) basis sets. The data is tabulated below with the energy in Hartree atomic units (au) converted into kJmol-1 where 1 au is equal to 2625.50 kJmol-1. [1]
| Basis Set | Energy (au) | Energy (kJmol-1) | Difference (kJmol-1) |
| 3-21G | -26.46226338 | -69476.6725... | 401.86 |
| 6-31G | -26.61532363 | -69878.5321... |
The energy difference is approximately 402 kJmol-1 which signifies a large difference between the two optimised molecules when using the two different basis sets. The total energy is highly dependent on which basis set is used. Due to the magnitude of the difference between the 3-21G and 6-31G(d,p) basis sets, it is not possible to compare molecules computed using different basis sets.
The 6-31G basis set is a higher level basis set, which gives more accurate results compared to the 3-21G basis set.
Optimisation of TlBr3: LANL2DZ Basis Set
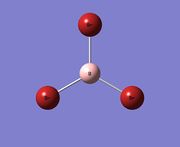
A molecule of TlBr3 was created in Gaussview. The symmetry of the molecule was restricted by changing the "Point Group" settings and enabling point group symmetry. The point group was contrained to D3h and the tolerance increased to "Very Tight (0.0001)". The calculation was set up to use the LANL2SZ basis set. The results are shown below.
The bond length was found to be 2.564 Å[2] from literature. This is in reasonably good agreement with the value calculated using Gaussian at 2.65095 Å. However, deviations from the values found in references are to be expected due to the approximations used from the basis sets.
        Item               Value     Threshold  Converged?
Maximum Force            0.000002     0.000450     YES
RMS     Force            0.000001     0.000300     YES
Maximum Displacement     0.000022     0.001800     YES
RMS     Displacement     0.000014     0.001200     YES
Predicted change in Energy=-6.084033D-11
Optimization completed.
   -- Stationary point found.
Optimisation: DOI:10042/21710
Optimisation of BBr3: GEN Basis Set
BBr3 was created using the previously 6-31G(d,p) optimised BH3 molecule. BBr3 was then optimised using the GEN basis set which enables the basis set to be specified for each individual atom. The keywords "pseudo=read gfinput" was entered which also allows pseudo-potentials to be specified for each atom. The file was saved as an input file, but before the calculationwas submitted, the input file was edited adding the following lines:
This instructs Gaussian to optimise the boron atom using the full 6-31G(d,p) basis set but pseudo-potentials (LanL2DZ) on the bromine atoms. The calculation was then submitted through Gaussian giving the following results:
        Item               Value     Threshold  Converged?
Maximum Force            0.000008     0.000450     YES
RMS     Force            0.000005     0.000300     YES
Maximum Displacement     0.000036     0.001800     YES
RMS     Displacement     0.000023     0.001200     YES
Predicted change in Energy=-4.027600D-10
Optimization completed.
   -- Stationary point found.
Optimisation: DOI:10042/21711
Comparison and Analysis of Results
A bond is typically defined as an attraction between atoms that hold molecules together, formed from the transfer or sharing of electrons between the atoms. A bond is dependent on the electrostatic interaction between the nuclei and the electrons and therefore is the area of high electron density - where there is a high probability of finding the electrons, usually around . Where there is no bond, the probability of finding an electron is zero and there is insufficient overlapping of the orbitals. Gaussview may not show the presence of a bond in certain molecules as it determines whether a bond is present due to a distance criteria. During certain steps of the optimisation, the atoms may be distanced further apart from each other as the stable state of the molecule is being computed. However, this does not mean in reality that there is an absence of a chemical bond as there is no defined maximum bond length - there may still be sufficient orbital overlap between the atoms.
Bond lengths in molecules depend on the size of the atoms, orbital overlaps as well as electronegativity of the atoms. Bonds are stronger (and therefore their lengths are shorter) when the atoms are small, with little difference in electronegativity and have efficient orbital overlap. TlBr3 has the longest bond length out of the three molecules which indicates that the Tl-Br bonds are the weakest, and as BH3 has the shortest bond length, the B-H bonds must be the strongest. This means that the BH3 molecule has the most efficient orbital overlap as the atoms are closer in size (compared to the other two molecules) and thus, has greater electron density involved in the overlap. The orbitals involved in B-H bonding are the 2s 2p of boron and 1s of hydrogen. This is in comparison to the 4p orbital of the larger bromine atom, which would result in less efficient overlap with the boron atom due to more diffuse bromine orbitals. Hence, this results in a weaker B-Br bond.
| Molecule | Bond Length (Å) |
| BH3 | 1.19232 |
| TlBr3 | 2.65095 |
| BBr3 | 1.93396 |
By changing the ligands for the central boron atom, the length of the B-X bond would vary depending on orbital sizes and the electronegativity of the ligand. It has already been established that the B-H bond is stronger than the B-Br bond due to the bromine atom's larger and more diffuse orbitals. In addition to this, the difference in electronegativity between Br (2.96) and B (2.04) is greater than that of H (2.20) and B. Boron and Thallium are both group 13 elements and so will have the same number of valence electrons. However, Tl is found much further down the group. Therefore Tl possesses even larger and more diffuse orbitals, weakening the bond strength due to poor overlap with the ligands.
Frequency Analysis
The purpose of frequency analysis is to ensure that the optimised molecules are at minimum structures. The second derivative of the potential energy surface is computed and allows the IR and Raman vibrational modes to be generated. Therefore, if all the frequencies found are positive, it means that the molecule is at a minimum point. Frequency analysis was carried out on BH3 and TlBr3 and their IR spectra predicted. The analysis is checked by obtaining the output file and the "Low Frequencies" table. The first row of low frequencies should be as close to zero as possible, some may appear as negative values. The second row of frequencies are the derivatives - all the values should be checked to ensure that they are positive, to indicate a minimum point.
The same method and basis set must be used for both the optimisation and the frequency analysis. This is because the energies of the molecules are highly dependent on what basis set was used in the calculation - using a different basis set would result in a different energy - which can be very large. Thus, it is impossible to compare molecules that have been analysed using different basis sets due to the magnitude of the energy difference as it would give rise to huge inaccuracies.
Analysis of BH3
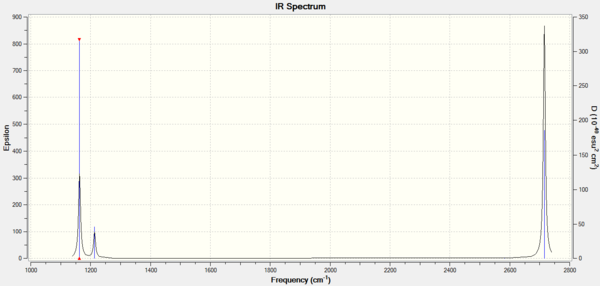
Frequency analysis was carried out on the previously 6-31G(d,p) optimised BH3 molecule by changing the Job-Type to "Frequency". The "low frequencies" lines from the output file have been included below and checked to ensure that the top six frequencies are within the range of -15 cm-1 to +15 cm-1 and that none of the other frequencies (in italics) are negative. As they are all positive, it means the molecule is at its minimum structure.
Low frequencies ---   -0.9033   -0.7343   -0.0054    6.7375   12.2491   12.2824
Low frequencies --- 1163.0003 1213.1853 1213.1880
The results from the vibrational analysis are tabulated below:
The predicted IR spectrum only shows three visible peaks. This is because there are two degenerate peaks at 1213.19 cm-1 and 2715.43 cm-1. Additionally, the vibration at 2582.26 cm-1 has an intensity of 0 as it is a symmetrical B-H stretch, thus the dipole of the molecule is retained. Peaks are only observed if there is a change in the dipole moment of the molecule to allow interaction with the electromagnetic field.
Frequency Analysis: Download Log File
Analysis of TlBr3
Frequency analysis was carried out on the optimised TlBr3 molecule. Again, the low frequencies were checked in the output file to ensure they were within range and that there were no negative frequencies.
Low frequencies ---   -3.4213   -0.0026   -0.0004    0.0015    3.9367    3.9367
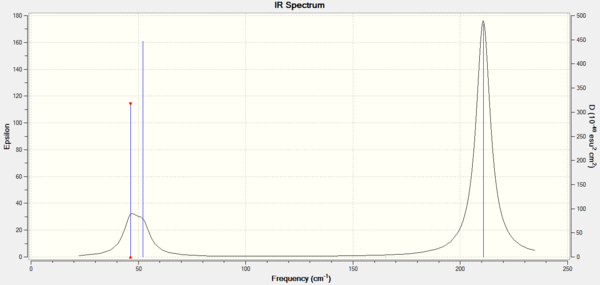
Low frequencies ---   46.4289   46.4292   52.1449
The table of results is shown below.
Again, the IR spectrum shows three peaks due to the same reasons as for BH3: there are two degenerate vibrational modes at 46.43 cm-1 and 210.69 -1 and one vibrational mode at 165.27 cm-1 that involves no change in dipole moment.
Frequency Analysis: DOI:10042/21709
Comparison and Analysis of Results
The results from the vibrational analysis of BH3 and TlBr3 are compared alongside each other:
| BH3 Frequency | Intensity | TlBr3 Frequency | Intensity | ||
|---|---|---|---|---|---|
| 1163.00 | 92.5478 | a"2 | 46.43 | 3.6867 | e' |
| 1213.19 | 14.0553 | e' | 46.43 | 3.6867 | e' |
| 1213.19 | 14.0589 | e' | 52.14 | 5.8466 | a"2 |
| 2582.26 | 0.0000 | a'1 | 165.27 | 0.0000 | a'1 |
| 2715.43 | 126.3307 | e' | 210.69 | 25.4830 | e' |
| 2715.43 | 126.3211 | e' | 210.69 | 25.4797 | e' |
TlBr3 is a larger molecule in comparison to BH3 and therefore heavier. Because of this, the frequencies for its vibrations are not as high than those for BH3. The frequency is dependent on the bond strength - the stronger the bond, the higher the frequency is. This explains why the BH3 vibrations are at a higher frequency due to the molecule having stronger bonds as explained previously. The vibrational frequency inversely proportional to the reduced mass of the molecule - the greater the reduced mass, the lower the frequency. As established earlier, the Tl-Br bonds are longer than the B-H bonds due to the Tl atoms being larger and more diffuse; the Tl-Br bonds are weaker and so weak bonds absorb at lower vibrational frequencies.
Although they modes have been reordered, both molecules have the same type of vibrational modes - 4 e' modes, 1 a"2 mode and completely symmetrical a'1 mode. The vibrational modes at lower frequencies are bending motions, whereas those at higher frequencies are stretching motions. The BH3 molecule has the a"2 mode as its lowest energy vibration. However, for TlBr3, its a"2 mode is greater in energy than the degenerate e' modes.
Natural Bond Orbital Analysis of BH3
The checkpoint (.chk) file for the previously 6-31G(d,p) optimised BH3 molecule was used for population analysis for the MOs. The job-type was set to "Energy" and the keywords "pop=full" was used to allow full population analysis. Under the NBO tab, "Full NBO" was selected in the first drop-down menu.
The molecular orbitals are shown below:
1.  |
2.  |
3.  |
4.  |

|
5.  |
6.  |
7.  |
8. 
|
Population Analysis: DOI:10042/21583
MO Diagram of BH3
The diagram on the below shows the computed molecular orbitals and those predicted using LCAO theory. MO number 1 is not included in the diagram as it is a core orbital and therefore not concerned in the MO diagram here. This is shown in its energy (-6.77140 au) as it differs in magnitude to the other seven orbitals. The MOs numbered 2 to 8 are included. MOs 2 to 4 are the filled orbitals where 3 and 4 are degenerate (both calculated at -0.35079 au) which are also the highest occupied molecular orbitals. MO 5 is the LUMO.
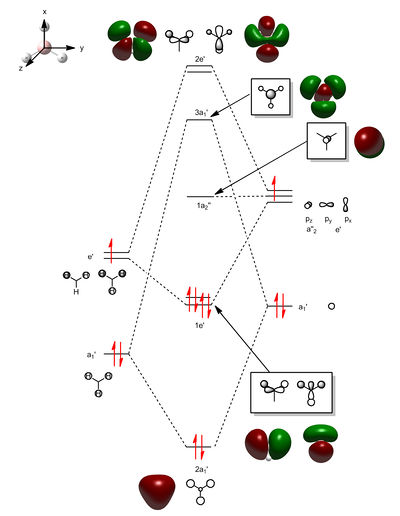
It can be seen that the orbitals computed show quite a fair about of similarity with the orbitals predicted with MO theory. They still possess the same symmetry labels and phases. The 2a1' atomic orbital is completely symmetric and fully bonding. However, due to orbital mixing and bonding/antibonding interactions, some also differ slightly in appearance. For example, with the two 1e' orbitals, the p orbital from the boron appear to mix with the s orbital of the hydrogen atoms due to bonding interactions. For the 2e' orbitals, the antibonding interactions also appear to also have resulted in slightly distorted looking orbitals. MO 8 is of quite an interesting shape as it also appears to have through space interactions between two of the hydrogen atoms.
Judging from the orbitals produced, LCAO theory is a good method to produce the molecular orbitals. However, in reality there will be deviations from LCAO theory due to other effects taking place and mentioned earlier - such as mixing, through space and antibonding interactions which would affect the size and shape of the MOs.
Natural Bond Orbital Analysis of NH3
Optimisation and Frequency Analysis
A molecule of NH3 was created in Gaussview and optimised using the 6-31G(d,p) basis set under no symmetry conditions ("nosymm" entered in the keywords). Frequency and population analysis were then carried out. The results for the optimisation and frequency analysis are shown below.
| N-H Bond Length | 1.01797 Å | |
| H-N-H Bond Angle | 105.749° | |
| File Type | .log | |
| Calculation Type | FOPT | |
| Calculation Method | RB3LYP | |
| Basis Set | 6-311G | |
| Charge | 0 | |
| Spin | Singlet | |
| Energy (au) | -56.55776856 | |
| RMS Gradient Norm (au) | 0.00000885 | |
| Dipole Moment (D) | 1.8464 | |
| Point Group | C1 | |
| Calculation Length | 20.0 seconds |
        Item               Value     Threshold  Converged?
Maximum Force            0.000024     0.000450     YES
RMS     Force            0.000012     0.000300     YES
Maximum Displacement     0.000079     0.001800     YES
RMS     Displacement     0.000053     0.001200     YES
Predicted change in Energy=-1.629725D-09
Optimization completed.
   -- Stationary point found.
Frequency Analysis
Low frequencies ---  -30.7014   -0.0012   -0.0003    0.0007   20.2662   28.2997
Low frequencies --- 1089.5562 1694.1246 1694.1863
Optimisation: DOI:10042/21645
Frequency Analysis: DOI:10042/21644
Population Analysis
Further information about the charge distribution of the molecule can also be obtained from the results. The NBO charges for the N atom is -1.125 and for the H atoms, 0.375. The charge limits were set between -1.000 to 1.000 where the red and green colours show the distribution of charge. Red represents area of negative charge and green represents positive charge. As nitrogen is more electronegative than hydrogen, it is expected that the N atom would possess a greater charge density. The electronegative N atom draws the electron density from the three H atoms.

The table below was obtained from the output file. It shows that 68.83% of the bond is contributed from the N orbitals with the remaining 31.17% from the H orbitals. It also shows the hybridisation of the Norbitals: 24.87% s character, 75.05% p character (with a trace percentage of d character). The H orbitals have 100(99.91)% s character. This means the NH3 molecule has 3 sp3 hybridised orbitals that interact with the s orbitals of the three hydrogen atoms. Orbital number 5 is the lone pair on the nitrogen, therefore is also occupied. Finally, orbital 4 is the core 1s orbital on nitrogen.
      (Occupancy)   Bond orbital/ Coefficients/ Hybrids
---------------------------------------------------------------------------------
    1. (1.99909) BD ( 1) N   1 - H   2
               ( 68.83%)   0.8297* N   1 s( 24.87%)p 3.02( 75.05%)d 0.00(  0.09%)
                                          -0.0001 -0.4986 -0.0059  0.0000 -0.2910
                                           0.0052  0.8155  0.0277  0.0000  0.0000
                                           0.0281  0.0000  0.0000  0.0032  0.0082
               ( 31.17%)   0.5583* H   2 s( 99.91%)p 0.00(  0.09%)
                                          -0.9996  0.0000  0.0072 -0.0289  0.0000
    2. (1.99909) BD ( 1) N   1 - H   3
               ( 68.83%)   0.8297* N   1 s( 24.86%)p 3.02( 75.05%)d 0.00(  0.09%)
                                           0.0001  0.4986  0.0059  0.0000  0.2910
                                          -0.0052  0.4077  0.0138  0.7062  0.0240
                                           0.0140  0.0243  0.0076  0.0033  0.0031
               ( 31.17%)   0.5583* H   3 s( 99.91%)p 0.00(  0.09%)
                                           0.9996  0.0000 -0.0072 -0.0145 -0.0250
    3. (1.99909) BD ( 1) N   1 - H   4
               ( 68.83%)   0.8297* N   1 s( 24.87%)p 3.02( 75.05%)d 0.00(  0.09%)
                                           0.0001  0.4986  0.0059  0.0000  0.2909
                                          -0.0052  0.4077  0.0138 -0.7062 -0.0239
                                           0.0140 -0.0243 -0.0076  0.0033  0.0031
               ( 31.17%)   0.5583* H   4 s( 99.91%)p 0.00(  0.09%)
                                           0.9996  0.0000 -0.0072 -0.0145  0.0250
    4. (1.99982) CR ( 1) N   1           s(100.00%)
                                           1.0000 -0.0002  0.0000  0.0000  0.0000
                                           0.0000  0.0000  0.0000  0.0000  0.0000
                                           0.0000  0.0000  0.0000  0.0000  0.0000
    5. (1.99721) LP ( 1) N   1           s( 25.38%)p 2.94( 74.52%)d 0.00(  0.10%)
                                           0.0001  0.5036 -0.0120  0.0000 -0.8618
                                           0.0505  0.0000  0.0000  0.0000  0.0000
                                           0.0000  0.0000  0.0000 -0.0269  0.0155
The table "Natural Bond Orbitals" below shows the calculated occupancies and energies for each of the orbitals - they should be approximately 2. It can be seen that the core orbital is far down in energy compared to the N-H bonding orbitals (~ -14). The lone pair is further up in energy that the non-core orbitals. Orbitals that are higher in energy are more reactive, thus, the lone pair is more reactive that the other N orbitals.
 Natural Bond Orbitals (Summary):
                                                            Principal Delocalizations
           NBO                        Occupancy    Energy   (geminal,vicinal,remote)
 ====================================================================================
 Molecular unit  1  (H3N)
     1. BD (   1) N   1 - H   2          1.99909    -0.60417
     2. BD (   1) N   1 - H   3          1.99909    -0.60417
     3. BD (   1) N   1 - H   4          1.99909    -0.60416
     4. CR (   1) N   1                  1.99982   -14.16768
     5. LP (   1) N   1                  1.99721    -0.31756  24(v),16(v),20(v),17(v)
                                                    21(v),25(v)
Population Analysis: DOI:10042/21646
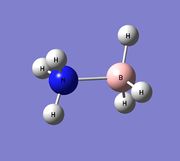
Association Energies: NH3BH3
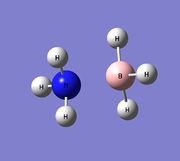
The association energy of NH3BH3 can be calculated using the energies from the optimised NH3 and BH3 fragments and also by optimising the full NH3BH3 in Gaussian.
Optimisation and Frequency Analysis
In Gaussview, a molecule of NH3BH3 was created and optimised using the B3LYP/3-21G method and basis set. This was followed by re-optimising the molecule using a higher level basis set, 6-31G(d,p). Following this, frequency analysis was carried out to ensure a minimum. The results are shown below.
Optimisation with the 3-21G Basis Set
        Item               Value     Threshold  Converged?
Maximum Force            0.000086     0.000450     YES
RMS     Force            0.000032     0.000300     YES
Maximum Displacement     0.000356     0.001800     YES
RMS     Displacement     0.000192     0.001200     YES
Predicted change in Energy=-5.461724D-08
Optimization completed.
Optimisation with the 6-31G(d,p) Basis Set
        Item               Value     Threshold  Converged?
Maximum Force            0.000137     0.000450     YES
RMS     Force            0.000038     0.000300     YES
Maximum Displacement     0.001013     0.001800     YES
RMS     Displacement     0.000223     0.001200     YES
Predicted change in Energy=-1.124426D-07
Optimization completed.
   -- Stationary point found.
Low frequencies ---   -8.9203   -0.0013   -0.0013    0.0004   19.3568   19.5820
Low frequencies ---  263.3187  631.2464  638.5702
Optimisation (3-21G)): DOI:10042/21741
Optimisation (6-31G(d,p)): DOI:10042/21740
Frequency Analysis: DOI:10042/21742
Calculation of Association Energy
The energies for BH3, NH3 and NH3BH3 are tabulated below with the energy difference calculated:
ΔE = E(NH3BH3) - [E(NH3 + E(BH3)]
| E(BH3) | -26.61532363 au |
| E(NH3) | -56.55776856 au |
| E(NH3BH3) | -83.22469028 au |
| ΔE | -0.05159809 au |
ΔE, the dissociation energy, can be converted to kJmol-1 to give -135.47 kJmol-1.
The energy has an error of approximately 10 kJmol-1 (equivalent to 0.03809 au).
PART 2 - Introduction: Ionic Liquids - Designer Solvents
Ionic liquids are salts in the liquid phase at room temperature. They are highly useful solvents as they are non-volatile, therefore are considered "green" solvents. This project involves the use of computational chemistry to look at properties and obtain information about a selection of ionic liquid cations.
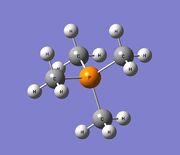
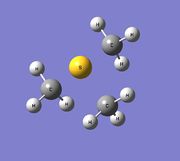
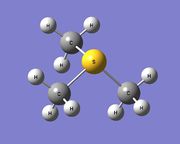
Three onium cations were produced in GaussView: [N(CH3)4]+, [P(CH3)4]+ and [S(CH3)3]+. Due to the large number of atoms present in each of the cations, the molecules were first optimised using the B3LYP/3-21G basis set, followed by the 6-31G(d,p) basis set with no symmetry taken into account. The output files were checked to ensure the job had converged. Following this, frequency analysis were carried out on each cation to ensure a minimum. Again, the low frequencies checked in the output file to ensure that the frequencies were low and that there were no negative frequencies. MO and NBO calculations were then carried out on each cation individually.
In the second part of this project, the addition of functional groups (hydroxyl and cyano groups) to the tetramethylammonium cation was investigated. MO and NBO analysis was carried out on the two additional cations in order to compare their charges and molecular orbitals.
[N(CH3)4]+
Optimisation and Frequency Analysis
First Optimisation using the 3-21G Basis Set
        Item               Value     Threshold  Converged?
Maximum Force            0.000031     0.000450     YES
RMS     Force            0.000005     0.000300     YES
Maximum Displacement     0.000669     0.001800     YES
RMS     Displacement     0.000196     0.001200     YES
Predicted change in Energy=-7.173403D-09
Optimization completed.
   -- Stationary point found.
Second Optimisation using the 6-31G(d,p) Basis Set
        Item               Value     Threshold  Converged?
Maximum Force            0.000129     0.000450     YES
RMS     Force            0.000049     0.000300     YES
Maximum Displacement     0.000792     0.001800     YES
RMS     Displacement     0.000295     0.001200     YES
Predicted change in Energy=-2.839255D-07
Optimization completed.
   -- Stationary point found.
Frequency Analysis
Low frequencies ---  -19.1970  -12.7515   -8.1932   -0.0010    0.0001    0.0008
Low frequencies ---  174.6435  275.6847  282.6006
Optimisation (3-21G): DOI:10042/21759
Optimisation (6-31G(d,p)): DOI:10042/21766
Frequency Analysis: DOI:10042/21770
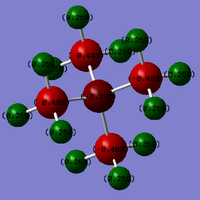
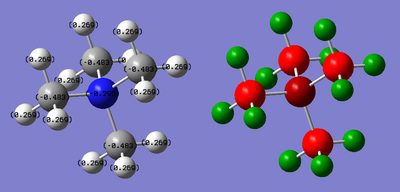
NBO Charge Analysis
The charge limits were set between -0.483 and +0.483.
| N: -0.295 | C: -0.483 | H: 0.269 |
NBO Analysis: DOI:10042/21776
[P(CH3)4]+
Optimisation and Frequency Analysis
First Optimisation using the 3-21G Basis Set
        Item               Value     Threshold  Converged?
Maximum Force            0.000114     0.000450     YES
RMS     Force            0.000027     0.000300     YES
Maximum Displacement     0.000682     0.001800     YES
RMS     Displacement     0.000236     0.001200     YES
Predicted change in Energy=-1.273996D-07
Optimization completed.
   -- Stationary point found.
Second Optimisation using the 6-31G(d,p) Basis Set
        Item               Value     Threshold  Converged?
Maximum Force            0.000051     0.000450     YES
RMS     Force            0.000016     0.000300     YES
Maximum Displacement     0.000924     0.001800     YES
RMS     Displacement     0.000291     0.001200     YES
Predicted change in Energy=-5.200176D-08
Optimization completed.
   -- Stationary point found.
Frequency Analysis
Low frequencies ---  -19.6620   -9.1019   -0.0031   -0.0028    0.0007   11.9472
Low frequencies ---  152.0340  181.9502  190.0258
Optimisation (3-21G): DOI:10042/21761
Optimisation (6-31G(d,p)): DOI:10042/21765
Frequency Analysis: DOI:10042/21771
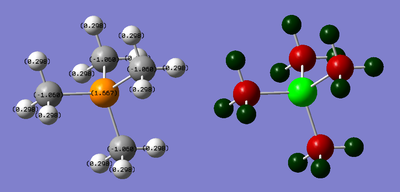
NBO Charge Analysis
The charge limits were set between -1.667 and +1.667.
| P: 1.667 | C: -1.060 | H: 0.298 |
NBO Analysis: DOI:10042/21777
[S(CH3)3]+
Optimisation and Frequency Analysis
First Optimisation using the 3-21G Basis Set
        Item               Value     Threshold  Converged?
Maximum Force            0.000060     0.000450     YES
RMS     Force            0.000010     0.000300     YES
Maximum Displacement     0.001021     0.001800     YES
RMS     Displacement     0.000368     0.001200     YES
Predicted change in Energy=-1.384169D-08
Optimization completed.
   -- Stationary point found.
Second Optimisation using the 6-31G(d,p) Basis Set
        Item               Value     Threshold  Converged?
Maximum Force            0.000024     0.000450     YES
RMS     Force            0.000011     0.000300     YES
Maximum Displacement     0.000358     0.001800     YES
RMS     Displacement     0.000136     0.001200     YES
Predicted change in Energy=-1.816037D-08
Optimization completed.
   -- Stationary point found.
Frequency Analysis
Low frequencies ---  -12.9211   -0.0039    0.0028    0.0034   11.7293   29.3741
Low frequencies ---  157.7669  195.1331  202.6116
Optimisation (3-21G): DOI:10042/21762
Optimisation (6-31G(d,p)): DOI:10042/21763
Frequency Analysis: DOI:10042/21773
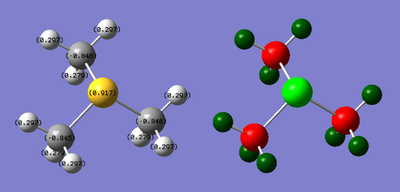
NBO Charge Analysis
The charge limits were set between -0.917 and +0.917.
| S: 0.917 | C: -0.846 | H: 0.297 |
NBO Analysis: DOI:10042/21778
Comparison and Analysis of Results
The N (bond angle 109.479°) and P (109.424°) cations both are tetrahedral to reduce steric strain as they both have four methyl substituents attached. A tetrahedral molecule typically has bond angles of 109.5°, thus confirms that the two cations are of tetrahedral geometry. However, the S containing cation adopts a trigonal pyramidal structure due to a lone pair on the S atom. This repulsion causes a distortion to the geometry compared to a typical trigonal pyramidal structure which has a bond angle of around 107°. The S cation exhibits C-S-C bond angles of 102.803° which suggests the methyl groups are forced closer together due to replusion with the lone pair.
The strongest bond was found to be the N-C bonds of the first cation. This is because of more efficient orbital overlap between N and C as both elements are in the same period. This means the sizes of their orbitals involved in bonding are more compatible. P and S exhibit weaker bonding with C as they are in one period lower than nitrogen. Therefore, they will have larger and more diffuse orbitals that are less efficient at bonding with the C atoms. S has slightly stronger bonding with C than P, which could be because it is in Group 16 and P is in Group 15. This means that S has a greater proton number than P and so has a higher charge and smaller atomic radius (98pm for P vs. 88pm for S). This results in marginally better overlap with the C orbitals.
For the charge distributions below, the charge limits were set between -1.700 to +1.700 for all the cations.
| Cation | NBO Charges | ||
 |
N: -0.295 | C: -0.483 | H: 0.269 |
 |
P: 1.667 | H: 0.298 | |
 |
S: 0.917 | H: 0.297 | |
The main difference observed is from the [N(CH3)4]+. Unlike the other P and S cations, [N(CH3)4]+ appears to possess a negatively charged N center. For [P(CH3)4]+ and [S(CH3)3]+, their P and S centers are of a positive charge. [3] As nitrogen is highly electronegative compared to C (3.04 and 2.55 respectively), it draws the electron density from the methyl groups so that the charge on the C becomes negatively charged. Thus, depicting the cation with the N atom having a +1 charge is inaccurate as this implies the N atom holds the positive charge. However, in reality the positive charge on the molecule arises from the H atoms. The P atom is less electronegative than C (P: 2.19) and so the central P atom is electropositive. The C atoms therefore draws electron density from the P atom, resulting in a more negative charge at -1.060 for the carbon and a more positive charge at 1.667 for P. However, the electronegativies for S and C are similar at 2.58 and 2.55 respectively. The charge on the S is expected to to be around +1, however, as it is slightly more electronegative than C, its charge is more negative at 0.917 as it draws electron density from the C atoms. The charges on the H atoms of the methyl groups remain relatively close for all three molecules.
For the carbon atoms and the central atom, the p orbitals dominate in the bonding. This is compared to s orbitals of the hydrogen atoms. The table below compares the s and p character of the MOs for each of the central atoms. N and P both exhibit the same ratio of s and p character, however for S, the p orbital character is more dominant in comparison. All three also exhibit minimum d character (ranging from 0.03% to 0.85%).
| Atom | s character | p character |
| N | 25% | 75% |
| P | 25% | 75% |
| S | 17% | 83% |
It is also possible to look at the contributions of the central atom to the bond with the carbon. It is expected that the greater the difference in electronegativity between the central atom and the C atoms, the greater the difference in contribution to the bond from the central atom and C atom.
| Molecule | Electronegativity | Difference | X Contribution (%) | C Contribution (%) | Difference | |
| [N(CH3)4]+ | N: 3.04 | C: 2.55 | 0.49 | 33.65 | 66.35 | 32.7 |
| [P(CH3)4]+ | P: 2.19 | C: 2.55 | 0.39 | 59.57 | 40.43 | 19.14 |
| [S(CH3)3]+ | S: 2.58 | C: 2.55 | 0.03 | 48.67 | 51.33 | 2.66 |
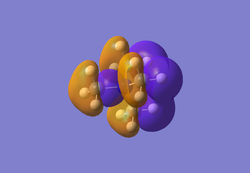
Molecular Orbitals of [N(CH3)4]+
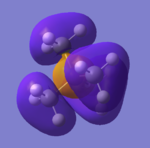
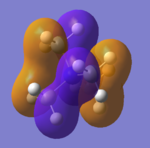
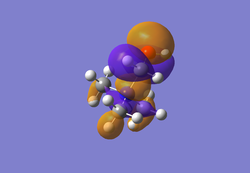
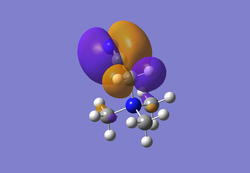
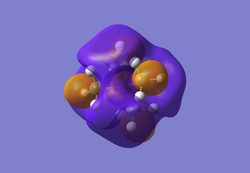
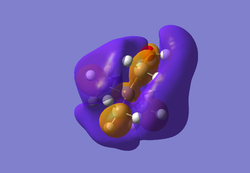
Below are five of the non-core molecular orbitals computed of varying degrees of bonding/anti-bonding interactions.
Influence of Functional Groups: [N(CH3)3(CH2OH)]+ and [N(CH3)3(CH2CN)]+
The cation [N(CH3)4]+ is compared against [N(CH3)3(CH2OH)]+ and [N(CH3)3(CH2CN)]+ in order to compare the MOs and the NBO charges. This is to see what effect the addition of functional groups has to the charge of the molecule. As before, the two new cations were also optimised first using the B3LYP/3-21G basis set, followed by the 6-31G basis set and then using frequency and NBO calculations.
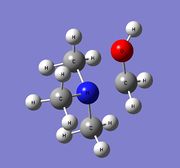
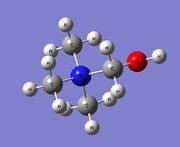
[N(CH3)3(CH2OH)]+
Optimisation and Frequency Analysis
First Optimisation using the 3-21G Basis Set
        Item               Value     Threshold  Converged?
Maximum Force            0.000058     0.000450     YES
RMS     Force            0.000011     0.000300     YES
Maximum Displacement     0.001353     0.001800     YES
RMS     Displacement     0.000345     0.001200     YES
Predicted change in Energy=-4.111780D-08
Optimization completed.
   -- Stationary point found.
Second Optimisation using the 6-31G(d,p) Basis Set
        Item               Value     Threshold  Converged?
Maximum Force            0.000052     0.000450     YES
RMS     Force            0.000007     0.000300     YES
Maximum Displacement     0.000574     0.001800     YES
RMS     Displacement     0.000122     0.001200     YES
Predicted change in Energy=-1.636062D-08
Optimization completed.
   -- Stationary point found.
Frequency Analysis
Low frequencies ---  -15.5841   -5.1124   -0.0010   -0.0006    0.0006   12.2758
Low frequencies ---  130.1353  213.9574  254.2637
Optimisation (3-21G): DOI:10042/21901
Optimisation (6-31G(d,p)): DOI:10042/21903
Frequency Analysis: DOI:10042/21904
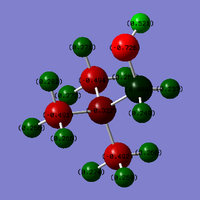
MO and NBO Charge Analysis
Charge limits set as -0.726 to +0.726.

NBO Analysis: DOI:10042/21905
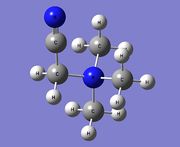
[N(CH3)3(CH2CN)]+
Optimisation and Frequency Analysis
First Optimisation using the 3-21G Basis Set
        Item               Value     Threshold  Converged?
Maximum Force            0.000057     0.000450     YES
RMS     Force            0.000013     0.000300     YES
Maximum Displacement     0.001057     0.001800     YES
RMS     Displacement     0.000173     0.001200     YES
Predicted change in Energy=-3.650013D-08
Optimization completed.
   -- Stationary point found.
Second Optimisation using the 6-31G(d,p) Basis Set
        Item               Value     Threshold  Converged?
Maximum Force            0.000039     0.000450     YES
RMS     Force            0.000008     0.000300     YES
Maximum Displacement     0.000508     0.001800     YES
RMS     Displacement     0.000161     0.001200     YES
Predicted change in Energy=-1.245699D-08
Optimization completed.
   -- Stationary point found.
Frequency Analysis
Low frequencies ---  -13.0186   -0.0007   -0.0005    0.0001   10.3780   11.4245
Low frequencies ---   89.9011  154.7414  205.9199
Optimisation (3-21G): DOI:10042/21876
Optimisation (6-31G(d,p)): DOI:10042/21886
Frequency Analysis: DOI:10042/21890
MO and NBO Charge Analysis
Charge limits set as -0.489 to +0.489.

NBO Analysis: DOI:10042/21896
Comparison of Charge Distribution
The NBO charges for each of the nitrogen cations are tabulated below, along with the charges of each individual atom. The charge limits are set as -0.800 and +0.800 to show the relative charge distribution.
It can be seen that the addition of the hydroxyl and cyano functional groups has an impact on the central nitrogen atom, in comparison to the first nitrogen cation. From the image above, the hydroxyl group is clearly very electron donating. However, it also greatly withdraws the electron density away from the adjacent C atom as its charge is at +0.088 compared to -0.492 to -0.494 on the other C atoms. This is in contrast to the cyano group which is clearly electron withdrawing as the charges on the N, C and H atoms are more positive compared to the unsubstituted compound.
Comparison of HOMOs and LUMOs
The table below shows the HOMO and LUMO molecular orbitals of the three nitrogen centered cations with the energy differences calculated. The HOMO-LUMO gaps are greater when there is higher electron density. This is due to both the HOMO and LUMO being antibonding (as seen below), thus higher electron density present increases the anti-bonding interactions. This is in agreement with the data calculated as the nitrogen cation with the -OH functional group has the highest LUMO energy as it is electron donating. This is followed by the methyl substituted cation and finally the -CN substituted cation. As the cyano group is electron withdrawing, this is expected.
The greater the energy gap between the HOMO and LUMO, the more difficult it is to excite an electron from the HOMO to the LUMO as a larger energy gap must be overcome. However, this means that the molecule is more stable and less reactive. Therefore, those with a smaller energy gap are more reactive and hence more unstable. Judging from this, it means that the order of increasing reactivity is: [N(CH3)4]+, [N(CH3)3CH2OH]+ and [N(CH3)4CH2CN]+. The cyano substituent is more reactive than the hydroxyl as its HOMO-LUMO energy difference is smaller. However, it is not just the energy difference that is brought into consideration but where the orbitals actually lie in terms of energy. Low lying orbitals are less likely to undergo reduction/addition but higher energy orbitals are more likely to undergo oxidation/elimination. And so the hydroxyl substituted cation has the highest energy HOMO and LUMO. The cyano substituted cation has a lower energy LUMO but its HOMO is higher in energy than that of the unsubstituted cation.
References
- ↑ University College London. Main Energy Conversion Factors. http://www.ucl.ac.uk/~uccaati/Energy.html
- ↑ J.Glasier, G. Johansson. On the Structures of the Hydrated Thallium (II) Ion and its Bromide Complexes in Aqueous Solution. Acta Chemica Scandinavica. 1982, 36, 125-135 http://actachemscand.dk/pdf/acta_vol_36a_p0125-0135.pdf
- ↑ R. T. Sanderson, Electronegativities in Inorganic Chemistry II. J. Chem. Ed. 1954, 31 http://pubs.acs.org/doi/abs/10.1021/ed031p2


