
Rep:Mod:SSIO2510
Week one
NOTE There are errors in the calculations and as such the accuracy of the measurements can only be quoted to;
- Accuracy of energy~ 10kjmol-1 or 0.004a.u.
- Accuracy of dipole moments ~ 0.01debye
- 10% error is wavenumbers from frequency analysis
Structural comparison of BH3, GaBr3 and BBr3
BH3
Two optimisations were carried out on the BH3 structure, the first using the basis set 3-21G, which has a very low accuracy, then the basis set 6-31G(d,p) which is far more accurate but takes much longer. The method used for all calculations was: Ground state; Density field theory (DFT), default spin and Hybride function B3LYP.

Item list for 3-21G basis set: conformation of optimisation due to convergence to stationary point. BH3 3-21g output file
 Item Value Threshold Converged?
Maximum Force 0.000090 0.000450 YES
RMS Force 0.000059 0.000300 YES
Maximum Displacement 0.000352 0.001800 YES
RMS Displacement 0.000230 0.001200 YES
Predicted change in Energy=-4.580958D-08
Optimization completed.
-- Stationary point found.
----------------------------
! Optimized Parameters !
! (Angstroms and Degrees) !
-------------------------- --------------------------
! Name Definition Value Derivative Info. !
--------------------------------------------------------------------------------
! R1 R(1,2) 1.1945 -DE/DX = -0.0001 !
! R2 R(1,3) 1.1945 -DE/DX = -0.0001 !
! R3 R(1,4) 1.1945 -DE/DX = -0.0001 !
! A1 A(2,1,3) 120.0 -DE/DX = 0.0 !
! A2 A(2,1,4) 120.0 -DE/DX = 0.0 !
! A3 A(3,1,4) 120.0 -DE/DX = 0.0 !
! D1 D(2,1,4,3) 180.0 -DE/DX = 0.0 !
--------------------------------------------------------------------------------
GradGradGradGradGradGradGradGradGradGradGradGradGradGradGradGradGradGrad

Item list for 6-31G(d,p) basis set: conformation of optimisation due to convergence to stationary point.BH3 6-31g output file
 Item Value Threshold Converged?
Maximum Force 0.000009 0.000450 YES
RMS Force 0.000006 0.000300 YES
Maximum Displacement 0.000038 0.001800 YES
RMS Displacement 0.000025 0.001200 YES
Predicted change in Energy=-5.342731D-10
Optimization completed.
-- Stationary point found.
----------------------------
! Optimized Parameters !
! (Angstroms and Degrees) !
-------------------------- --------------------------
! Name Definition Value Derivative Info. !
--------------------------------------------------------------------------------
! R1 R(1,2) 1.1923 -DE/DX = 0.0 !
! R2 R(1,3) 1.1923 -DE/DX = 0.0 !
! R3 R(1,4) 1.1923 -DE/DX = 0.0 !
! A1 A(2,1,3) 120.0 -DE/DX = 0.0 !
! A2 A(2,1,4) 120.0 -DE/DX = 0.0 !
! A3 A(3,1,4) 120.0 -DE/DX = 0.0 !
! D1 D(2,1,4,3) 180.0 -DE/DX = 0.0 !
--------------------------------------------------------------------------------
GradGradGradGradGradGradGradGradGradGradGradGradGradGradGradGradGradGrad
The bond length between B-H is 1.19Å and the bond angle between H-B-H is 120.0o The total energy for the optimised structure is -26.62 a.u. with a gradient at this energy of 0.00 a.u.
Optimisation of GaBr3

Item list for LanL2DZ basis set: conformation of optimisation due to convergence to stationary point. GaBr3 optimisation output file
 Item Value Threshold Converged?
Maximum Force 0.000000 0.000450 YES
RMS Force 0.000000 0.000300 YES
Maximum Displacement 0.000003 0.001800 YES
RMS Displacement 0.000002 0.001200 YES
Predicted change in Energy=-1.282663D-12
Optimization completed.
-- Stationary point found.
----------------------------
! Optimized Parameters !
! (Angstroms and Degrees) !
-------------------------- --------------------------
! Name Definition Value Derivative Info. !
--------------------------------------------------------------------------------
! R1 R(1,2) 2.3502 -DE/DX = 0.0 !
! R2 R(1,3) 2.3502 -DE/DX = 0.0 !
! R3 R(1,4) 2.3502 -DE/DX = 0.0 !
! A1 A(2,1,3) 120.0 -DE/DX = 0.0 !
! A2 A(2,1,4) 120.0 -DE/DX = 0.0 !
! A3 A(3,1,4) 120.0 -DE/DX = 0.0 !
! D1 D(2,1,4,3) 180.0 -DE/DX = 0.0 !
--------------------------------------------------------------------------------
GradGradGradGradGradGradGradGradGradGradGradGradGradGradGradGradGradGrad
The bond length Ga-Br is 2.35Å and the bond angle Br-Ga-Br is 120o The optimised energy is -41.70 a.u. and gradient is 0.00a.u.
Optimisation of BBr3

Item list for GEN basis set (specified pseudo potentials for all atoms; B with basis set 6-31G (D,P) and Br with LanL2DZ): conformation of optimisation due to convergence to stationary point.BBr3 optimisation output file
Item Value Threshold Converged?
Maximum Force 0.000008 0.000450 YES
RMS Force 0.000005 0.000300 YES
Maximum Displacement 0.000036 0.001800 YES
RMS Displacement 0.000023 0.001200 YES
Predicted change in Energy=-4.027258D-10
Optimization completed.
-- Stationary point found.
----------------------------
! Optimized Parameters !
! (Angstroms and Degrees) !
-------------------------- --------------------------
! Name Definition Value Derivative Info. !
--------------------------------------------------------------------------------
! R1 R(1,2) 1.934 -DE/DX = 0.0 !
! R2 R(1,3) 1.934 -DE/DX = 0.0 !
! R3 R(1,4) 1.934 -DE/DX = 0.0 !
! A1 A(2,1,3) 120.0 -DE/DX = 0.0 !
! A2 A(2,1,4) 120.0 -DE/DX = 0.0 !
! A3 A(3,1,4) 120.0 -DE/DX = 0.0 !
! D1 D(2,1,4,3) 180.0 -DE/DX = 0.0 !
--------------------------------------------------------------------------------
GradGradGradGradGradGradGradGradGradGradGradGradGradGradGradGradGradGrad
The bond angle between Br-B-Br is 120.0o, with the bond length of B-Br at 1.93Å The optimised energy is -64.44a.u. and gradient is 0.00a.u.
Structure comparison
| Molecule | Optimised bond lengths (Å) | Literature bond lengths (Å)[1] |
|---|---|---|
| BH3 | 1.192 | 1.190 |
| GaBr3 | 2.350 | 2.249 |
| BBr3 | 1.934 | 1.893 |
Changing the ligand bound to the boron center results in differing bond length. In comparison to a H atom, Br is much larger, resulting in longer bonds due to the increase in atomic radii. Also Br is more electronegative than that of H, so the bonds between the boron and the bromine are more ionic in nature compared to a boron-hydrogen bond, which is far more covalent due to how close the electronegativity of the two atoms are. The lone pair on the bromine is able to stabilise the empty p orbital of the boron, hence why this molecule does not dimerise, however for BH3, H atoms cannot donate electron density into the p orbital, as such the molecule dimerises to diborane. For both the BH3 and BBr3, the geometry of the molecule is trigonal planar, where the bond angle between the ligands is 120.0o. Although the bonding between Br and B is dipolar, there entire molecule is nonpolar as the summation of these dipolar moments is equal to 0.00 deby. As the H-B bond is non polar, the sum of the vectors are also 0.
Changing the central atom also changes the length of the bond. As Ga is much larger than B, the bond length is greater. There is a greater dipole moment for each Br-Ga bond and H-Ga bond in the direction of the ligands as Ga has a lower electronegativity then boron however, due to the symmetric nature of both molecules, they are non-polar. As both boron and Ga are in group 3, they both have vacant p orbitals. This makes them Lewis acidic. The BBr3 is a harder Lewis acid than GaBr3[2] but both are monomeric. The geometry of both molecules is trigonal planar with bond angles of 120.0 o.
Gaussview does not always draw in bonds where one would expect there to be bonds between atoms, the reason for this is that Gaussview arbitrarily is set so that there is a maximum bond length. As such any bond above this length is not displayed as Gaussview believes that it is just an interaction, however the bond between the atoms does exists.
The atomic orbitals of two atomic orbitals interact to form bonding and antibonding orbitals. When the bonding orbitals are population with electrons and the antibonding are not, then a bond it formed. The energy required to break a bond is in the magnitude of 100kjmol-1 where as the energy required to break intermolecular interactions is much lower, 2 orders of magnitude lower. As such a formal bond can be defined as; when the strength of an interaction between atoms in a molecule is above a certain energetic threshold.
Frequency analysis
Frequency analysts of BH3

Low frequencies --- -3.5991 -1.1355 -0.0055 1.3745 9.7046 9.7707
Low frequencies --- 1162.9825 1213.1733 1213.1760
The frequencies listed in the top line are those excluded when applying the 3n-6 rule (i.e. the -6). They are the motions of the center of mass and should be ( and are) magnitudes smaller than than of the vibrational frequencies. The three "real" vibrational frequencies are 1163, 1213 and 1213 cm-1
| Number | form of the vibration | Frequency (cm-1) | Intensity | Symmetry D3h |
|---|---|---|---|---|
| 1 |  |
1163 | 93 | A''2 |
| 2 |  |
1213 | 14 | E' |
| 3 |  |
1213 | 14 | E' |
| 4 |  |
2582 | 0 | A'1 |
| 5 |  |
2716 | 126 | E' |
| 6 |  |
2716 | 126 | E' |

There are only three peaks shown. The reason for this is that vibrations 2 and 3, and vibration 4 and 5 are degenerate, they have the energy and frequency, therefore they will appear as one peak. Vibration four does not cause a peak as this vibration is totally symmetric (A''1) and as such is Infrared inactive as there is no change in dipole.
Frequency analysts of GaBr3

Low frequencies --- -0.5252 -0.5247 -0.0024 -0.0010 0.0235 1.2010
Low frequencies --- 76.3744 76.3753 99.6982
The three "real" vibrational modes are at 76, 76 and 100cm-1, with 76 being the lowest real mode.

| Number | form of the vibration | Frequency (cm-1) | Intensity | Symmetry D3h |
|---|---|---|---|---|
| 1 | Two Br atoms move towards each other while a third moves away.The Ga atom moves away from the converging Br atoms (equivalent to mode 3 in BH3 | 76 | 3 | E' |
| 2 | Two Br atoms converge. The third Br atom and the Ga move in the same direction, away from the convergence (equivalent to mode 2 in BH3) | 76 | 3 | E' |
| 3 | Concerted motion of Br atoms moving together in and out of the plane. The Ga atom moves in the opposite direction (equivalent to mode 1) in BH3) | 100 | 9 | A''2 |
| 4 | All the Br atoms move in and out together in a concerted motion. Ga atom is stationary (equivalent to mode 4 n BH3) | 197 | 0 | A'1 |
| 5 | Asymmetric stretch and contraction of two Br atoms towards and away from the Ga atom. The Ga atom moves towards the contracting atom. The other Br atom is stationary (equivalent to mode 5 in BH3) | 316 | 57 | E' |
| 6 | Two Br atom move towards the Ga atom while a third moves away and vice versa. The Ga atom is pulled towards the contracted atoms(equivalent to mode 6 in BH3). | 316 | 57 | E' |
Comparison of IR frequencies between BH3 and GaBr3
| Symmetry label and number | Frequency for BH3(cm-1 ) | Frequency of GaBr3(cm-1) |
|---|---|---|
| A''2 (no.1 and 3) | 1163 | 100 |
| E' (no.2 and 2) | 1213 | 76 |
| E' (no.3 and 1) | 1213 | 76 |
| A'1 (no.4 and 4) | 2582 | 197 |
| E' (no.5 and 5) | 2716 | 316 |
| E' (no.6 and 6) | 2716 | 316 |
For all comparative vibrations, the GaBr3 vibration has a much lower frequency. This can be rationalised by Hooke's law[3] . For Polyatomic molecules, the equation is
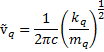 .
.

It can be seen from this equation that the wavenumber is proportional to that of the force constant (k)over the effective mass (m). q is the normal mode of vibrations. As such, it can be stated that, for an increase in bond strength (which corresponds to an increase in the force constant), then the vibrational mode will increase the wavenumber. Conversely, if the mass of the atoms involved in the vibrational mode increases, then the wavenumber of the mode decreases.
There has been a swapping of the A''2 symmetric vibrations and the high energy E' vibrations, meaning that the energy required to break the symmetry that results in A''2 is lower than that of the energy required to break the symmetry that results in the high energy E' for GaBr3. For BH3, the opposite is true.
The spectra of the two molecules have the same form, that is 2 small peaks at the higher end of the spectrum, with one large peak at a lower frequency. As the A'1 vibration is IR inactive, it is not present in either spectra. Due to the exchange in modes, the A''2 vibration is represented by the first peak in the BH3 spectra but is the second peak in the GaBr3 sprectra. In both spectra, this vibration shows a higher intensity than that of the high energy E' and as such shows there is a greater change in the dipole. The low energy E', has a very large dipole change and as such in both spectra, it has the highest intensity. For GaBr3 the peaks appear to be broader however this can be rationalised by the fact that the scaling is much smaller than that of BH3 as the energy difference between the 2 high energy peaks and the low energy peak is much smaller. The difference in absorption between bending and stretching modes for larger atoms is not as great compared to smaller atoms. Bending modes absorb a higher frequency than stretching modes due to unfavourable angles, as such the bending modes of A'2 and E' are fairly close together but far away from the stretching vibrations; A''2 and E'.
For each frequency analysis calculation, the same basis set for the optimisation was used. This is important as the energies that are calculated are highly dependent of the basis-set and will change with different sets. When running the frequency analysis, it is important that the calculations start at the energy minimum. This would not be the case if another basis-set is used as the molecule would not have been optimised with this basis set and so not be at the energy minimum.Different basis sets are incompatible. The purpose of the frequency analyst allows for identification of the degenerate orbitals of the molecule by calculating their symmetry and there frequency. It also enables us to identify if the optimisation calculation has either reached a minimum or a transition state by taking the second derivative of the potential energy curve. This is shown under the low frequency section. As these numbered are close to zero then it shows that optimisation has been achieved. Also, by doing a frequency test, the Gibbs free energy and the thermal energy can be calculated, allowing for thermodynamic analysis of the molecule.
Molecular orbital and NBO analysis
BH3


There is not significant difference between the Real MO and the LCAO as all main features are present. This shows how successful the MO theory is at predicting MO's and as such makes in very useful for predicting the population of electrons within a molecule.
NBO analysis of NH3
The NH3 molecule was firstly optimisation using the method of: Ground state; Density field theory (DFT), default spin and Hybride function B3LYP. The basis set was 6-31G

Item Value Threshold Converged?
Maximum Force 0.000002 0.000015 YES
RMS Force 0.000001 0.000010 YES
Maximum Displacement 0.000005 0.000060 YES
RMS Displacement 0.000003 0.000040 YES
Predicted change in Energy=-9.677503D-12
Optimization completed.
-- Stationary point found.
----------------------------
! Optimized Parameters !
! (Angstroms and Degrees) !
-------------------------- --------------------------
! Name Definition Value Derivative Info. !
--------------------------------------------------------------------------------
! R1 R(1,2) 1.018 -DE/DX = 0.0 !
! R2 R(1,3) 1.018 -DE/DX = 0.0 !
! R3 R(1,4) 1.018 -DE/DX = 0.0 !
! A1 A(2,1,3) 105.7447 -DE/DX = 0.0 !
! A2 A(2,1,4) 105.7444 -DE/DX = 0.0 !
! A3 A(3,1,4) 105.7444 -DE/DX = 0.0 !
! D1 D(2,1,4,3) -111.8637 -DE/DX = 0.0 !
--------------------------------------------------------------------------------
GradGradGradGradGradGradGradGradGradGradGradGradGradGradGradGradGradGrad
A frequency analysis was done to check that the molecule was optimised.

Low frequencies --- -6.9793 -5.1218 -0.2141 -0.0019 -0.0018 0.0007
Low frequencies --- 1089.3464 1693.9251 1693.9291
The "-6" vibrational terms are low, therefore the structure is at a minimum and not a transition state. There are also no negative "real" frequencies as the lowest frequencies ( the ones quotes) are not negative.
Finally a population analysis was preformed, and both a .log and .chk file were outputted.

The charge distribution in the molecule can be determined by using NBO analysis.

The bright red colour indicates a highly negative charges and the bright green colour represents highly positive charges. As expected, the more electronegative nitrogen atoms is red while the more electropositive hydrogen atoms are green.
Association energies of Ammonia-Borane
A molecule of NH3BH3 was optimised using the method of: Ground state; Density field theory (DFT), default spin and Hybride function B3LYP. The basis set was 6-31G

Item Value Threshold Converged?
Maximum Force 0.000002 0.000015 YES
RMS Force 0.000001 0.000010 YES
Maximum Displacement 0.000027 0.000060 YES
RMS Displacement 0.000012 0.000040 YES
Predicted change in Energy=-9.266090D-11
Optimization completed.
-- Stationary point found.
----------------------------
! Optimized Parameters !
! (Angstroms and Degrees) !
-------------------------- --------------------------
! Name Definition Value Derivative Info. !
--------------------------------------------------------------------------------
! R1 R(1,7) 1.0185 -DE/DX = 0.0 !
! R2 R(2,7) 1.0185 -DE/DX = 0.0 !
! R3 R(3,7) 1.0185 -DE/DX = 0.0 !
! R4 R(4,8) 1.2098 -DE/DX = 0.0 !
! R5 R(5,8) 1.2098 -DE/DX = 0.0 !
! R6 R(6,8) 1.2098 -DE/DX = 0.0 !
! R7 R(7,8) 1.6677 -DE/DX = 0.0 !
! A1 A(1,7,2) 107.8747 -DE/DX = 0.0 !
! A2 A(1,7,3) 107.8747 -DE/DX = 0.0 !
! A3 A(1,7,8) 111.0241 -DE/DX = 0.0 !
! A4 A(2,7,3) 107.8748 -DE/DX = 0.0 !
! A5 A(2,7,8) 111.024 -DE/DX = 0.0 !
! A6 A(3,7,8) 111.024 -DE/DX = 0.0 !
! A7 A(4,8,5) 113.8739 -DE/DX = 0.0 !
! A8 A(4,8,6) 113.874 -DE/DX = 0.0 !
! A9 A(4,8,7) 104.5973 -DE/DX = 0.0 !
! A10 A(5,8,6) 113.8739 -DE/DX = 0.0 !
! A11 A(5,8,7) 104.5974 -DE/DX = 0.0 !
! A12 A(6,8,7) 104.5974 -DE/DX = 0.0 !
! D1 D(1,7,8,4) 179.9998 -DE/DX = 0.0 !
! D2 D(1,7,8,5) -60.0003 -DE/DX = 0.0 !
! D3 D(1,7,8,6) 59.9998 -DE/DX = 0.0 !
! D4 D(2,7,8,4) -60.0002 -DE/DX = 0.0 !
! D5 D(2,7,8,5) 59.9997 -DE/DX = 0.0 !
! D6 D(2,7,8,6) 179.9998 -DE/DX = 0.0 !
! D7 D(3,7,8,4) 59.9998 -DE/DX = 0.0 !
! D8 D(3,7,8,5) -180.0003 -DE/DX = 0.0 !
! D9 D(3,7,8,6) -60.0002 -DE/DX = 0.0 !
--------------------------------------------------------------------------------
GradGradGradGradGradGradGradGradGradGradGradGradGradGradGradGradGradGrad
A stationary point was found as indicated by the gradient of the potential energy curve at this point being 0.
To check that a minimal has been reached and not just a transition state,frequency analysis of the NH3BH3 molecule was done.

Low frequencies --- -4.1898 -2.9174 -0.0010 -0.0007 0.0007 4.5054
Low frequencies --- 263.3214 632.9688 638.3926
As can be seen, the low frequency numbers are indeed low and there are no negative "real" frequencies. Therefore the optimisation has reached a minimum.
When calculating association energies, it is important to use the same basis-set as the energy calculation strongly depends on this and as such the total energy is meaningless, however the relative energy of molecules is useful, which is why for each optimisation performed for NH3, BH3 and NH3BH3 6-31G(d,p) was used.
E(NH3)= -56.56 a.u. E(BH3)= -26.62 a.u. E(NH3BH3)= -83.22 a.u.
The change in energy, ΔE, is equal to E(NH3BH3)-[E(NH3)+E(BH3)] ΔE=0.04 a.u. converting a.u. into kJmol-1: ΔE= 105.02kJ/mol. The dissociation energy of NH3BH3 into NH3 +BH3 is approximately 105.02kJmol-1 therefore the molecules are more stable as an adduct rather than separate molecules.
Week two: Lewis acid project
Relative energies different of Al2Cl4Br2 isomers
There are four isomers of Al2Cl4Br2 which have the monomer AlCl2Br. The molecules were optimisated and their relative energies were calculated using the basis sets 6-31G(d,p) for the Al and Cl atoms, and the pseudo potential LanL2DZ for the Br atom.

D2h isomer optimisation

 Item Value Threshold Converged?
Maximum Force 0.000033 0.000450 YES
RMS Force 0.000016 0.000300 YES
Maximum Displacement 0.000831 0.001800 YES
RMS Displacement 0.000412 0.001200 YES
Predicted change in Energy=-5.127119D-08
Optimization completed.
-- Stationary point found.
----------------------------
! Optimized Parameters !
! (Angstroms and Degrees) !
-------------------------- --------------------------
! Name Definition Value Derivative Info. !
--------------------------------------------------------------------------------
! R1 R(1,3) 2.489 -DE/DX = 0.0 !
! R2 R(1,8) 2.4892 -DE/DX = 0.0 !
! R3 R(2,3) 2.4895 -DE/DX = 0.0 !
! R4 R(2,8) 2.4889 -DE/DX = 0.0 !
! R5 R(3,4) 2.0935 -DE/DX = 0.0 !
! R6 R(3,5) 2.0934 -DE/DX = 0.0 !
! R7 R(6,8) 2.0935 -DE/DX = 0.0 !
! R8 R(7,8) 2.0935 -DE/DX = 0.0 !
! A1 A(3,1,8) 88.2561 -DE/DX = 0.0 !
! A2 A(3,2,8) 88.2519 -DE/DX = 0.0 !
! A3 A(1,3,2) 91.7404 -DE/DX = 0.0 !
! A4 A(1,3,4) 109.7906 -DE/DX = 0.0 !
! A5 A(1,3,5) 109.8295 -DE/DX = 0.0 !
! A6 A(2,3,4) 109.8211 -DE/DX = 0.0 !
! A7 A(2,3,5) 109.7911 -DE/DX = 0.0 !
! A8 A(4,3,5) 121.7543 -DE/DX = 0.0 !
! A9 A(1,8,2) 91.7516 -DE/DX = 0.0 !
! A10 A(1,8,6) 109.7946 -DE/DX = 0.0 !
! A11 A(1,8,7) 109.7861 -DE/DX = 0.0 !
! A12 A(2,8,6) 109.8141 -DE/DX = 0.0 !
! A13 A(2,8,7) 109.8198 -DE/DX = 0.0 !
! A14 A(6,8,7) 121.7617 -DE/DX = 0.0 !
! D1 D(8,1,3,2) -0.0064 -DE/DX = 0.0 !
! D2 D(8,1,3,4) -111.8127 -DE/DX = 0.0 !
! D3 D(8,1,3,5) 111.7744 -DE/DX = 0.0 !
! D4 D(3,1,8,2) 0.0064 -DE/DX = 0.0 !
! D5 D(3,1,8,6) 111.8103 -DE/DX = 0.0 !
! D6 D(3,1,8,7) -111.802 -DE/DX = 0.0 !
! D7 D(8,2,3,1) 0.0064 -DE/DX = 0.0 !
! D8 D(8,2,3,4) 111.7853 -DE/DX = 0.0 !
! D9 D(8,2,3,5) -111.809 -DE/DX = 0.0 !
! D10 D(3,2,8,1) -0.0064 -DE/DX = 0.0 !
! D11 D(3,2,8,6) -111.7927 -DE/DX = 0.0 !
! D12 D(3,2,8,7) 111.7717 -DE/DX = 0.0 !
--------------------------------------------------------------------------------
GradGradGradGradGradGradGradGradGradGradGradGradGradGradGradGradGradGrad
The Energy of the optimisation is -2352.41a.u and gradient of 0.00.a.u.
| Bond | Optimised length (Å) | Literature length (Å)[1] |
|---|---|---|
| Cl-Al (terminal) | 2.09 | 2.06 |
| Br-Al (bridging) | 2.49 | 2.43 |
| Bond angles | Optimised angle (o) | Literature length (o)[1] |
|---|---|---|
| Br-Al-Br bridging | 91.8 | 91.6 |
| Cl-Al-Cl terminal | 121.8 | 122 |

A frequency analysis of the optimised isomer was undertaken to determine whether a minimum or a transition state had been identified.
Low frequencies --- -5.4044 -5.3594 -3.5626 -0.0017 0.0025 0.0031
Low frequencies --- 14.7098 63.2663 86.0766
The low frequencies are below a +/- range of 15cm-1 and the real frequencies are positive, therefore a minimum has been reached.
C1 optimisation

 Item Value Threshold Converged?
Maximum Force 0.000031 0.000450 YES
RMS Force 0.000014 0.000300 YES
Maximum Displacement 0.000876 0.001800 YES
RMS Displacement 0.000327 0.001200 YES
Predicted change in Energy=-1.573169D-08
Optimization completed.
-- Stationary point found.
----------------------------
! Optimized Parameters !
! (Angstroms and Degrees) !
-------------------------- --------------------------
! Name Definition Value Derivative Info. !
--------------------------------------------------------------------------------
! R1 R(1,2) 2.4863 -DE/DX = 0.0 !
! R2 R(1,6) 2.4823 -DE/DX = 0.0 !
! R3 R(2,3) 2.0943 -DE/DX = 0.0 !
! R4 R(2,7) 2.2757 -DE/DX = 0.0 !
! R5 R(2,8) 2.3033 -DE/DX = 0.0 !
! R6 R(4,6) 2.093 -DE/DX = 0.0 !
! R7 R(5,6) 2.0929 -DE/DX = 0.0 !
! R8 R(6,8) 2.3011 -DE/DX = 0.0 !
! A1 A(2,1,6) 84.7239 -DE/DX = 0.0 !
! A2 A(1,2,3) 109.9403 -DE/DX = 0.0 !
! A3 A(1,2,7) 110.7177 -DE/DX = 0.0 !
! A4 A(1,2,8) 90.9179 -DE/DX = 0.0 !
! A5 A(3,2,7) 121.4893 -DE/DX = 0.0 !
! A6 A(3,2,8) 109.4504 -DE/DX = 0.0 !
! A7 A(7,2,8) 110.0699 -DE/DX = 0.0 !
! A8 A(1,6,4) 110.2016 -DE/DX = 0.0 !
! A9 A(1,6,5) 110.1939 -DE/DX = 0.0 !
! A10 A(1,6,8) 91.0696 -DE/DX = 0.0 !
! A11 A(4,6,5) 121.753 -DE/DX = 0.0 !
! A12 A(4,6,8) 109.6737 -DE/DX = 0.0 !
! A13 A(5,6,8) 109.6561 -DE/DX = 0.0 !
! A14 A(2,8,6) 93.2885 -DE/DX = 0.0 !
! D1 D(6,1,2,3) 111.1052 -DE/DX = 0.0 !
! D2 D(6,1,2,7) -111.9009 -DE/DX = 0.0 !
! D3 D(6,1,2,8) -0.0003 -DE/DX = 0.0 !
! D4 D(2,1,6,4) -111.4481 -DE/DX = 0.0 !
! D5 D(2,1,6,5) 111.4285 -DE/DX = 0.0 !
! D6 D(2,1,6,8) 0.0003 -DE/DX = 0.0 !
! D7 D(1,2,8,6) 0.0003 -DE/DX = 0.0 !
! D8 D(3,2,8,6) -111.5542 -DE/DX = 0.0 !
! D9 D(7,2,8,6) 112.4912 -DE/DX = 0.0 !
! D10 D(1,6,8,2) -0.0003 -DE/DX = 0.0 !
! D11 D(4,6,8,2) 111.9296 -DE/DX = 0.0 !
! D12 D(5,6,8,2) -111.9191 -DE/DX = 0.0 !
--------------------------------------------------------------------------------
GradGradGradGradGradGradGradGradGradGradGradGradGradGradGradGradGradGrad
The energy of the optimisation is -2352.41a.u. and a gradient of 0.00a.u.
| Bond | Optimised length (Å) | Literature length (Å)[1] |
|---|---|---|
| Cl-Al-Br (terminal) | 2.09 | 2.06 |
| Cl-Al-Br (terminal) | 2.39 | 2.23 |
| Cl-Al-Cl (terminal) | 2.09 | 2.06 |
| Br-Al (bridging) | 2.49 | 2.43 |
| Cl-Al(bridging) | 2.49 | 2.25 |
| Bond angles | Optimised angle (o) | Literature length (o)[1] |
|---|---|---|
| Cl-Al-Br bridging | 91.7 | 91.6 |
| Cl-Al-Br terminal | 121.8 | 122 |
| Cl-Al-Cl terminal | 121.8 | 122 |

 Low frequencies --- -2.4374 0.0001 0.0017 0.0030 0.9884 3.2079
Low frequencies --- 17.1226 55.9585 80.0537
The low frequencies are low and the real frequencies are positive, therefore a minimum was reached.
C2h optimisation

 Item Value Threshold Converged?
Maximum Force 0.000083 0.000450 YES
RMS Force 0.000032 0.000300 YES
Maximum Displacement 0.001582 0.001800 YES
RMS Displacement 0.000617 0.001200 YES
Predicted change in Energy=-1.157853D-07
Optimization completed.
-- Stationary point found.
----------------------------
! Optimized Parameters !
! (Angstroms and Degrees) !
-------------------------- --------------------------
! Name Definition Value Derivative Info. !
--------------------------------------------------------------------------------
! R1 R(1,2) 2.0939 -DE/DX = 0.0 !
! R2 R(1,5) 2.2746 -DE/DX = 0.0 !
! R3 R(1,6) 2.2981 -DE/DX = 0.0 !
! R4 R(1,7) 2.2981 -DE/DX = 0.0 !
! R5 R(3,4) 2.0939 -DE/DX = 0.0 !
! R6 R(4,6) 2.2981 -DE/DX = 0.0 !
! R7 R(4,7) 2.2981 -DE/DX = 0.0 !
! R8 R(4,8) 2.2746 -DE/DX = 0.0 !
! A1 A(2,1,5) 121.5143 -DE/DX = 0.0 !
! A2 A(2,1,6) 109.8418 -DE/DX = 0.0 !
! A3 A(2,1,7) 109.8418 -DE/DX = 0.0 !
! A4 A(5,1,6) 110.5035 -DE/DX = 0.0 !
! A5 A(5,1,7) 110.5035 -DE/DX = 0.0 !
! A6 A(6,1,7) 90.1898 -DE/DX = -0.0001 !
! A7 A(3,4,6) 109.8418 -DE/DX = 0.0 !
! A8 A(3,4,7) 109.8418 -DE/DX = 0.0 !
! A9 A(3,4,8) 121.5143 -DE/DX = 0.0 !
! A10 A(6,4,7) 90.1898 -DE/DX = -0.0001 !
! A11 A(6,4,8) 110.5035 -DE/DX = 0.0 !
! A12 A(7,4,8) 110.5035 -DE/DX = 0.0 !
! A13 A(1,6,4) 89.8102 -DE/DX = 0.0001 !
! A14 A(1,7,4) 89.8102 -DE/DX = 0.0001 !
! D1 D(2,1,6,4) -111.2257 -DE/DX = 0.0 !
! D2 D(5,1,6,4) 112.0364 -DE/DX = 0.0 !
! D3 D(7,1,6,4) 0.0 -DE/DX = 0.0 !
! D4 D(2,1,7,4) 111.2257 -DE/DX = 0.0 !
! D5 D(5,1,7,4) -112.0364 -DE/DX = 0.0 !
! D6 D(6,1,7,4) 0.0 -DE/DX = 0.0 !
! D7 D(3,4,6,1) -111.2257 -DE/DX = 0.0 !
! D8 D(7,4,6,1) 0.0 -DE/DX = 0.0 !
! D9 D(8,4,6,1) 112.0364 -DE/DX = 0.0 !
! D10 D(3,4,7,1) 111.2257 -DE/DX = 0.0 !
! D11 D(6,4,7,1) 0.0 -DE/DX = 0.0 !
! D12 D(8,4,7,1) -112.0364 -DE/DX = 0.0 !
--------------------------------------------------------------------------------
GradGradGradGradGradGradGradGradGradGradGradGradGradGradGradGradGradGrad
The optimised energy is -2352.42a.u. with gradient of 0.00 a.u.
| Bond | Optimised length (Å) | Literature length (Å)[1] |
|---|---|---|
| Cl-Al-Br (terminal) | 2.09 | 2.06 |
| Cl-Al-Br (terminal) | 2.27 | 2.23 |
| Cl-Al(bridging) | 2.29 | 2.25 |
| Bond angles | Optimised angle (o) | Literature length (o)[1] |
|---|---|---|
| Cl-Al-Cl bridging | 90.2 | 91.6 |
| Cl-Al-Br terminal | 121.5 | 122 |

Low frequencies ---   -3.5010   -2.4148   -0.0025    0.0023    0.0026    0.7529

Low frequencies ---   17.7470   49.0304   72.9457
The low frequencies are low and the real frequencies are positive, therefore a minimum has been reached.
C2v optimisation

 Item Value Threshold Converged?
Maximum Force 0.000082 0.000450 YES
RMS Force 0.000032 0.000300 YES
Maximum Displacement 0.001746 0.001800 YES
RMS Displacement 0.000596 0.001200 YES
Predicted change in Energy=-1.019224D-07
Optimization completed.
-- Stationary point found.
----------------------------
! Optimized Parameters !
! (Angstroms and Degrees) !
-------------------------- --------------------------
! Name Definition Value Derivative Info. !
--------------------------------------------------------------------------------
! R1 R(1,4) 2.298 -DE/DX = 0.0 !
! R2 R(1,5) 2.298 -DE/DX = 0.0 !
! R3 R(1,7) 2.2747 -DE/DX = 0.0 !
! R4 R(1,8) 2.0939 -DE/DX = 0.0 !
! R5 R(2,3) 2.0939 -DE/DX = 0.0 !
! R6 R(3,4) 2.298 -DE/DX = 0.0 !
! R7 R(3,5) 2.298 -DE/DX = 0.0 !
! R8 R(3,6) 2.2747 -DE/DX = 0.0 !
! A1 A(4,1,5) 90.1854 -DE/DX = -0.0001 !
! A2 A(4,1,7) 110.4962 -DE/DX = 0.0 !
! A3 A(4,1,8) 109.8502 -DE/DX = 0.0 !
! A4 A(5,1,7) 110.4962 -DE/DX = 0.0 !
! A5 A(5,1,8) 109.8502 -DE/DX = 0.0 !
! A6 A(7,1,8) 121.515 -DE/DX = 0.0 !
! A7 A(2,3,4) 109.8502 -DE/DX = 0.0 !
! A8 A(2,3,5) 109.8502 -DE/DX = 0.0 !
! A9 A(2,3,6) 121.515 -DE/DX = 0.0 !
! A10 A(4,3,5) 90.1854 -DE/DX = -0.0001 !
! A11 A(4,3,6) 110.4962 -DE/DX = 0.0 !
! A12 A(5,3,6) 110.4962 -DE/DX = 0.0 !
! A13 A(1,4,3) 89.8126 -DE/DX = 0.0001 !
! A14 A(1,5,3) 89.8126 -DE/DX = 0.0001 !
! D1 D(5,1,4,3) -0.4763 -DE/DX = 0.0 !
! D2 D(7,1,4,3) -112.5019 -DE/DX = 0.0 !
! D3 D(8,1,4,3) 110.7581 -DE/DX = 0.0 !
! D4 D(4,1,5,3) 0.4763 -DE/DX = 0.0 !
! D5 D(7,1,5,3) 112.5019 -DE/DX = 0.0 !
! D6 D(8,1,5,3) -110.7581 -DE/DX = 0.0 !
! D7 D(2,3,4,1) -110.7581 -DE/DX = 0.0 !
! D8 D(5,3,4,1) 0.4763 -DE/DX = 0.0 !
! D9 D(6,3,4,1) 112.5019 -DE/DX = 0.0 !
! D10 D(2,3,5,1) 110.7581 -DE/DX = 0.0 !
! D11 D(4,3,5,1) -0.4763 -DE/DX = 0.0 !
! D12 D(6,3,5,1) -112.5019 -DE/DX = 0.0 !
--------------------------------------------------------------------------------

GradGradGradGradGradGradGradGradGradGradGradGradGradGradGradGradGradGrad
The optimised energy is -2352.42a.u. and the gradient is 0.00a.u.
| Bond | Optimised length (Å) | Literature length (Å)[1] |
|---|---|---|
| Cl-Al-Br (terminal) | 2.09 | 2.06 |
| Cl-Al-Br (terminal) | 2.27 | 2.23 |
| Cl-Al(bridging) | 2.30 | 2.25 |
| Bond angles | Optimised angle (o) | Literature length (o)[1] |
|---|---|---|
| Cl-Al-Cl bridging | 90.2 | 91.6 |
| Cl-Al-Br terminal | 121.5 | 122 |

Low frequencies --- -3.6729 -2.5091 0.0013 0.0018 0.0028 1.0726
Low frequencies --- 17.1862 50.9721 78.5418
The low frequencies are low and the real frequencies are positive. A minimum has been reached.
Relative energies of the isomers
| Isomer | Optimised energy (a.u.) | Energy difference to lowest energy isomer (a.u.) | Energy difference in (kJmol-1) |
|---|---|---|---|
| D2h | -2352.40630807 | 0.00997993 | 26.2 |
| C1 | -2352.41109946 | 0.00518854 | 13.6 |
| C2h | -2352.41628800 | 0.00 | 0.00 |
| C2v | -2352.41626665 | 0.00002135 | 0.01 |
NOTE There is an error range of roughly 10kJmol-1 or 0.003a.u. The energy difference between C2h and C2v is within this error range. As such to determine which isomer is more stable, a more accurate calculation would need to be undertaken. It is expected that these isomers were very close in energy, and as such the lowest energy quoted ( that of the C2h) will be used as the lowest energy isomer.
The position of the bromine has a significant effect on the stability of the molecule. The D2h isomer has the highest energy as the two Br atoms are bridging the AlCl2Br monomers. When halides bridge in this manner, a dative covalent bond is formed between the halide and the other monomer. The P acceptor orbital on the Al and the P donor orbital on a Cl is able to overlap more as they are similar in energy. The greater the overlap, the greater the stabilisation of the resulting sigma bond. This makes the bonding between Al-Cl stronger than that of Al-Br, as reflected by the their bond lengths. As D2h as only Al-Br bridging bonds, it is the least energetically stable. As is expected with this explanation, the C1 isomer, which has 1 Al-Cl bridging bond and 1 Al-Br bridging bond, is more stable than the D2h but less stable than the C2h and C2v isomers. The two isomers with two Cl-Al bonds are very similar in energy, and as discussed above, it is not appropriate to determine which is more stable using this method.
Dissociation energy of Al2Cl4Br2
The dissociation energy of the dimer can be calculated by determining the relative energy of the 2 monomers. As such the structure of AlCl2Br was optimisated and a frequency analysis of this optimisation was performed.

 Item Value Threshold Converged?
Maximum Force 0.000136 0.000450 YES
RMS Force 0.000073 0.000300 YES
Maximum Displacement 0.000760 0.001800 YES
RMS Displacement 0.000497 0.001200 YES
Predicted change in Energy=-7.984418D-08
Optimization completed.
-- Stationary point found.
----------------------------
! Optimized Parameters !
! (Angstroms and Degrees) !
-------------------------- --------------------------
! Name Definition Value Derivative Info. !
--------------------------------------------------------------------------------
! R1 R(1,2) 2.2695 -DE/DX = -0.0001 !
! R2 R(1,3) 2.089 -DE/DX = -0.0001 !
! R3 R(1,4) 2.089 -DE/DX = -0.0001 !
! A1 A(2,1,3) 120.0823 -DE/DX = -0.0001 !
! A2 A(2,1,4) 120.0823 -DE/DX = -0.0001 !
! A3 A(3,1,4) 119.8353 -DE/DX = 0.0001 !
! D1 D(2,1,4,3) 180.0 -DE/DX = 0.0 !
--------------------------------------------------------------------------------
GradGradGradGradGradGradGradGradGradGradGradGradGradGradGradGradGradGrad
The optimisated energy is -1176.19a.u. with a gradient of 0.00a.u.
| Bond | Optimised length (Å) |
|---|---|
| Cl-Al-Br (terminal) | 2.09 |
| Cl-Al-Br (terminal) | 2.27 |
| Bond angles | Optimised angle (o) |
|---|---|
| Cl-Al-Cl terminal | 119.8 |
| Cl-Al-Br terminal | 120.1 |

Low frequencies --- 0.0029 0.0031 0.0034 1.3569 3.6367 4.2604
Low frequencies --- 120.5042 133.9178 185.8950
The low frequencies are low and the real frequencies are integers. A minimum has been reached.
The dissociation energy is the change in energy required to split the dimer into two monomers. ΔE=2E(AlCl2Br - E(Al2Cl4Br2)
ΔE=2*-1176.19 -(-2352.42) = 0.036a.u. or 22.6kJmol-1
22.6kJmol-1 of energy is required to dissociate the dimer into 2 monomers, therefore the dimer is more stable that of the isolated monomers. This can be rationalised by lewis acid nature of the monomers, due to it being electron deficient. Dimerising alleviate this deficiency.
IR spectra and vibrational modes of the Al2Cl4Br2isomers
D2h

There are a total of 18 vibrational modes, however only 8 appear in the spectra. The vibrations that do not create a change in the dipole moment of the structure are said to be IR inactive, and therefore have an intensity of 0. The classical justification for this is that for a molecule to absorb a photon of a certain frequency then that molecule must have a dipole which oscillates at an equal frequency. The gross selection rule for vibrations is that when the dipole changes as the molecule vibrates, the electromagnetic field is forced to oscillate, the opposite is true also.[3] If there is no change in dipole, then, there can be no interaction with the electromagnetic field. It should be noted that
| Mode | Form of vibration | Frequency(cm-1) | Intensity | Symmetry |
|---|---|---|---|---|
| 1 | 
The 4 terminal chlorine atoms rock back and forth symmetrically, so that two Cl cis to each other move towards each other while the other cis pair move away. The bridging bromines moves up and down, away from the chlorines coming together. The Al atoms are stationary. |
14 | 0.34 | Bu |
| 5 | 
The 4 terminal chlorine move in and out of the plane while the bridging bromine and Al atoms move in the opposite direction |
107 | 4.58 | Bu |
| 7 | 
Two terminal chlorine atoms, bonded to the same Al, move towards each other, while the after two terminal atoms move away. The bridging bromines and Al atoms move towards to side which has the chlorine atoms furthest apart. |
126 | 8.16 | Au |
| 9 | 
Two cis chlorine atoms and the bridging bromine atoms move towards each other. The other chlorine atoms move away from the bromine. The Al atoms move in the opposite direction to that of the bromine. |
138 | 7.04 | Au |
| 12 | 
The bridging bromine and one of the Al atoms move towards each other. The chlorine atoms bonded to this Al move closer together. The other Al moves in the opposite direction to that of the bromine, and the chlorine atoms move apart. |
241 | 99.66 | Au |
| 14 | 
The Al atoms move in and out of the plane of the molecule, while all the other atoms in the molecule move in the opposite direction. |
341.44 | 160.63 | Bu |
| 15 | 
Two chlorine atoms and the Al atom they are bonded to move together. The other Al atom moves in the same direction. The bridging bromine move in the opposite direction to that of the Al. The other two chlorine atoms move away from each other. |
467 | 346.60 | Bu |
| 18 | 
|
616 | 331.797 | Bu |
C1

There are 18 vibrations, all of which are IR active. This is due to the asymmetric nature of the molecule. All the vibrations have the symmetry A. There are only 13 vibrations in the IR spectra, this is due to some vibrations having a very low intensity as the change in dipole is very small.
C2h

There are 18 vibrations. Only 8 cause a change in dipole, therefore only 8 are IR active, this is shown with there being only 8 peaks in the spectra.
C2v

Like the other isomers, there are 18 vibrational modes, but only 12 vibrations that cause a change in dipole, therefore there are 12 peaks in the IR spectra.
The more symmetric molecules have less IR bands because there are more symmetric vibrations, which are not IR active as the dipole moment of the molecule does not change. This can be seen with the C1 molecule, which is totally asymmetric, and as such all the vibrational modes are IR active. Due to the large nature of the Br atom, the movement of atom is less in comparison to a Cl atom in an equivalent position which also causes a change in the motion of the Al atom to which it is bonded to. This change in vibration can be explained with Hooke's law [3]. This change in motion, and the slight difference in small electronegativity between the two halides, results in a change in dipole. The C2v structure has 1 C2 symmetry axis and 2 σv symmetry axis, which results in 6 of the 18 vibrations being symmetrical and so there is no change in dipole moments, which is why there are only 12 peaks instead of 18 seen in C1. The D2h and C2h molecules are more symmetrical than the other two isomers, which is indicated by the fact that both only have 8 IR active vibrations out of the 18 vibrational modes. In both cases these molecules have a σh symmetry plane which is the reason for them being more symmetric.
| Mode of stretch in D2h | Description of mode | D2h frequency (cm-1) | C-1 frequency (cm-1) | C2h frequency (cm-1) | C2v frequency (cm-1) | explaination |
|---|---|---|---|---|---|---|
| 11 |  The Al atoms move in opposite directions, with the bridging atoms moving opposite to each other and perpendicular to the Al atoms. The result is that there is compression in bond length between the two atoms moving closer together, and stretching for the atoms moving apart. The terminal atoms are stationary. |
197 | 211 | 264 | 264 | The vibrational mode predominately involves the motion of the bridging atoms. As the D2h molecule has both the bromine atoms occupying the bridging positions, the frequency of this vibration is lower. The effective mass of the vibration is greater, which is inversely proportional to that frequency Hooke's law [3]. Following this, the 1 Br bridging C1 isomer has a frequency lower than that of the C2h and C2v isomers (which is the same), again due to that fact that Br atoms have a greater mass than that of Cl atom, although the frequency is higher than D2h as there is only 1 Br atom and the other is a Cl. |
| 12 (13 for C1) | The bridging atoms and one of the Al atoms move together, causing compression of the bonds between them, while the other Al atom moves away from the bridging atoms, elongating the bonds. The terminal group rock back and forth, so that when the Al atom they are bonded to moves towards the bridging atoms, they form a more bent structure, and the reverse, they are more linear there is also a small contraction when the terminal atoms move towards the Al atom. |
241 | 289 | 280 | 279 | The vibrational mode involves the stretching of bridging atoms and the bending of the terminal groups. As expected, due to large about of movement involving the bridging atoms, the D2h isomer has the lowest frequency due to having the greatest mass in the bridge. Next however is the isomers without bridging Br atoms, when the C1 isomer was expected. The consequence of having 2 Cl atoms in the bridging position is that the terminal atoms vibrate more than when Br was present. It could be that due to the terminal Br atoms vibrating more, and therefore having a greater contribution to the vibration is causing the frequency to be lower. For C1, both the bridging and the terminal Br atoms are relatively static in comparison to the Cl atoms, and therefore will cause the frequency to be higher as they have little contribution. |
| 13 (12 for C1) |  The Al atoms move in opposite directions so that they stretch or contract the bridging atom bonds equally. The terminal atoms move away from the Al atoms as they approach. |
247 | 257 | 308 | 309 | The vibration of the bridging atoms has the greatest contribution to the vibrational mode. This is exhibited by the fact that there is a decrease in the frequency of the vibration with the increase in bridging bromine atoms. The motion of the Br atoms in D2h in comparison to the isomers with no bridging Br atoms, is much bigger, and therefore contributing much more to the frequency. |
| 14 | The both aluminium atoms move together towards one of the bridging atoms, causing a contraction in bond length between the Al-Br bonds of one of the bridging atoms and stretching to the other. There is minimal movement from the terminal atoms |
341 | 384 | 413 | 413 | The motion of the Al atoms along the plane to which the bridging atoms sit causes stretching and contracting of the bridging bonds. The terminal atoms remain almost stationary. As such the more Br atoms bridging, the lower the frequency, which is seen in the frequencies recorded. |
| 15 | The Al atoms move in the same direction, towards a set of terminal atoms. The terminal atoms they are moving towards experience bond contractions to the Al they are bonded to and the other terminal atoms experience stretching. There is minimal movement from the bridging atoms. |
467 | 424 | 421 | 420 | This vibrational mode causes the greatest motion in the terminal atoms, therefore it can be stated that the isomers with higher numbers of bridging Br atoms will have higher frequencies as they contribute little to the vibrational mode. This can be seen with the D<2h, which has very little motion in the bridging atoms but much more for the terminal ones. The frequency of C1 is only 3 cm-1 larger than that of the 0 Br atom bridging isomers, which does agree with the rule that more Br bridging means much higher frequency in this case. With a bridging Cl atom and a terminal Br atom attached to it, one of the Al atoms is vibrating very fast, causing large changes to the bond lengths of the aforementioned atoms. This lends to there being a lot of motion in the terminal Br atom and as such causes a large contribution to the frequency, decreasing it. With the 0 bridging Br atoms, there 1 Br terminal atom attached to each Al and 2 bridging Cl atoms. As such the motion is not as extreme as seen in C1 so each Br atom does not contribute as much as the terminal atom on C1 however there are two of them and therefore cause a slightly greater contribution to the mode, as seen with their lower frequencies. |
| 16 |  The Al atoms move in opposite direction, with the terminal atoms bonded to them, moving towards the Al them are bonded to causing bond contraction but also bond stretching to the bridging atoms.. The bridging atoms are stationary. |
494 | 493 | 459 | 461 | The vibrational mode is primarily a motion involving the terminal atoms, which is why the D2h isomer has the highest frequency, as the terminal atoms are almost stationary. The C1 atom has a frequency that is almost identical to that of the 2 Br bridging isomer. The motion of the Al atoms is the opposite to that of mode 15, so the opposite effect occurs. The Al atom bonded to the terminal Br does not vibrate as much as the other Al. This results in very little motion on that side of the molecule, so the terminal Br is almost stationary and therefore barely contributing to the vibrational mode, like the D2h isomer. As both the 0 Br bridging isomers have 2 terminal Br, they cause a decrease in the frequency as they have a large contribution. |
| 17 |  The Al atoms move in opposite directions, so that there is a contraction in bond length with terminal atoms trans to each other, with the other trans atoms experiencing bond stretching. |
608 | 574 | 574 | 570 | This vibrational mode has stationary bridging groups, so there is no contribution from the bridging atoms on the frequency. As such the D2h isomer has the highest frequency. Similarly for mode 15, the C1 isomer has a frequency similar to that of the two 0 Br bridging isomers. The Al atom it is bonded to is vibrating lots, and therefore causing the Br molecule to move a lot. The contribution that the vibrations of this Br terminal atom is roughly equal to the vibrations of the terminal Br in the C2h and C2v isomers. |
| 18 | The Al atoms move symmetrically so that terminal atoms cis to each other experience bond contraction with the Al, while the bonds with the other cis pair stretched. The bridging atoms are stationary and the bond lengths associated with them do not change. |
616 | 614 | 579 | 582 | This vibration involves symmetrical motion of the Al, atoms, unlike motion in the opposite direct, therefore the C1 isomer has a very similar frequency to that of the D2h isomer. This time the motion of the Al atom bonded to the terminal Br is low, and as such, the Br is nearly stationary. This vibration involves the terminal atoms mainly and therefore, C2h and C2v isomers have a lower frequency than the other two. |
Please see my interesting observation section
Molecular orbital interactions in C2h
A population analysis of the lowest energy isomer (the C2h isomer) to determine the MO of the molecule.

| !Orbital number | Real MOs | LACO MO | Description of orbitals. |
|---|---|---|---|
| 37 |  |
 |
The symmetry of these orbitals is Bu. There is a strong bonding interaction between the S orbitals on the Al atoms and the terminal p orbitals of the terminal halides. The p orbitals of the bridging halides also strongly interact in a bonding manner with the s orbitals of the Al atoms. There is also possibility of a small through space bonding interaction with the p orbitals from the terminal halides. There is also a strong antibonding interaction between the two Al atoms as the two s orbitals are in opposite phases. The result is a large angular node dissecting the bridging halide atoms. There are 4 other angular nodes present. They are located one the terminal halides and are due to the shape and phase change of the p orbitals. There is large amount of delocalisation of orbitals due to the bonding interactions, as such it could be said that the electrons within the MO is delocalised, primarily between one of the Al atoms and the two bridging halides. |
| 40 |  |
 |
The symmetry of the orbital is Bu. There is a strong through space bonding interaction between the p orbitals of bridgng halides. There is also strong through space bonding interaction between the p orbitals of the bridging Cl and the p orbitals of the terminal halides. The terminal halides are in different phases so one terminal halide contributes to the phase above the plane at which the bridging atoms sit and the other terminal halide contributes to the phase below that plane. The strength of the terminal p to bridging p orbital bonding is not as strong as that of the two bridging p orbitals as they do not overlap as well.This results in a angular node that separates the phases above and below the plane. Due to the different phases of the terminal halides bonded to the same Al atom, then there is a through space antibonding interaction between these p orbitals. There is also an antibonding through space interaction between two terminal halides bonded to the same Al, however this is weak due to poor overlap of the orbitals. The contribution from Cl terminal atoms is greater than that of the terminal Br atoms. There are 4 angular nodes situated on the terminal halides due to the nature of p orbitals. Due to the highly bonding character of the orbitals above and below the plane of the bridging halide atoms, there is large amounts of delocalisation and therefore the electrons in this orbital primarily are situated there. |
| 43 |  |
 |
The symmetry of the orbital is Bu. There is a very strong bonding interaction between the p orbitals of the terminal halides and the s orbital of the Al atom they are bonded to. There is also a bonding through space interaction between these halides but it is slightly weaker. There is also a through space bonding interaction between the p orbitals of the bridging halides. This would be strong however there is a very large antibonding interaction between s orbitals on the Al atoms and the p orbitals on the bridging halid, as such the through space interaction is weak. The chlorine atoms contribute more to the bonding interactions as they are more electronegative and have better overlap with Al atoms. There are 8 angular nodes present. 6, 4 on the terminal halides and 2 on the bridging halides, are due to the phase change in the p orbitals. The other two nodes are between the Al atoms and the bridging atoms due to the antibonding interactions. There is delocalisation between the Al atoms and their terminal halides and a small amount between the two bridging haldies, therefore there is some delocalisation over two or three atoms however this is not as much as previous MO's |
| 49 |  |
 |
The symmetry of the orbitals is Bu There is small amount of through space bonding interaction between the p orbitals of the terminal halides as well as a small amount of through space antibonding interactions between the p orbital of a terminal halide and one of the bridging halides p orbitals. The weak interactions are due to poor overlap between the p orbitals. There is 6 angular nodes, all due to the phase change of the p orbitals on the halide atoms. There are no nodes for the antibonding interactions as they are too weak. There is negligible delocalisation in the molecule. |
| 55 |  |
 |
The symmetry of the orbitals is Ag. There is a bonding through space interaction between the s orbitals of the two Al atoms, as well as there being a through space bonding interaction between the p orbital on the bridging halides and the s orbital on the Al atoms. This p orbital sits perpendicular to the terminal halides and the antiphase orbital points into the molecule. As such there is a strong antibonding interaction between the antiphase lobe of the p orbital and the s orbitals of the Al atoms. This weakens the strength of the interaction between the s orbitals. There is also strong antibonding interactions between the terminal haldies and the s orbitals of the Al atoms, with the contribution greater for the Br p orbitals. As a result there is 2 radial nodes around the bridging Cl atoms and 8 angular nodes, 4 between the s orbital and the p orbital of the terminal halides and the 4 present in the p orbitals themselves. There is large delocalisation between the Al s orbitals and the μ-Cl p orbitals although this is decreased due to the antibonding interaction between the chlorine and Aluminium. This is the LUMO of the molecule. |
Interesting observations
During the IR comparison, I went in with an expectation for there to be a clear difference between the; 2 Br bridging, 1 Br bridging and 0 Br bridging, isomers however I was surprised to find that this was not the case. As notes above, C1 molecule, which has only 1 bridging Br, had frequencies that showed behaviour similar to that of either the D2h or the C2h and C2v isomers and then the reverse for the opposite stretch. The extra mass of the bromine caused either and increase in vibration (lower frequency) or a decrease in the vibration (high frequency) in the Al it was bonded to. I was expecting the atoms motion to behave in a manner that would place the frequency in the center of the two other groups of isomer. The assumption I internally made was that the force constant, and therefore the strength of the bond between Al-Cl and Al-Br were the same and as such would behave similarly, and that the only change with the frequency would be due to the change of the effective mass. This was clearly an incorrect assumption and that is why there is not a set magnitude of increase or decrease in the frequency with the rearrangement of isomers to give a 1 Br bridging molecule.
References
- ↑ 1.0 1.1 1.2 1.3 1.4 1.5 1.6 1.7 1.8 W.M.Haynes,""CPC handbook of Chemistry and Physics"", CRC press, 93rd edn, 2012
- ↑ P.Atkins, T.Overton, J.Rourke, M.Weller, F.Armstrong,Shriver & Atkins' Inorganic Chemistry, Oxford University Press, Oxford, 5th edn, 2010, p327
- ↑ 3.0 3.1 3.2 3.3 P.Atkins, J.De Paula, Atkins' Physical Chemistry, Oxford University Press, Oxford, 9th edn, 2010, p470