
Rep:Mod:SJN0612
Simon Julien Nizard, S.A. RIdPEF
Introduction
In this module we explore a widely used quantum-mechanical calculational method (namely: DFT/B3LYP - Density Functional Theory) and a set of basis sets to probe the structural and bonding porperties of a few select molecules. Computational methods are an important part of inorganic chemistry, in order to differentiate between stable conformers or predict the relative stability of complexes with different ligands, and how to influence this stability.
Calculations were carried out on BH3, TlBr3 and the cis- and trans- isomers of Mo(CO)4L2 to optimize the molecules to their ground-state conformationss, and then predict their infrared spectra. In the case of BH3, a molecular orbital analysis is also carried out and compared with qualitative MO theory predictions. All calculations were carried out by the Gaussian09W program either on the laptops or on the HP-SCAN machine in College. Viewing interface used: GaussView5.0
The second part of the module is a mini-project focusing on the [Ru(η2-C2H4)(PH3)4] complex and two derivatives: the η2-C2H2) (ethyne) derivative and the tetrafluoro-substituted derivative η2-C2F4). Molecular orbital analysis, natural bond analysis and an IR frequency analysis were carried out with the DFT/B3YLP to determine the relative stabilities of the molecules and the accuracy of the chosen calculation method, as well as gaining insight into the Dewar-Chatt-Duncanson model of alkene bonding to metal centres.
Moluclar Oribtal (MO) analysis of a simple unit: BH3
Optimisation
An initial BH3 molecule was drawn out in GaussView5.0 and optimised using the 3-21G basis set of the DFT/B3LYP calculation method. A summary of the job (processed by GaussianW09) is shown below. Optimization log file,
BH3opti
File Name = BH3optim
File Type = .log
Calculation Type = FOPT
Calculation Method = RB3LYP
Basis Set = 3-21G
Charge = 0
Spin = Singlet
E(RB3LYP) = -26.46226338 a.u.
RMS Gradient Norm = 0.00020672 a.u.
Imaginary Freq =
Dipole Moment = 0.0000 Debye
Point Group = D3H
Job cpu time:  0 days  0 hours  0 minutes 51.0 seconds.
       Item               Value     Threshold  Converged?
 Maximum Force            0.000413     0.000450     YES
 RMS     Force            0.000207     0.000300     YES
 Maximum Displacement     0.001605     0.001800     YES
 RMS     Displacement     0.000802     0.001200     YES
 Predicted change in Energy=-9.947211D-07
 Optimization completed.
    -- Stationary point found.

The 3-21G basis set determines the accuracy of the approximations used by the B3LYP method; it is one of low accuracy but as BH3 is a small symmetrical molecule, this isn't a major issue here. The optimization was carried out from an artificially set starting point, by lengthening the B-H bonds to 1.5 Å. The low RMS gradient norm (<0.001) indicates convergence towards a stationary point. In the summary, the molecule is assigned D3h symmetry, which is in accordance with Dr. Hunt's 2nd year lecture course notes. A graph depicting the RMS (Root Mean Square) at each step of optimization undertaken in the calculation on the left shows us the energy gradient approaching zero as the calculations move down the PES (potential energy surface) of BH3 towards the global minimum.
Below is a part of the output file detailing optimized parameters for the molecule: B-H bond length is 1.19Å, [lit[1] 1.1867Å] and ideal H-B-H bond angles are 120°.
                          ----------------------------
                           !   Optimized Parameters   !
                           ! (Angstroms and Degrees)  !
 --------------------------                            --------------------------
 ! Name  Definition              Value          Derivative Info.                !
 --------------------------------------------------------------------------------
 ! R1    R(1,2)                  1.1935         -DE/DX =    0.0004              !
 ! R2    R(1,3)                  1.1935         -DE/DX =    0.0004              !
 ! R3    R(1,4)                  1.1935         -DE/DX =    0.0004              !
 ! A1    A(2,1,3)              120.0            -DE/DX =    0.0                 !
 ! A2    A(2,1,4)              120.0            -DE/DX =    0.0                 !
 ! A3    A(3,1,4)              120.0            -DE/DX =    0.0                 !
 ! D1    D(2,1,4,3)            180.0            -DE/DX =    0.0                 !
 --------------------------------------------------------------------------------
Frequency Calculations
The purpose of carrying out a vibrational analysis of the molecule, beyond determining the different stretching modes of BH3 and their frequencies, is to determine the second derivative of the PES slope, and thereby ascertain if our stationary point (the optimized molecule) is indeed an energy minimum or an unstable transition state (maxima also have slope 0). If all the frequencies are positive, we have found a minimum, as we have in this case (see spectrum and table). vibrational calculation output file
| Vibrational mode | Stretching frequency: calculated, [lit.[1]] cm-1, % error | Intensity | Vibrational Description (click to view) |
|---|---|---|---|
| A2`` | 1144 [1147] 0.26% | 93 | Wagging out of the molecule's plane |
| E` | 1203 [1197] 0.50% | 12 | In-plane rocking |
| E` | 1203 [1197] 0.50% | 12 | In-plane scissoring |
| A1` | 2598 [2502] 3.70% | 0.0 | Totally in plane symmetric stretch |
| E` | 2737 [2602] 4.93% | 104 | Asymmetric in-plane stretching |
| E` | 2737 [2602] 4.93% | 104 | Asymmetric in-plane stretching |

File Name = myname_bh3_freak
File Type = .log
Calculation Type = FREQ
Calculation Method = RB3LYP
Basis Set = 3-21G
Charge = 0
Spin = Singlet
E(RB3LYP) = -26.46226338 a.u.
RMS Gradient Norm = 0.00020662 a.u.
Imaginary Freq = 0
Dipole Moment = 0.0000 Debye
Point Group = C3H
Job cpu time:  0 days  0 hours  0 minutes 36.0 seconds.
Of the 6 vibrations in the table above, only 5 appear on the spectrum, 4 of which are doubly degenerate (resulting in three apparent peaks). The totally symmetric A1` stretch does not result in a change of dipole moment (hence no peak). The most intense peaks involves a greater change in dipole for the molecule, as characterised by the snapshots of the vibrational modes. As expected, a percentage of error exists at higher frequencies, due to the low accuracy of the method employed (B3LYP - 3-21G).
Molecular (MO) Orbital Analysis
The MO diagram of BH3 was constructed using LCAO qualitative theory and compared to the calculated MO diagram, computed from the optimized BH3 molecule on the High-Powered SuperComputer At Night (HPC or SCAN thereafter). As a comparison, the computed MOs are compared to those predicted by LCAO theory. On the schematic diagram, an extra orbital is present at the bottom, with far lower energy than all the others, with the little red box next to it. This is the 1a1` orbital around the boron and was deemed too low in energy to be included in the LCAO MO diagram, as it doesn't interact with the hydrogen FOs. The energies of each orbital are shown on this diagram:


The LCAO derived diagram was based on the approach used here, by which fragment orbitals of chemical fragments and their symmetries are determined from point group tables. The FOs of same symmetry are then arranged on the left and the right of the diagram, ordered in energy according to their respective electronegativities (here, B and H are therefore similar in energy), and those of same symmetry are combined in the middle, splitting into bonding and anti-bonding pairs. The ordering in energy of the new MOs is relatively easy based on the extrapolation of relative anti-bonding and bonding overlaps in the predicted orbital. The only two that are difficult to order are the 3a1` and degenerate 2e` orbitals, whose relatives energies cannot be evaluated from deduction alone.
This is where the computed MOs can help us, providing a visual and calculated result (DFT/B3LYP, basis set 3-21G, full NBO/population calculation). As we can see, the predicted MOs up to 3a1` fit nicely with predicted orbital shapes, which allows us to consider the chemistry of the HOMO and LUMO without worrying about error (the empty non-bonding LUMO 1a2`` is the reason why BH3 is a Lewis acid). In the case of the higher LUMOs, their shape becomes more diffuse and less like that predicted by theory, which points to the limits of LCAO theory in qualitatively determining molecular orbital interactions. Output file can be found here.
Natural Bond Order (NBO) analysis of BH3


NBO analysis allows us to investigate the charge distribution around the molecule, to see which atoms are electron rich and which ones are electron deficient. It also allows us to see the electronic contribution of each atom to the bonding in the molecule, i.e. the s and p orbital contributions to each bond. Below is an excerpt from the optimization output file, and right are GaussView representations of those results.
 (Occupancy)   Bond orbital/ Coefficients/ Hybrids
 ---------------------------------------------------------------------------------
     1. (1.99853) BD ( 1) B   1 - H   2
                ( 44.48%)   0.6669* B   1 s( 33.33%)p 2.00( 66.67%)
                                            0.0000  0.5774  0.0000  0.0000  0.0000
                                            0.8165  0.0000  0.0000  0.0000
                ( 55.52%)   0.7451* H   2 s(100.00%)
                                            1.0000  0.0000
     2. (1.99853) BD ( 1) B   1 - H   3
                ( 44.48%)   0.6669* B   1 s( 33.33%)p 2.00( 66.67%)
                                            0.0000  0.5774  0.0000  0.7071  0.0000
                                           -0.4082  0.0000  0.0000  0.0000
                ( 55.52%)   0.7451* H   3 s(100.00%)
                                            1.0000  0.0000
     3. (1.99853) BD ( 1) B   1 - H   4
                ( 44.48%)   0.6669* B   1 s( 33.33%)p 2.00( 66.67%)
                                            0.0000  0.5774  0.0000 -0.7071  0.0000
                                           -0.4082  0.0000  0.0000  0.0000
                ( 55.52%)   0.7451* H   4 s(100.00%)
                                            1.0000  0.0000
     4. (1.99903) CR ( 1) B   1           s(100.00%)
                                            1.0000  0.0000  0.0000  0.0000  0.0000
                                            0.0000  0.0000  0.0000  0.0000
     5. (0.00000) LP*( 1) B   1           s(100.00%)
It is interesting to note that while the analysis correctly calculates sp2 bonds at the boron atom for the first three NBOs (33.33% s character and 66.67% p character), it predicts a fourth NBO that is solely on the boron atom to be 100% s character, when in fact this should be LUMO (vacant p orbital) as shown in the diagram above.
The B-H bonds are characterized as having 54.6% contribution from Hydrogen, and 45.4% from Boron, which fits the charge distribution observations in the pictures above: the electron density is slightly towards the H-atoms.
Thallium Tribromide TlBr3 analysis
Optimization and Frequency Analysis
An initial TlBr3 molecule was drawn out in GaussView5.0 and optimised using the 3-21G basis set of the DFT/B3LYP calculation method. This loosely optimized output was then optimized again using the LanL2DZ (DZ stands for double zeta and provides a much more accurate calculation for taking into account pseudo-potentials and relativistic effects on large atoms). This was then processed as a vibrational analysis to check that a global minimum had been found. The two calculations must be carried out using the same basis set/method in order to carry out a quantitative vibrational analysis. A summary of the job (processed by GaussianW09) is shown below. Vibrational output log file and 2nd opt. file Molecule:
TlBr3optim
File Name = TLBR3OPTIMIZ
File Type = .log
Calculation Type = FOPT
Calculation Method = RB3LYP
Basis Set = LANL2DZ
Charge = 0
Spin = Singlet
E(RB3LYP) = -91.21812851 a.u.
RMS Gradient Norm = 0.00000090 a.u.
Imaginary Freq =
Dipole Moment = 0.0000 Debye
Point Group = D3H
Job cpu time:  0 days  0 hours  0 minutes 32.0 seconds.
TlBr3FREQ
File Name = TLBR3FREQ
File Type = .log
Calculation Type = FREQ
Calculation Method = RB3LYP
Basis Set = LANL2DZ
Charge = 0
Spin = Singlet
E(RB3LYP) = -91.21812851 a.u.
RMS Gradient Norm = 0.00000088 a.u.
Imaginary Freq = 0
Dipole Moment = 0.0000 Debye
Point Group = D3H
Job cpu time:  0 days  0 hours  0 minutes 26.0 seconds.
Bond lengths calculated were 2.65 Å and angles 120.0°, which is in accordance with the literature[2] [2.55 Å and 120.0°]. A table summarizes the different stretching modes calculated:

| Vibrational mode | Stretching frequency: calculated, [lit.[2]] cm-1, % error | Intensity | Vibrational Description (click to view) |
|---|---|---|---|
| E` | 46 [46] 0.0% | 4 | In-plane rocking |
| E` | 46 [46] 0.0% | 4 | In-plane scissoring |
| A2`` | 52 [63] 17.5% | 6 | Wagging out of the molecule's plane |
| A1` | 165 [180] 8.33% | 0.0 | Totally in plane symmetric stretch |
| E` | 211 [219] 3.65% | 25 | Asymmetric in-plane stretching |
| E` | 211 [219] 3.65% | 25 | Asymmetric in-plane stretching |
Of the 6 vibrations in the table above, only 5 appear on the spectrum, 4 of which are doubly degenerate (resulting in three apparent peaks). The totally symmetric A1` stretch does not result in a change of dipole moment (hence no peak). The most intense peaks involves a greater change in dipole for the molecule, as characterised by the snapshots of the vibrational modes. This time around, the frequencies are quite low, and the lowest normal modes of vibration are the degenerate E` in plane rocking/scissoring modes.
Bonds: definition
A chemical bond is the resultant attractive interaction between atoms. It is modeled as a region of electron density which is shared by the two valence-electron shells. As such, Gaussview sometimes fails (or omits) to show the actual "lines" between atoms, since it is constrained to an internal list of bond data when deciding whether a bond exists in the complex. One mustn't forget that the attractive interaction is probably still present. There are many type of bonds: between electrons on nuclei, electron-electron, or dipole/dipole. These translate into covalent, ionic or metallic bonds.
cis- and trans-isomers of Mo(CO)4(PCl3)2
One way of distinguishing the two isomers of the above-mentioned molybdenum is through IR spectroscopy. The C=O stretching region should exhibit one single peak in the case of the trans- isomer, while that of the cis- isomer would exhibit 4 stretching bands. We shall use a pseudo-potential-corrected basis set of calculations (DFT) to determine the IR spectrum of these compounds computationally, as well as compare the geometries and relative stabilities of the two complexes.
Optimization and geometrical/energy comparisons
Originally Mo(CO)4(PPh3)2, the triphenylphosphine ligands would be too demanding computationally, on account of the large number of atoms/electrons. Instead, we substitute them with trichlorophosphine ligands, which provide a reasonably equivalent model in terms of sterics. To start with, both molecules were optimized using a loose convergence and minimal basis set (LanL2MB), so as to avoid a local minimum; the logs of which can be found here (cis) and here (trans)
cis_isomer_optim1
File Name = cis_isomer_optim1
File Type = .log
Calculation Type = FOPT
Calculation Method = RB3LYP
Basis Set = LANL2MB
Charge = 0
Spin = Singlet
E(RB3LYP) = -617.52501012 a.u.
RMS Gradient Norm = 0.00028595 a.u.
Imaginary Freq =
Dipole Moment = 8.4926 Debye
Point Group = C1
Job cpu time:  0 days  0 hours 10 minutes 42.8 seconds.
trans_isomer_Mo
File Name = trans_isomer_optim1
File Type = .log
Calculation Type = FOPT
Calculation Method = RB3LYP
Basis Set = LANL2MB
Charge = 0
Spin = Singlet
E(RB3LYP) = -617.52204988 a.u.
RMS Gradient Norm = 0.00006174 a.u.
Imaginary Freq =
Dipole Moment = 0.0000 Debye
Point Group = C1
Job cpu time:  0 days  0 hours  7 minutes 27.8 seconds.
The relative energy difference is 7.77 kj.mol-1, with the cis-isomer being slightly lower in energy, which is smaller than the typical energy error in these calculations (~10 kj.mol-1). This doesn't help us to compare the two isomers' relative stabilities. These molecules were then adjusted in GaussView according to Dr Hunt's specifications, and optimized with the more powerful LanL2DZ basis set, which can account for relativistic effects and pseudo-potentials on larger atoms (like transition metals). Summaries can be found below, and output logs here (cis) and here (trans).
cis_isomer_optim2
File Name = cis_isomer_optim2
File Type = .log
Calculation Type = FOPT
Calculation Method = RB3LYP
Basis Set = LANL2DZ
Charge = 0
Spin = Singlet
E(RB3LYP) = -623.57707194 a.u.
RMS Gradient Norm = 0.00000577 a.u.
Imaginary Freq =
Dipole Moment = 1.3101 Debye
Point Group = C1
Job cpu time:  0 days  8 hours 10 minutes 12.6 seconds.
trans_isomer_optim2
File Name = trans_isomer_optim2
File Type = .log
Calculation Type = FOPT
Calculation Method = RB3LYP
Basis Set = LANL2DZ
Charge = 0
Spin = Singlet
E(RB3LYP) = -623.57603103 a.u.
RMS Gradient Norm = 0.00002957 a.u.
Imaginary Freq =
Dipole Moment = 0.3049 Debye
Point Group = C1
Job cpu time:  0 days  7 hours 48 minutes 38.6 seconds.
Now the relative energy difference is 2.73 kj.mol-1, with the cis-isomer being slightly lower in energy, which is still smaller than the typical energy error in these calculations (~10 kj.mol-1). Thus, purely looking at the calculated energy differences is not sufficient to determine which isomer would be most stable at room temperature. To enhance the accuracy of this energy measurement, we can modify the input file to account for phosphorus' hypervalency (adding d orbitals to the basis set). Now the energies are reversed, and the trans-isomer is slightly lower in energy by 3.27 kj.mol-1.cis-isomer adulterated and trans-isomer adulterated.
cis_isomer_optim2
File Name = cis_isomer_optim2dAO
File Type = .log
Calculation Type = FOPT
Calculation Method = RB3LYP
Basis Set = Gen
Charge = 0
Spin = Singlet
E(RB3LYP) = -623.69291231 a.u.
RMS Gradient Norm = 0.00000945 a.u.
Imaginary Freq =
Dipole Moment = 0.0758 Debye
Point Group = C1
Job cpu time:  0 days  1 hours 12 minutes 23.7 seconds.
trans_isomer_optim2
File Name = trans_isomer_optim2dAO
File Type = .log
Calculation Type = FOPT
Calculation Method = RB3LYP
Basis Set = Gen
Charge = 0
Spin = Singlet
E(RB3LYP) = -623.69415608 a.u.
RMS Gradient Norm = 0.00001226 a.u.
Imaginary Freq =
Dipole Moment = 0.2299 Debye
Point Group = C1
Job cpu time:  0 days  1 hours  1 minutes 11.4 seconds.
The geometries computed both indicate C1, which is a surprising result: according to this flow-chart from Dr. hunt's website, the trans-isomer should have a C2h symmetry. This can perhaps be explained by the strain of the bulky PCl3 groups which are in an eclipsed formation, causing strain. In terms of bond-lengths, the table below summarizes the values computed for each isomer. Note that literature values correspond to Mo(CO)4(PPh3)2 X-ray crystallography results.
| Compound | Mo-P [lit[3] values in italics] | Mo-C | C-O | P-Cl |
|---|---|---|---|---|
| cis-Mo(CO)4(PCl3)2 | 2.52 Å [2.58] | 2.11 Å and 2.06 Å [2.05, 1.97] | 1.19 Å[a] [1.15] | 2.41 Å [1.19] |
| trans-Mo(CO)4(PCl3)2 | 2.48 Å | 2.11 Å | 1.19 Å | 2.40 Å |
[a] although the C=O bond lengths are different in length to three decimal places, this is not within the accepted error margin. [b] lit. values for P-Ph bonds.
As can be seen, the computed bond lengths for all bond types (save P-Cl) fit nicely with the experimental data, leading us to believe that the substitution of PPh3 with Cl3 is a good-enough approximation to carry out our IR analysis.
Vibrational analysis of molybdenum isomers
The vibrational analyses of the two isomers were carried out on the HPC using DFT/B3LYP LanL2DZ, with ultrafine convergence parameters added. The lowest frequencies correspond to low-energy rocking of the molecule due to the heavy substituents. These rotations are expected to happen at room temperature, where the surrounding thermal energy is much higher than them; this would of course lead to a breakdown of symmetry. Tabulated below are these low frequency vibrations and the full Ir spectra of the two complexes. cis-isomer log file and trans-isomer log file.

| Frequency (cm-1) | cis-isomer animation | Frequency (cm-1) | trans-isomer animation |
|---|---|---|---|
| 11 | .gif) |
5 | |
| 18 | .gif) |
6 |
The carbonyl stretch region
Upon investigation of the carbonyl stretching region, we can observe 4 peaks for the cis- isomer, and 1 for fort the trans-isomer. This is due to the degeneracy and non-dipole-changing of the vibrations in the trans-isomer, thanks to its higher symmetry.

| Vibrational Mode (click to view) | Calculated Freq. (cm-1) [Lit.] | Intensity |
|---|---|---|
| cis- asymmetric stretch | 1945 | 763 |
| trans-asymmetric stretch | 1949 | 1498 |
| cis/trans symmetric stretch | 1958 | 632 |
| fully symmetric stretch | 2023 | 598 |
| Vibrational Mode (click to view) | Calculated Freq. (cm-1) [Lit.[4]] | Intensity |
|---|---|---|
| trans-asymmetric stretch | 1950-51 [1891] | 1475-1467 |

The two trans-asymmetrical stretches for the trans-isomer are slightly different in frequency, which could be attributed (as in the low-energy vibrations case) to Gaussian not allowing free rotation about the Mo-P bonds, giving a certain steric hindrance on one trans-C=O pair.
In the case of the cis-isomer, the C=O bonds located trans- to PCl3 groups are longer on average: this would imply that the trans effect is pulling electron density away from the π bonding orbital of the C=O, thereby weakening it. This is supported by the charge density computed on the right. The trans-to-PCl3 carbon atoms have a lower charge than the others.
Mini Project: Investigation of trigonal-bipyramidal η2-π-complexes of Ruthenium
Introduction

The Dewar-Chatt-Duncanson model of is a model that rationalizes pi-bonding interactions between an alkene complex and a metal centre in organometallic complexes. The π-orbital from the alkene donates electron density into a metallic d-orbital. At the same time, another filled d-orbital is back-donating electrons into the π* orbital of the alkene (see diagram right). This leads to an overall reduction in the carbon-carbon bond order, and thus should translate into longer C-C bonds and lower IR frequencies than for pure alkenes.
This leads to a general "rehybridization" from sp2 to sp3 for the carbon atoms as the hydrogen atoms on the alkene twist backwards away from the metal,breaking the planar geometry of the ligand[5].
Project Outline
We shall carry out in silico optimization, frequency and MO/NBO calculations on three trigonal-bipyramidal complexes of [(η2-C2L2-4)Ru(PH3)4] where L = H2, H4 and F4. Note that in the case of L = H2, the ligand is an ethyne C2H2 fragment. The natural bond order analysis should help us ascertain the extent of contribution to the Ru-C bonds, as well as providing a charge density analysis to rationalize various electronic effects in the molecule. In addition, it should help us determine how much of the Ru-C bond is contributed by forward pi-donation, and how much is contributed by pi*-backbonding, which we can then compare to literature calculations. The MO diagrams should help as a visual, qualitative indication of electron density in the ligand-metal bonds. Finally, a vibrational frequency analysis should a) confirm we have optimized the molecules to their minima and b) provide valuable information about the relative C=C bond strength and the effect of electron-withdrawing groups (fluorines) on the bonding interactions. Optimization of two isomers of [(η2-C2H4)Ru(PH3)4], where the ethylene ligand is either axial or equatorial, will determine which one is more stable.
Optimizations
Below are summaries of the optimizations carried out. The basis set used was 6-311G for carbon, fluorine and hydrogen atoms, and LanL2DZ pseudo-potential for ruthenium and phosphorus atoms; int=ultrafine, scf=conver=9. Note that the first optimization of the fluorosubstituted complex failed, as did both optimizations of the ethyne-ligand complex (the latter was not successfully optimized, as we shall see in the IR analysis). It is noted that the optimization of the axial-ethene complex yielded the equatorial-ethene complex back, meaning that the equatorial isomer is the more stable one. For the ethyne complex, an error log is also shown. Optim. Log files: ethene (equatorial) ethene (axial) ethyne Tetrafluoroethene
Optim1_PH3_ethene(equatorial)
File Name = Optim1_PH3
File Type = .log
Calculation Type = FOPT
Calculation Method = RB3LYP
Basis Set = Gen
Charge = 0
Spin = Singlet
E(RB3LYP) = -205.72684877 a.u.
RMS Gradient Norm = 0.00000189 a.u.
Imaginary Freq =
Dipole Moment = 2.4204 Debye
Point Group = C1
Job cpu time:  0 days  5 hours
30 minutes  3.3 seconds.
Optim1_PH3_ethene(axial)
File Name = Optim1_PH3_AXIAL
File Type = .log
Calculation Type = FOPT
Calculation Method = RB3LYP
Basis Set = Gen
Charge = 0
Spin = Singlet
E(RB3LYP) = -205.72684877 a.u.
RMS Gradient Norm = 0.00000251 a.u.
Imaginary Freq =
Dipole Moment = 2.4199 Debye
Point Group = C1
Job cpu time:  0 days  6 hours
13 minutes 15.3 seconds.
Optim2_PH3_tetrafluoroethene
File Name = log_50686
File Type = .log
Calculation Type = FOPT
Calculation Method = RB3LYP
Basis Set = Gen
Charge = 0
Spin = Singlet
E(RB3LYP) = -602.79897335 a.u.
RMS Gradient Norm = 0.00000123 a.u.
Imaginary Freq =
Dipole Moment = 7.1343 Debye
Point Group = C1
Job cpu time:  0 days  4 hours
34 minutes 55.4 seconds.
File Name = Optim1_PH3Ethyne
File Type = .log
Calculation Type = FOPT
Calculation Method =
Basis Set =
Charge = 0
Spin = Singlet
E(RB3LYP) = -204.32904233 a.u.
RMS Gradient Norm = 0.02702602 a.u.
Imaginary Freq =
Dipole Moment = 2.8850 Debye
Point Group = C1


 NTrRot=    -1 NTRed=   135 NAtoms=    21 NSkip=    78 IsLin=F
 Error in internal coordinate system.
 Error termination via Lnk1e in /apps/gaussian/g09_b01/g09/l103.exe at Fri Dec  2 17:49:49 2011.
 Job cpu time:  0 days  0 hours 18 minutes  9.9 seconds.
 File lengths (MBytes):  RWF=     21 Int=      0 D2E=      0 Chk=      3 Scr=      1
Vibrational analysis and comparison
Frequency calculations were carried out on the optimized molecules and the frequencies corresponding to the C=C and Ru-C stretches for each complex are tabulated below. Note that due to optimization failure in the case of the ethyne-ligand complex, some of its vibrations calculated negative frequencies, which indicates that the molecule was at an unstable maximum. A short calculation was carried out on ethene for comparative purposes: 1.33 Å C=C length, C=C stretch 1688 cm-1. Vibrational calculations: Ethene Vib. analysis, Ethyne Vib. analysis, tetrafluoroethene Vib. analysis.
Broad stretching patterns (cm-1): P-H 2200-2500, C-H 3000-3200, C-F 1060-1070, Ru-P 240-350
.png)


| Complex | Frequency (cm-1) | Intensity | Bond lengths (Å) |
|---|---|---|---|
| [(η2-C2H4)Ru(PH3)4] | 1143 | 11 | 1.45 |
| [(η2-C2F4)Ru(PH3)4] | 1360 | 169 | 1.47 |
| [(η2-C2H2)Ru(PH3)4] | 1950 | 124 | 1.22 |
| Complex | Frequency (cm-1) | Intensity | Bond lengths (Å) |
|---|---|---|---|
| [(η2-C2H4)Ru(PH3)4] | 518, 418 | 11 | 2.18 |
| [(η2-C2F4)Ru(PH3)4] | 778, 590 | 169 | 2.06 |
| [(η2-C2H2)Ru(PH3)4] | 659 | 124 | 2.02 |
Despite poor optimization, the ethyne-complex showed some signs of bond weakening (1950 cm-1 compared tp 2042 calculated in free ethyne).
Although the ethyne results are very inconclusive, a comparison of the fluoroethene and ethene ligands, and benchmarking with a lone ethene molecule allows us to draw a few conclusions. First off, the C-C bonds in the complexes are longer than the free ethene molecule by 14 and 12 pm respectively, as well as exhibiting smaller stretching frequencies. this implies a weaker bond which has lost electron density and become more diffuse. The C=C bond for C2F4 is slightly longer but higher in energy. This could be due to the four highly negative fluorine ligands being larger than hydrogen substituents and causing the bond to elongate.
In addition, the Ru-C bonds in tetrafluoroethene-complex are shorter and higher in energy than those for the ethene-complex. This would seem to imply there is a stronger interaction with the pi-ligand in the former, probably due to the electron-withdrawing nature of fluorine causing the carbons to be electron deficient, and thus interacting more strongly with the electron rich Ruthenium centre. More on this later.
NBO and charge density analysis
Shown below are charge densities on the first two molecules (ethene + tetrafluoroethene). Red means electron-rich, green equates with electron-deficient. Calculations can be found here (eth) and here (flu).
| [(η2-C2H4)Ru(PH3)4] | [(η2-C2F4)Ru(PH3)4] | [(η2-C2H2)Ru(PH3)4] |
|---|---|---|
 |
 |
 |
As can be seen, the EWG fluorine atoms affect the charge of the carbons significantly, making them electron-deficient and thus causing them to interact more strongly with the electron-rich ruthenium centre. In contrast, the ethene-ligand is slightly electron rich. On can guess that backbonding occurs in both cases, but the fluorine atoms pull electron density away from the pi-system in the case of tetrafluoroethene.
NBO analysis results of the Ru-C bonds in ethene-ligand:
5. (1.70548) BD ( 1)Ru   1 - C  18
                ( 41.92%)   0.6474*Ru   1 s( 15.18%)p 2.59( 39.33%)d 3.00( 45.48%)
                                            0.0010 -0.3896 -0.0056  0.0000 -0.0001
                                            0.0000 -0.0008  0.3675  0.0000 -0.0001
                                           -0.5082 -0.0030  0.0001  0.0000 -0.0001
                                            0.0000  0.6048  0.0060  0.1934 -0.0032
                                           -0.2262  0.0189
                ( 58.08%)   0.7621* C  18 s( 15.63%)p 5.40( 84.35%)d 0.00(  0.02%)
                                           -0.0004 -0.3954 -0.0019 -0.0004  0.0001
                                            0.0000  0.0000  0.0640  0.0214  0.0018
                                            0.9152 -0.0359 -0.0035  0.0000  0.0000
                                            0.0075  0.0031 -0.0112
     6. (1.70548) BD ( 1)Ru   1 - C  21
                ( 41.92%)   0.6474*Ru   1 s( 15.18%)p 2.59( 39.34%)d 3.00( 45.48%)
                                           -0.0010  0.3896  0.0056  0.0000  0.0001
                                            0.0000 -0.0008  0.3660  0.0000  0.0001
                                            0.5093  0.0030  0.0001  0.0000  0.0001
                                            0.0000  0.6042  0.0061 -0.1917  0.0032
                                            0.2292 -0.0189
                ( 58.08%)   0.7621* C  21 s( 15.63%)p 5.40( 84.35%)d 0.00(  0.02%)
                                            0.0004  0.3954  0.0019  0.0004 -0.0001
                                            0.0000  0.0000  0.0667  0.0213  0.0017
                                           -0.9150  0.0360  0.0035  0.0000  0.0000
                                            0.0074 -0.0030  0.0113
NBO analysis results of the Ru-C bonds in fluoroethene-ligand:
5. (1.77252) BD ( 1)Ru   1 - C  18
                ( 39.84%)   0.6312*Ru   1 s( 15.96%)p 2.28( 36.42%)d 2.98( 47.62%)
                                           -0.0021  0.3995  0.0045  0.0011 -0.4791
                                           -0.0352  0.0000  0.0000  0.0000  0.0001
                                           -0.3651 -0.0080  0.0000  0.0000  0.6047
                                            0.0039  0.0000  0.0000  0.3265 -0.0210
                                            0.0583  0.0100
                ( 60.16%)   0.7756* C  18 s( 28.60%)p 2.49( 71.36%)d 0.00(  0.04%)
                                           -0.0002  0.5341 -0.0284  0.0015  0.8359
                                           -0.0258  0.0075  0.0000  0.0000  0.0000
                                           -0.1166 -0.0214  0.0047  0.0000  0.0074
                                            0.0000  0.0191 -0.0002
     6. (1.77165) BD ( 1)Ru   1 - C  19
                ( 39.72%)   0.6302*Ru   1 s( 15.75%)p 2.34( 36.88%)d 3.01( 47.36%)
                                            0.0021 -0.3969 -0.0053 -0.0010  0.4794
                                            0.0316  0.0000  0.0000  0.0000  0.0004
                                           -0.3714 -0.0111  0.0000  0.0000  0.6024
                                            0.0084  0.0000  0.0000 -0.3254  0.0173
                                           -0.0668 -0.0087
                ( 60.28%)   0.7764* C  19 s( 28.88%)p 2.46( 71.08%)d 0.00(  0.04%)
                                            0.0002 -0.5365  0.0301 -0.0015 -0.8356
                                            0.0250 -0.0076  0.0000  0.0000  0.0000
                                           -0.1067 -0.0208  0.0048  0.0000  0.0074
                                            0.0000 -0.0194 -0.0001
NBO analysis results of the C-C bond in ethene-ligand:
21. (1.98202) BD ( 1) C  18 - C  21
                ( 50.00%)   0.7071* C  18 s( 31.75%)p 2.15( 68.20%)d 0.00(  0.05%)
                                           -0.0003  0.5633  0.0124  0.0004  0.0000
                                            0.0000  0.0000  0.8025  0.0282  0.0003
                                            0.1882  0.0424  0.0007  0.0000  0.0000
                                            0.0051 -0.0197 -0.0088
                ( 50.00%)   0.7071* C  21 s( 31.75%)p 2.15( 68.20%)d 0.00(  0.05%)
                                           -0.0003  0.5633  0.0124  0.0004  0.0000
                                            0.0000  0.0000 -0.8031 -0.0283 -0.0003
                                            0.1858  0.0423  0.0007  0.0000  0.0000
                                           -0.0050 -0.0197 -0.0088
NBO analysis results of the C-C bond in fluoroethene-ligand:
 19. (1.97361) BD ( 1) C  18 - C  19
                ( 49.95%)   0.7068* C  18 s( 30.04%)p 2.33( 69.87%)d 0.00(  0.09%)
                                           -0.0010  0.5481 -0.0007  0.0008 -0.2394
                                           -0.0292 -0.0052 -0.0001  0.0000  0.0000
                                            0.8003  0.0026  0.0050  0.0000 -0.0162
                                            0.0000  0.0075  0.0246
                ( 50.05%)   0.7074* C  19 s( 30.01%)p 2.33( 69.89%)d 0.00(  0.09%)
                                           -0.0010  0.5478 -0.0004  0.0009 -0.2508
                                           -0.0286 -0.0054  0.0001  0.0000  0.0000
                                           -0.7970 -0.0032 -0.0048  0.0000  0.0167
                                            0.0000  0.0077  0.0242
Although the effect of the fluorine substituents is small, it is noticeable in that it pulls some electronic contribution onto the carbon atoms in Ru-C bonds. It also hybridizes the carbon atoms towards sp3 more in comparison with ethene-ligand. Surprisingly, Gaussian doesn't point to significant d-orbital contribution from the Ruthenium, which may be due to the basis set (pseudo potential) employed.
MO analysis
| Molecular Orbital | [(η2-C2H4)Ru(PH3)4] | [(η2-C2F4)Ru(PH3)4] |
| LUMO |  |

|
| HOMO |  |

|
| HOMO-1 |  |

|
| HOMO-2 |  |

|
| HOMO-3 |  |

|
| HOMO-4 |  |

|
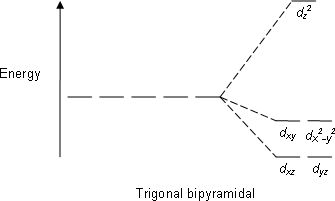
As we can see, the MOs are hardly predictable by simple LCAO theory. By considering the classical splitting pattern for trigonal-pyramidal, we shall rationalize why the LUMO, HOMO though to HOMO-4 look as they do in our molecules, and key differences affecting them. The LUMO is the same in both molecules, and represents the dz2 Ru orbital interacting with some Phosphorus anti-bonding orbitals. The HOMO is a strange orbital that mixes the dx2-y2 and a higher π-bonding orbital from the ethene/fluoroethene ligand. However, the interaction is a curious "delta" interaction. From the visual representation of the orbital, the fluorine substituents inhibit some of the electron density where the mixing occurs.
Below the HOMO, things get more complicated: both molecules have the same orbitals, but they aren't ordered in the same way in terms of energy. The HOMO-1 in the ethene-ligand complex corresponds to the HOMO-3 in the tetrafluoroethene complex. These represent the backdonation from the dxy orbital into the π* antibonding orbital of the ethene bond. Again, the electron density on fluorine inhibits that on the ethene bond, which is in stark contrast to the large lobes in the HOMO-1 for C2H4.
The HOMO-2 and HOMO-3 correspond to the HOMO-1 and HOMO-4 respectively on each molecule, and in turn correspond to dxz and dyz orbitals. These are non-bonding and do not interact with any others significantly.
The HOMO-4 in C2H4-ligand complex corresponds to the HOMO-2 in tetrafluoroethene-ligand, and they represent forward π-donation in to dx2-y2 orbital, which is represented schematically in the diagram at the beginning of this section. Once again, the fluorines have inhibited this orbital mixing as can be seen from the picture.
The comparison of energies of the HOMO-1 and the HOMO-4 (for ethene-ligand) is -0.172 and -0.244 respectively, meaning that pi-donation is a larger contribution to the bond than back-donation. This trend is in accordance with the literature, but not with the values in said literature (75:25 ratio)[6]. In the case of the fluoroethene ligand, this ratio is much closer to 50-50%, with the backbonding having a greater contribution to the total energy of the combined orbitals. This is no-doubt due to fluorine substituents a) hinder pi-donation b) pull more electrons from the Ruthenium centre.
References
- ↑ 1.0 1.1 M. S. Schuurman, W. D. Allen, H. F. Schaeffer, Journal of Computational Chemistry, 2005,26, 1106 DOI:10.1002/jcc.20238
- ↑ 2.0 2.1 M. Atanasov, D. Reinen, J. Phys. Chem. A, 2001, 105, 5467 DOI:10.1021/jp004511j
- ↑ F. A. Cotton, D. J. Darensbourg, S. Klein, B. W. S. Kolthammer, Inorg. Chem., 1982, 21, 299 DOI:10.1021/ic00131a055
- ↑ G. Hogarth, T. Norman, Inorganica Chimica Acta, 1997, 254, 167 DOI:10.1016/S0020-1693(96)05133-X
- ↑ G.L. Miessler, D.A. Tarr (2004). Inorganic Chemistry. Pearson Education, Inc. Pearson Prentice Hall. ISBN 0-13-035471-6.
- ↑ Herrmann/Brauer:Synthetic Methods of Organometallic and Inorganic Chemistry Georg Thieme, Stuttgart, 1996