Rep:Mod:SJCryer Module3
Tutorial
The Cope Rearrangement
In the picture below is the cope re-arrangement. It passes through a transition state which can either take the boat or the chair form.

Optimisation
Drew 1,5-hexadiene in ChemBio 3D, got structure to how it should look, used MM2 to give basic loose structure. Then opened in GaussView, used clean structure and then set up gaussian calculation. Used method and basis set:
# opt hf/3-21g geom=connectivity DOI:10042/to-2860
Summarised in table below.
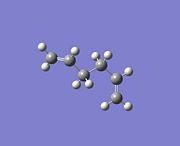
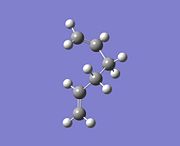
You would expect there to be more steric interactions for a gauche like conformer and so a higher energy would result. This being the case though, you may also get gauche interactions where the hydrogen donates into the opposite C-C antibonding orbital. The gauche 1,5 hexadiene was then drawn and optimised using the same basis set as previously DOI:10042/to-2866 .
The column referred to as 'Related to table' shows how the two conformers I have made relate to two of the conformers in Appendix 1.
| Compound | Related to table | Picture/Jmol | Energy (HF) | Point group |
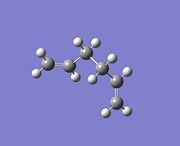
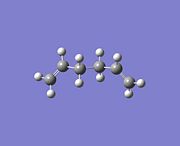
| 1,5-hexadiene Anti | anti2 | 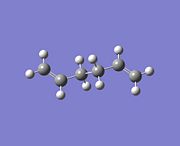 |
-231.6925352 | Ci |
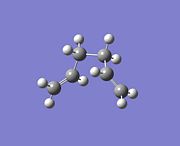
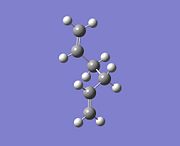
| 1,5-hexadiene Gauche | gauche1 | 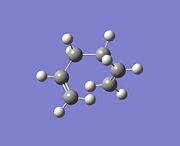 |
-231.6877161 | C2 |
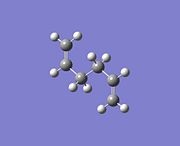
All of the possible isomers were drawn and optimised using the same gaussian method and basis set as before. They have been summarised in the table below with the lowest energy conformer at the top of the table. As you can see, this is what is labelled in 'appendix 1'[1] as Gauche 3.
When making the first anti conformer, this realted to anti2 in the appendix. It's energy is exactly the same (to 5.d.p) and it has the correct Ci symmetry. This molecule was then re-opened in gaussview and re-optimised using a more presise method and basis set:
# opt rb3lyp/6-31g(d) geom=connectivity
HF vs. DFT
Here are the two summary tables of the HF and DFT method.
| HF | ||
| Calculation Type | FOPT | |
| Calculation Method | RHF | |
| Basis Set | 3-21G | |
| Charge | 0 | |
| Spin | Singlet | |
| Total Energy | -231.69253516 | a.u. |
| RMS Gradient Norm | 0.00004313 | a.u. |
| Point Group | Ci |
| DFT | ||
| Calculation Type | FOPT | |
| Calculation Method | RB3LYP | |
| Basis Set | 6-31G(D) | |
| Charge | 0 | |
| Spin | Singlet | |
| Total Energy | -234.61170273 | a.u. |
| RMS Gradient Norm | 0.00001299 | a.u. |
| Point Group | Ci |
As you can see from the table above, there is quite a large energy difference between the two basis sets (7664KJ/mol) with DFT being the lowest in energy. The problem with comparing this energy is that it can sometime be misleading, and can only really be compared when you are looking at two different molecules with the same basis sets. A good way to compare is just by looking at the geometry.
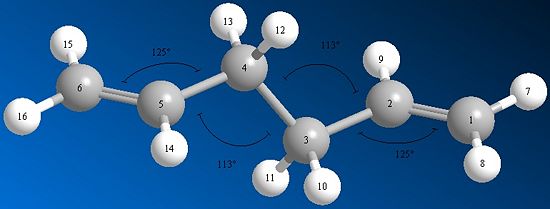
The table below shows a comparison of bond angles between carbons for the HF and DFT optimisation methods.
| Carbons | HF (3-21g) angle (o) | DFT (6-31g(d)) angle (o) | Difference (o) |
| C(4)-C(5)-C(6) | 124.8019 | 125.2867 | 0.48 |
| C(3)-C(4)-C(5) | 111.3427 | 112.6721 | 1.33 |
| 'C(2)-C(3)-C(4) | 111.3427 | 112.6721 | 1.33 |
| C(1)-C(2)-C(3) | 124.8019 | 125.2867 | 0.48 |
As you can see, there is quite a few degrees of difference between the two, with the DFT method having a slightly higher angle between all the carbon atoms. What this seems to have effectively done is stretch the whole molecule out slightly (as seen in the two image below). This would make sense in that there would be less steric interactions. And with no things like the gauche effect playing a role, you would expect this to be the biggest contributor. Notice how the angle difference is symemtric, it goes 0.48, 1.33, 1.33, 0.48. This reflects the centre of inversion that you see in the molecule giving it the Ci point group.
 |
 |
All in all, considering that all you have done is change the computational method and basis set, I would consider it to be a notable change. Its not massive, only a few degrees between each carbon, but it is still quite onsiderable none the less.
Frequency
The DFT optimised 1,5-hexadiene anti confomer was opened in GaussView and a frequency calculation was run using the basis set:
# freq rb3lyp/6-31g(d) geom=connectivity
As you can see from the table below, all of the frequencies are positive real values. That means that the moelcule is at a global minimum and is the lowest energy the molecule can be (as opposed to a local minimum).
 |
Having made sure the molecule was at the lowest energy, a note was taken of a few energy values:
| No. | Energy sum type | Energy (HF) | Explanation |
| i | Sum of electronic and zero-point energies | -234.4692 | Energy at 0K (inc. 0-point vib.) E=Eelec + ZPE |
| ii | Sum of electronic and thermal energies | -234.4619 | Energy at 298.15K/1atm . E=E + Evib + Erot + Etrans |
| iii | Sum of electronic and thermal enthalpies | -234.4609 | Same as above with additional correction for room temperature. |
| iv | Sum of electronic and thermal free energies | -234.5008 | Inc. entropic contribution to free energy |
Boat and Chair transition states
Chair - TS(berny)
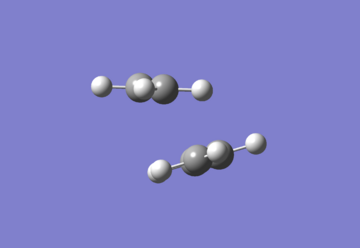
Firstly, the guessed chair was drawn. This was done by optimising a C3H5 fragment using HF/3-21g method and basis set. It was then duplicated and orientated so that the distance between the terminating carbons was 2.2A and was looking some what like a chair transition state.
Firstly, the TS(berny) method was to be used. This calculates the reaction co-ordinate by computing the force constant matrix once at the begining of the optimisation. The opt=(noeigen) stops gaussian crashing if more than one imaginary frequency is detected (meaning the output is wrong and is not the minimum energy TS). The input file viewed as follows:
# opt=(calcfc,ts,noeigen) freq hf/3-21g geom=connectivity
The photo below illustrates how the geometry changes for a side from the guessed structure to the actual berny transition state structure:
 |
 |
 |
The chair transition state also gave an imaginary frequency of 818cm-1 (3s.f.). This frequency corresponded to the cope rearrangement in that is howed the middle two bonds vibrating back and forth from one arrangement to the other.
 |
Chair - Frozen coordinate
This time the guess structure (guessed chair in picture above) was taken into gaussian and coordinates of the two bonds between the four terminal carbons on each allyl fragment were frozen using the redundant coordinator command. A minimum optimisation was then done on the molecule with these molecules not moving from their correct positions. The distance was set to 2.2A.
The output looks very similar to the TS(berny) chair structure, but the central bonds are fixed at the longer length of 2.2A. These fixed bonds now neeed to be dealt with. You are looking for the optimum length, so essentially you want an energy minimum (close enough together to be bonding, but not so close that the nuclei start to repel). So what you do is you leave the rest of the molecule and just optimise these bonds. You do this by changing the the middle bonds to the derivative in the reduddant coordinates editor. You are essentially looking for the derivative to be zero on the minimum energy curve. If your guess is good enough, thsi will be the global minimum (and not a local minimum).
This resulted in a structure pretty much exactly the same as that of the original TS(berny) shown above. The bond had shortened from the 2.2A fixed to 2.02A (same as TS(berny)).
Boat - QST2
The boat transition structure was to be calculated through the QST2 method. This is where you take the start and end molecule and then the QST2 method looks for the TS structure between the two. The start and end molecules must be similar in some respects to the transition state otherwise gaussian cannot see how to orientate the molecule correctly. For this reason the initial anti conformer was orientated into the a boat like structure
With this method, the carbons and hydrogens in the molecule must be numbered correctly so that the only thing that is changing is the orientation of the bonds. Although the two molecules may look like there is an obvious transition state between the two, if carbons 6 does not map onto carbon 6 in the product, then gaussian will try to move this carbon to wherever it is in the product molecule, causing an incorrect output.
When doing this, I had all of the carbons correctly numbered, but had neglected to re-number the hydrogens, this means that the carbons mapped into some kind of central area and the hydrogens were trying to jump huge atomic distances to map onto the other hydrogen in the product. This resulted in this mess:
 |
So all of the hydrogens were re-numbered so that they resembeled the photo below.
 |
This file was then set up for a QST2 TS calculation by selecting the opt+freq and then changing it to "optimise to a: TS(QST2)" and calculating the force constants never. Method and basis set looked like:
# opt=qst2 freq hf/3-21g geom=connectivity
This resulted in the desired boat transition structure which was confirmed as being correct by having one imaginary frequency (at -804cm-1).
 |
Chair and boat - IRS
When looking at your transition state, you cannot tell what it will converge to (what the product will be) just from looking. You can however do it by looking at the intrinsic reaction coordinate. This is done by looking at the potential energy surface of the transition state and taking small geometric steps down this curve until you reach a minimum.
The IRC was run with 50 small geometric steps. There are three things you can now do: Because the molecule is not fully optimised after 50 steps, you can just take the last molecule and run an optimisation on it. This is fast, but it also means that if you have only reached a local minimum on the energy curve, then you will not have actually conformed to the correct structure of your product. The second way is to re-run your IRC calculation with a greater number of points (e.g. N=150) and see if this reaches the minimum structure. The problem here is if you give the calcualtion too many points, then this can converge off from the actual real structure. The third way is to calculate the force constant at every step. With the first two methods, the force constant was calculated once at the beginning of the calculation and then assumed for the rest of it. This means a faster result, but can be less accurate. If the force constant is calculated at the beginning of each step, then if it hits the global minimum, then it will not keep going (like when N=150).
ChairTS
I did all three methods. Firstly looking at changing from the no. of geometric steps from 50 to 150. This made very little difference (as seen in the table below). I then looked at calculating the force constant at every step (with N=50). Although more computationally expensive, it gave a much better estimate with the terminating two carbons stretching from about 3.19A apart to around 4.35A (on the chair TS). This was therefore a much better guess. I was still unsure as to whether this was the minimum though, so I then set a calculation to calculate the force constant at every step with the no. of steps being equal to 200. This actually made very little difference and so I concluded this was the best IRC estimation. I then compared this molecule to the one it was most similar to (gauche2) and you could see that it was very similar in structure and the distance between terminal carbons was 4.35A compared with 4.39A in gauche2.
BoatTS
The same was done to the boat as the chair. The difference between N being 50 and 150 made very little difference. The structures were almost exactly the same. When you calcualted the force constant every time however, this gave quite a different structure. The distance between the terminating atoms being 4.34A. This mostly correlated to the gauche3 structure. Although it compares to this the most, there is a twist on the central bond in gauche3 which isn't in my structure. I did an energy optimisation on the structure and it stayed exactly the same. It must be stuck in a local energy minimum. To try and combat this, I re-ran the structure calculating the force constant each time, but with N now being 500. This made absolutely no difference and gave the exact same structure as the other molecule calculated with the force constant every step.
| IRC | ChairTS | BoatTS |
| IRC N=50 | 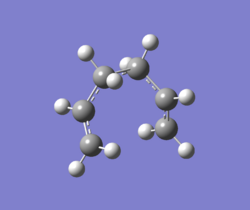 |
 |
| IRC N=150 | 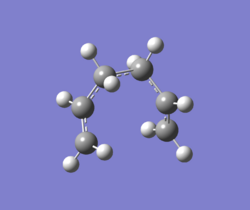 |
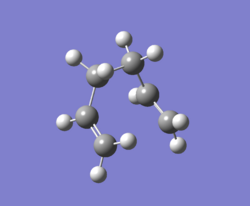 |
| IRC Force constant calc every time |  |
 |
| Similarity |  gauche2 |
 gauche3 |
Activation energy
The energies in the table below are the 'Sum of electronic and zero-point energies'.
| Conformer | Energy (HF) | Difference (HF) | Difference (kcal/mol) |
| Anti2 | -234.4692 | - | - |
| Chair TS | -234.4149 | 0.0543 | 34.0693 |
| Boat TS | -234.4023 | 0.0669 | 41.9615 |
As you can see, the activation energy is lower for the chair transition state and so it will be this transition state that our product will go through.
Diels Alder
Introduction
The diels alder reaction is a pericyclic reaction (cycloaddition) involving two pie orbitals interacting to form two new sigma bonds. The orbital overlap of these pie clouds strongly effects the geometry of the attack and so of the product. For attack to occur in the first place though, the HOMO and LUMO must align/overlap and also be of the correct symmetry. If they are not of the correct symmetry, they cannot overlap and so the reaction cannot take place.
The first reaction under investigation is that between butadiene and ethylene:

Cycloaddition of Ethylene to Butadiene
Cis-butadiene was firstly drawn into ChemBio 3D as this is the easiest way to draw it. It was minimised in energy and structure using the MM2 minimisation to give a basic optimised structure. It was then opened in GaussView and optimised using the semi-emperical AM1 method. This also gave the molecule orbitals.
 |
 |
 |
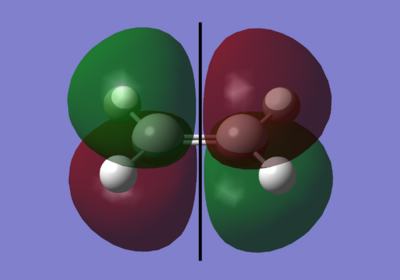 |
The black line down the centre of each image represents the reflection plane and is either symmetric or anti-symmetric.
As you can see here, for overlap to occur, it must be between the two symmetrical pie orbitals. this is the LUMO of the cis-butadiene and the HOMO of the ethylene.
Transition states
The first method to try and find the transition state was that of the QST2. The molecule's were set up as in the picture below and run under a HF/3-21g method and basis set. The result is next to it.
 |
 |
As you can see in the images above, a transition state was obtained, but the bonding in it seems rather strange. Is it very strange as you cannot even remove the double bond in the TS and GaussView does not seem to think it exists! That said, the estructure itself seems to be quite reasonable for a TS. It has a bond distance of about 2.2A for the terminal four carbons. This is a good estimate for a diels-alder TS and do would suggest it is the correct geometry.
From here, I tried to do a QST3 optimisation guessing the transition state in the middle. This went horrifically wrong and gave some strange thing with the terminal carbon bonds being around 1.5A which is more like product than a TS.
From here I thought it would be good to try and use the TS berny as I had some idea of what the TS now looked like. I drew the molecules in ChemBio3D and then orientated them into the guessed transition state structure. I then opened this in GausssView and ran a TS(berny) optimisation with frequency, calculating the force constant once at the start of the reaction. The method used this time was DFT 6-31g(d) basis set. This resulted in the transition state below:

This is highly likely to be the true transition state, with the forming bond being 2.27A. The vibrations were then looked at. There was only one imaginary frequency at -535cm-1. This corresponded to the bond formation between the ethylene and the butadiene. As shown in the picture below: the two reactants on the left and then moving together to give the transition state.

The bond formation is synchronous as both bonds are moving together and they are forming at the same time. This is confirms that the reactino is concerted which must be the case if it is to be classed as a pericyclic reaction. The lowest frequency after the imaginary one is at 135cm-1. When animated it shows all of the atomns in the molecule rocking. Becuase all of the molecules were doing this and the energy is so low, it suggests that it is a thermal vibration.
Below is an image showing the exact bond lengths of the diels alder product. A typical sp3 C-C bond length is abotu 1.54A whereas a typical sp2 C=C bond length is 1.33A. The C=C bond lengths are 1.38A and the C-C are about 1.41A. These lengths are somewhat in-between Sp2 and Sp3 bond lengths which means that in the transition state, the bond character is somewhere in-between. This is to be expected. The bonds between the two reactants are around 2.27A. This is a reasonable value for a diels-alder transition state, but is clearly a lot longer than an avergae C-C bond and this is because it clearly isn't a C-C bond yet. It has some sp3 bond character, but like the other bonds are less than sp3, this one is a lot greater than sp3. It shows how the 'sp2' 'sp3' valence model is jsut that... a model. When looking at molecular orbitals you can see that there is no 'exactly sp2/sp3' but often something inbetween which just corresponds to orbital overlap (or not as the case may be).
The Van de Waals radius is 1.7A for carbonDOI:10.1021/j100785a001 and so for there to be VdW interaction, the bond must be shorter than double this distance (3.4A). With the distance between considerably shorter than this (2.27A), it suggests that there is not just VdW interactions anymore, but the start of a sigma bond formation.
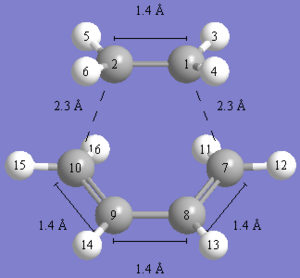 |
NBO Analysis
I ran a full NBO analysis on the transition state so that the moelcular orbital interaction could be viewed. The most interesting orbital is the LUMO. Looking at the two symemtrical orbitals above (HOMO of ethylene/LUMO of butadiene), you can clearly see these have combined together in the transition state MO below. There is still a pie cloud on top of the ethylene like in the HOMO and the MO's under the butadiene have not changed from the LUMO. It is purely the electron density between the two molecules which have changed and these have combined to give a large (symmetric) area of bonding.

The other interesting MO that I saw was the HOMO-2. It is still a bonding orbital between the two reactants and shows a huge area of bonding beteen the two reactants. It looks to be between the HOMO of the ethylene and a different orbital on the butadiene.
 |
 |
Below is the HOMO, but this doesn't really show anything interesting.
 |
 |
Lastly is the HOMO-1. This is the most interesting after the LUMO. It looks to be the combination of the anti-symmetric orbitals (butadiene HOMO and ethylene LUMO). You can see it is anti-symmetric in nature:
 |
 |
To quote Woodward and Hoffman (1971)[2] "A reaction is allowed only when all the reactant bonding electrons are tranferred without symmetry-imposed barrier, into bonding orbitals of the products."
This reaction is classed as 'allowed' because the two symemtric orbitals have combined to give the LUMO and another symemtric orbital. The two anti-symmetric orbitals have also combined to give an anti-symemtric orbital
Diels-alder regioselectivity - Cyclohexa-1,3-diene & maleic anhydride
All of these calcualtions were done slightly differently to above. ChemBio3D was opened and a guessed transition state was drawn with the approximate bond length of 2.2A being made the 'optimum length'. This was then run with MOPAC under RM1 (which is more modern than AM1), to give a transition state. This was exported as a gaussian file and opened in GaussView. Then and optimisation and frequency were run using the DFT/6-31g(d) method and basis set and a TS(berny) optimisation with the force constant being calculated once.
The reaction sheme below shows how cyclohexa-1,3-diene & maleic anhydride combine to give both and endo and an exo product.
 |
Below is a table showing the most crucial information about the endo and exo products. The most important is the energy. Although there is only a small difference (11.81KJmol-1), the endo product is the lowest in energy. Becuase it is the lowest energy transition state, it means that the kinetic endo product will predominately form in the reaction rather than the thermodynamically more stable exo product. If the transition state is lower in energy it means that the activation energy is lower and so this product forms.
| Product | Photo | Energy (HF) | Energy (KJmol-1) | Imaginary Freq. (cm-1) | Method and Basis-set |
| Endo |  |
-612.4954778 | -1.61E+06 | -447 | RB3LYP/6-31G |
| Exo |  |
-612.4909814 | -1.61E+06 | -448 | RB3LYP/6-31G |
Bond Lengths
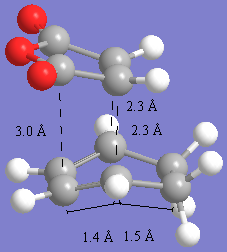
The images below show the transition state bond lengths to be 2.27A for endo and 2.29A for the exo product. This is again a reasonable bond length for diels-alder reactions. The through space distances are shown by measureing the distance between the closest atoms in the pretruding regions. These are around 3A for the endo product and 2.8A for the endo product. These are significantly close enough to take part in steric interactions and also secondary orbital overlap. The shorter bond for the endo product suggests there is slightly more orbital overlap in this molecule resulting in more bonding and this is one of the reasons that the endo product is the lower energy transition state. Anothe reason is to do with the steric interactions. In the exo form, the closest through space distance is to the hydrogens which are coming off the '-CH2-CH2' fragment. BEcuase this is a single bond and sp3 hybridised, the hydrogens stick out of the plane,r esulting in more of a steric clash with the oxygens on the maelic anhydride petrusion. With the endo form, the '-CH=CH-' part has sp2 flat hydrogens in the plane, and so the closest steric interaction is with the carbons which are further away (3A) than with the sp3 hydrogens on the exo (2.8A) resulting in less steric hinderance and a lower energy due to a shortening of the main TS bond.
 |
 |
MO's and Secondary orbital overlap
 |
 |
 |
 |
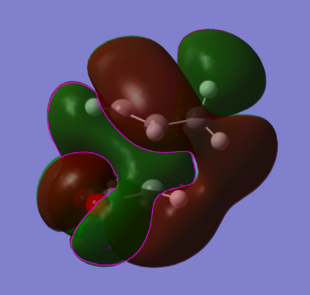
The endo product has greater stability due to secondary orbital overlap. If you look at the side view molecular orbital for both the endo and exo, you can see a large area of orbital overlap in red coming around the back of the molecule. This comes across from the pie bond through to the back of the system and down to the carbons and hydrogens in the endo and to the oxygen p-orbitals in the exo. This probably accounts for about the same equalisation in energy.
In the endo form though (green orbital with pink outline), orbital overlap coming from the pie cloud in the diene stretching down to the oxygen p-orbitals. This is the secondary orbital overlap and this accounts for a stabalisation that the exo form does not have.

