Rep:Mod:SJCryer Module2
BH3 - Optimisation
Optimisation
Firstly, BH3 was drawn in GaussView. One of the bond lengths was then manually changed to 1.5A. A gaussian input file was then created using the "gaussian calculation setup" function. The options used were:
# opt b3lyp/3-21g geom=connectivity
The "opt" states that gaussian is to do a optimisation calculation. The "b31lyp" is the method and "3-21G" is the basis set being used.
This input file was then run through the gaussian 09W software on the computer. So that a D-Space link could be obtained, it was then ran through the SCAN supercomputer. This produced a log output file (DOI:10042/to-2571 ) which was downloaded and opened in GaussView.
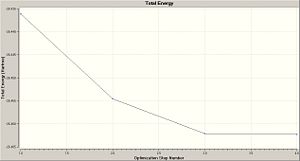
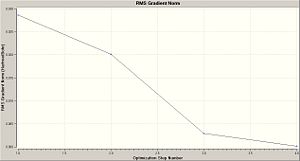
This gave two graphs
 |
 |
BCl3
Optimisation
Firstly, BCl3 was drawn in GaussView and a gussian input file was created using the following parameters:
# opt b3lyp/lanl2mb geom=connectivity
This input file was run on the scan computer and the output downloaded (DOI:10042/to-2572 ).
The bond length obtained for the B-Cl bond was 1.87A. The optimised bond angle for Cl-B-Cl was 120°.
Below is a table summarising the important information about the molecule:
| Optimisation summary | ||
| Calculation Type | FOPT | |
| Calculation Method | RB3LYP | |
| Basis Set | LANL2MB | |
| Charge | 0 | |
| Spin | Singlet | |
| E(RB3LYP) | -69.43926345 | a.u. |
| RMS Gradient Norm | 0.00082067 | a.u. |
| Imaginary Freq | ||
| Dipole Moment | 0 | Debye |
| Point Group | D3H |
Frequency
A frequency calculation was then run on the optimised molecule using the calculation method and basis set:
# freq b3lyp/lanl2mb geom=connectivity DOI:1042/to-2720
This is the same basis set (b3lyp/lanl2mb) as the geometry optimisation. It is important to use the same basis set when doing this. The reason is because the frequency is the second derivative of the potential energy curve. So if we have calculated a different potential energy of the molecule in the optimised basis set, then by using a different basis set, you might have potentially a different potential energy curve (more or less accurate) and so could comparing the two would not be accurate.
| BCl3 optimisation | ||
| Calculation Type | FREQ | |
| Calculation Method | RB3LYP | |
| Basis Set | LANL2MB | |
| Charge | 0 | |
| Spin | Singlet | |
| E(RB3LYP) | -69.43928112 | a.u. |
| RMS Gradient Norm | 0.0000591 | a.u. |
| Imaginary Freq | 0 | |
| Dipole Moment | 0 | Debye |
| Point Group | D3H |
Notice the energies here are the same for both molecules, reflecting on how the same basis set was used.
One of the reasons you might carry out a frequency analysis is to find out if you have the minimum energy of your molecule. Because the frequency of the molecule is the second derivative of the potential energy curve, if this value is positive, then it means you have a minimum:
The table below gives a list of the IR values:
| Mode # | Frequency (cm-1) | Intensity |
| 1 | 214 | 4 |
| 2 | 214 | 4 |
| 3 | 377 | 44 |
| 4 | 417 | 0 |
| 5 | 939 | 259 |
| 6 | 939 | 259 |
As you can see here, all of the wavenumbers are positive and so this means the BCl3 molecule must be in a potential well and therefore at a minimum energy. Because all of the values are positive, it means I am at the total minimum of the molecule, the lowest global minimum. If say one of them was negative, this would mean I could be in a local minimum with respect to the potential energy, but not the total global minimum energy of the whole molecule.
The bond length obatained from the optimisation calculations was 1.87A. The literature value is 1.75A[1]. This seems to be quite a large difference between the optimisation and the real value. This shows you some of the limits of the basis-set being used. Had it been larger and more time intensive, a better length could have been achieved. I could not find a literature value for the bond angle of BCl3, but due to it's highly symemtric nature, it can only be 120° which is the value the optimisation found.
Sometimes, GaussView will not draw a bond. This is because what GaussView see's as a 'bond' is set as two molecules being within a certain distance of each other according to its parameters. If the molecules fall outside of these distances, then GaussView does not put a formal bond inbetween the two molecules. This does not necessarily mean a bond does not exist if GaussView does not show it, it means it falls outside of its pre-set parameters.
A bond can be described using two different methods. Initially we have the VSEPR method which describes a bond as two electrons between two atoms. This is a very simple model. A much better model is MO theory. This can simply be described as an area of electron density holding two otherwise positively charged nuclei together. A 'molecular orbital' is formed through the linear combination of the atomic orbitals of the two molecules you think there might be a bond between.
If you have a bonding molecular orbital between two molecules which is occupied (with electrons) then this can be classed as a bond, no matter how big or small this distance is. This is where GaussView may fail to see what it considers a bond, but in-fact... it is!
You would expect the molecule to be on D3H symmetry and this is what GaussView uses. This is expected because of the shape of the molecule and its symemtry elements (C3, 3C2, sigma plane perpendicular to main axis, 3. mirror plane parallel to main axis etc.). The reason GaussView will use the point group is because if it knows it is off a certain symmetry, when doing the optimisation, if near a local minimum, by using the symmetry elements, it can move the molecule to the global minimum and a better optimised molecule.
The first optimisation calculation took 8 seconds on SCAN (DOI:10042/to-2572 .
The second frequency calculation took 4 seconds on SCAN DOI:1042/to-2720 .
BH3 - Molecular orbitals
MO calculations
Firstly, the optimised BH3 was opened in GaussView and a new gaussan calculation was set up. This time is was to calculate the molecular orbitals for the molecule. The function used was:
#rb3lyp/3-21g pop=(nbo,full) geom=connectivity DOI:10042/to-2618
Here, the nbo stands for natural bond orbital and this method looks at the charge distribution and also the MO's for the molecule. It works through looking at interactions between different bonding and anti-bonding orbitals and seeing if they mix. It comes up with a lot more localised set of MO's which refere to bonds and functional groups as opposed to real MO's which are often more delocalised across the whole molecule.
Charge distribution
The log file was opened and the charge distribution shown using colour. Green being positive and red being negative. This is illustrated in the picture below (DOI:1042/to-2635 ):
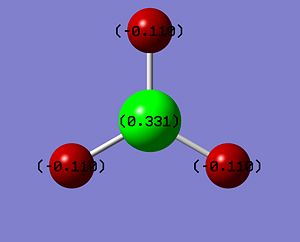 |
The log file was opened and viewed. Below is the table showing all of the various charges. Notice how the sum total of the charge is equal to zero and how the charges on the hydrogens are all equal (they have been rounded to 3d.p. in the photo). Also, all the other values for hydrogen are exactly equal, showing the D3h symmetry of the molecule:
| Atom | No | Natural Charge | Core | Valence | Rydberg | Total |
| B | 1 | 0.33121 | 1.99904 | 2.66978 | 0.00000 | 4.66879 |
| H | 2 | -0.11040 | 0.00000 | 1.11008 | 0.00032 | 1.11004 |
| H | 3 | -0.11040 | 0.00000 | 1.11008 | 0.00032 | 1.11004 |
| H | 4 | -0.11040 | 0.00000 | 1.11008 | 0.00032 | 1.11004 |
| -------- | -------- | -------------- | -------------- | -------------- | -------------- | -------------- |
| Total | 0.00000 | 1.99904 | 6.00000 | 0.00097 | 8.00000 |
The first time this file was opened, not all of the hydrogen values were symmetric. This was suspicious. When then looking at the orbital contributions, this was also un-even and incorrect. Checking my molecule, I saw one of the H-B-H angles was 119° and another 121°. This meant that the optimization must have gone wrong somehow. BH3 was then re-drawn in a new window and the optimization and MO calculations were done a second time. This time the angles were all 120° and the results above were obtained (all equal).
Orbitals
Looking in the log file, you can see all of the orbital contributions for each bond:
      (Occupancy)   Bond orbital/ Coefficients/ Hybrids
---------------------------------------------------------------------------------
    1. (1.99851) BD ( 1) B   1 - H   2
               ( 44.49%)   0.6670* B   1 s( 33.33%)p 2.00( 66.67%)
                                           0.0000  0.5774  0.0000  0.0000  0.0000
                                           0.8165  0.0000  0.0000  0.0000
               ( 55.51%)   0.7451* H   2 s(100.00%)
                                           1.0000  0.0000
    2. (1.99851) BD ( 1) B   1 - H   3
               ( 44.49%)   0.6670* B   1 s( 33.33%)p 2.00( 66.67%)
                                           0.0000  0.5774  0.0000  0.7071  0.0000
                                          -0.4082  0.0000  0.0000  0.0000
               ( 55.51%)   0.7451* H   3 s(100.00%)
                                           1.0000  0.0000
    3. (1.99851) BD ( 1) B   1 - H   4
               ( 44.49%)   0.6670* B   1 s( 33.33%)p 2.00( 66.67%)
                                           0.0000  0.5774  0.0000 -0.7071  0.0000
                                          -0.4082  0.0000  0.0000  0.0000
               ( 55.51%)   0.7451* H   4 s(100.00%)
                                           1.0000  0.0000
    4. (1.99904) CR ( 1) B   1           s(100.00%)
                                           1.0000  0.0000  0.0000  0.0000  0.0000
                                           0.0000  0.0000  0.0000  0.0000
    5. (0.00000) LP*( 1) B   1           s(100.00%)
As you can see here, the orbitals on boron must be split into sp2 hybridised orbitals. This is because there is a 33.33% contribution from the s and a 66.67% contribution from the p. Therefore this is a 1:2 ratio and so there is one s and two p orbitals, resulting in sp2 hybridised. The hydrogens are then 100% s orbitals contributing to the bond with the boron.
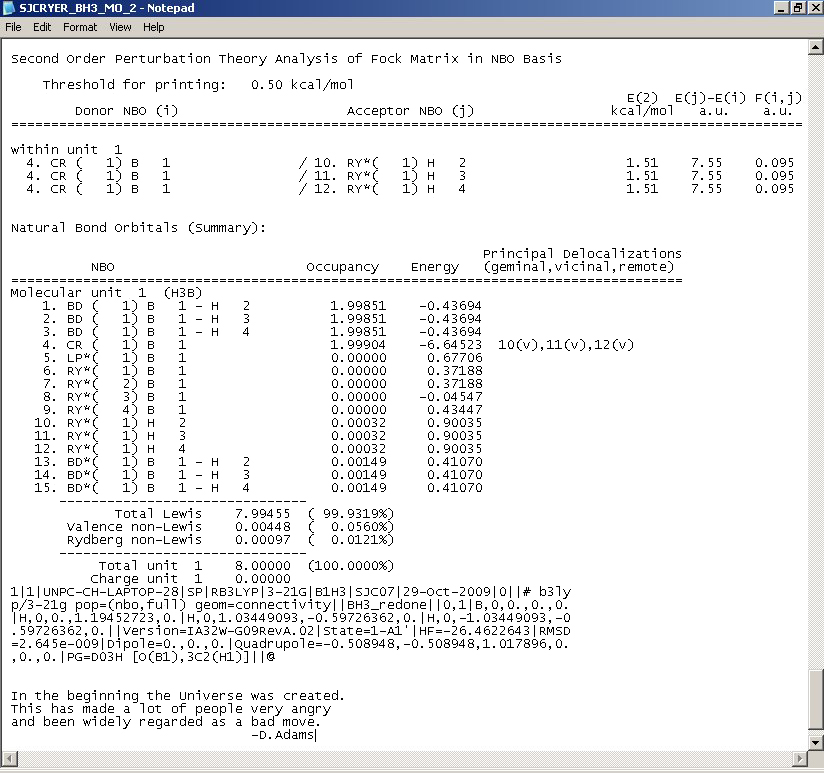 |
This photo above firstly shows the interaction between anti or non-bonding orbitals with bonding orbitals (second order perturbation theory analysis of fock matrix in NBO basis). For BH3, this is minimal and so the table contains little useful information.
The second part is the "Natural Bond Orbtials (Summary)" and this shows the occupation or population in the B-H bonds or lone pairs. It also shows the energy. Notice here how the main occupation is in the first four bonding orbitals (as would be expected). These all have negative energies which shows how having electron density in these orbitals will lower the energy of the molecule (favouring bonding). What is interesting is that the 8th molecular orbital (although having no occupancy) has a negative energy, whereas all others have a positive energy meaning that when electron density is put into these orbitals, the energy of the molecule is made higher and so is less stable.
Frequencies
Here is the summary for the optimised BH3 (top table) compared with the BH3 freq table. They show that the energy is exactly the same and so the frequency calculations have been done on the correctly optimised molecule:
| BH3 optimisation summary | ||
| Calculation Type | FOPT | |
| Calculation Method | RB3LYP | |
| Basis Set | 3-21G | |
| Charge | 0 | |
| Spin | Singlet | |
| E(RB3LYP) | -26.461975 | a.u. |
| RMS Gradient Norm | 0.0036023 | a.u. |
| Imaginary Freq | ||
| Dipole Moment | 0 | Debye |
| Point Group | D3H |
| BH3 frequency summary | ||
| Calculation Type | Freq | |
| Calculation Method | RB3LYP | |
| Basis Set | 3-21G | |
| Charge | 0 | |
| Spin | Singlet | |
| Total Energy | -26.461975 | a.u. |
| RMS Gradient Norm | 0.0036023 | a.u. |
| Imaginary Freq | ||
| Dipole Moment | 0 | Debye |
| Point Group |
The basis set used for the frequency calculation was:
# freq b31lyp/3-21g geom=connectivity pop=(full,nbo) DOI:1042/to-2713
Below is a screen shot of the frequencies and orbital symmetries obtained from the log file. These are tabulated in the table below it along with the pictures of the molecular vibrations.
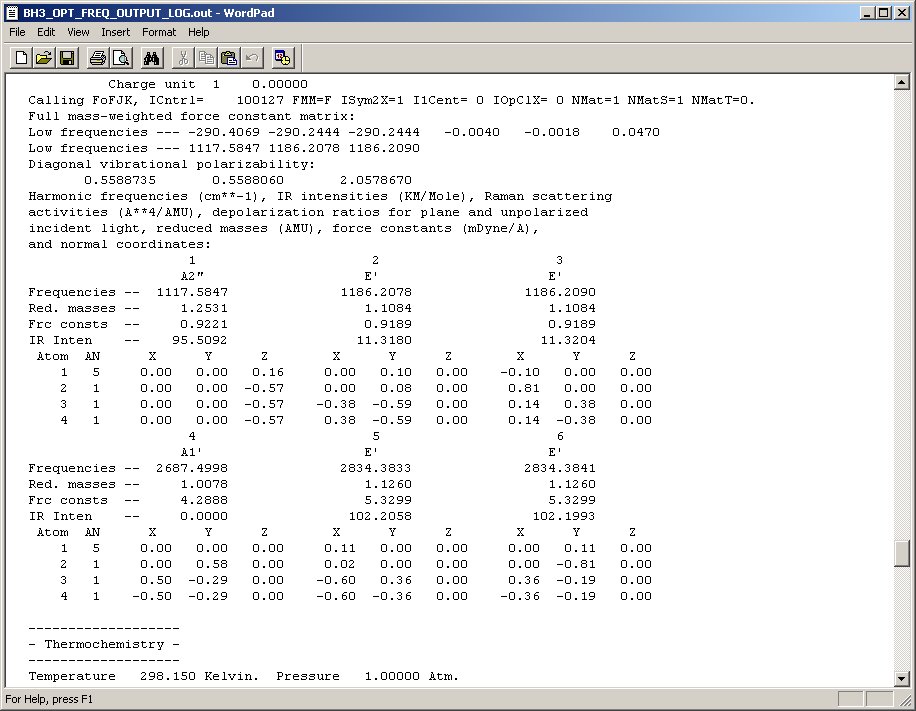 |
Compared with the document above, you will notice the table below has rounded the figures to various significant figures. This is because beyond these roundings, the figures are not accurate (and so it is pointless to quote them).
| Mode # | Vibration form | Frequency (cm-1) | IR - Intensity | Symmetry D3h point group | Vibrational mode[2] |
| 1 | 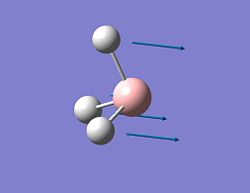 |
1118 | 96 | A2'' | Wagging |
| 2 | 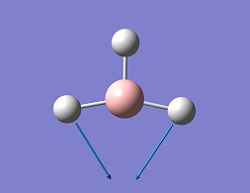 |
1186 | 11 | E' | scissoring |
| 3 | 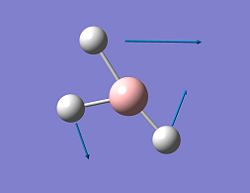 |
1186 | 11 | E' | rocking |
| 4 | 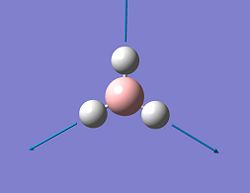 |
2688 | 0 | A1' | symmetrical stretch |
| 5 | 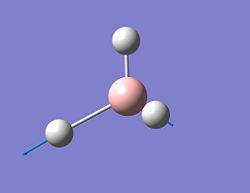 |
2834 | 102 | E' | asymmetrical stretch |
| 6 | 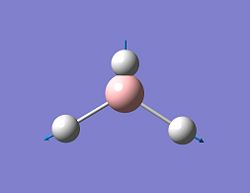 |
2834 | 102 | E' | asymmetrical stretch |
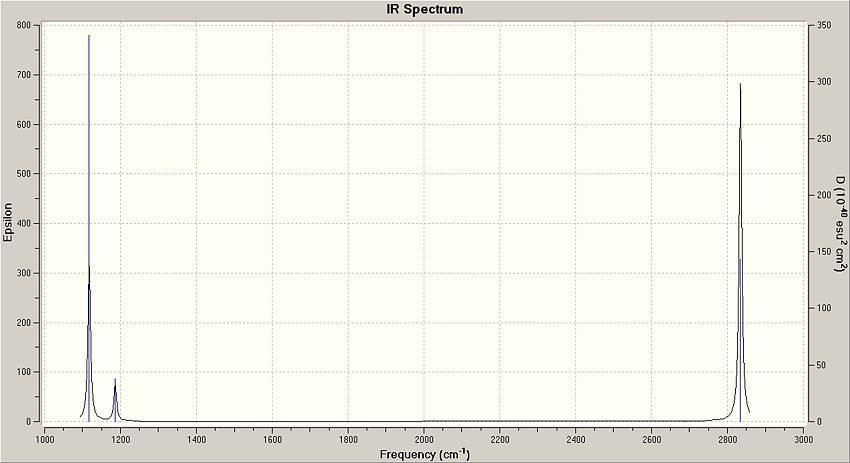
In the IR spectrum, you will only notice 3 peaks, even though there are 6 vibrations. This is due to the symmetrical element of some of the virbrations. Although you can clearly see different vibrations in the images, they have the same wavenumber and so will appear to be the same peak on the IR spectrum. This results in fewer observed peaks on the spectrum. Mode # 4 also has an intensity of zero and therefore will also not show up on the spectrum:
 |
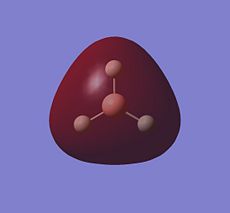
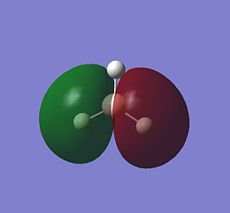
BH3 LCAO MO analysis
 |
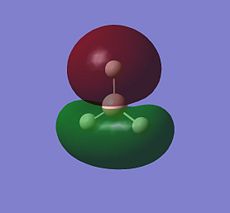
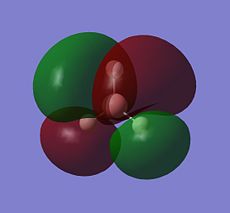
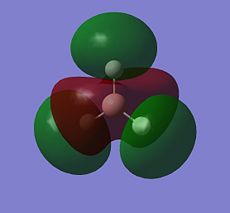
| Orbital | LCAO representation | Molecular Orbital (NBO) |
| A1' | 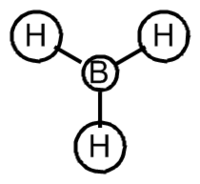 |
|
| E' | 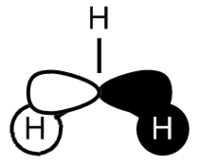 |
|
| E' | 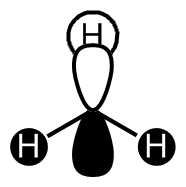 |
|
| A2" |  |

|
| A1' |  |
|
| E' | 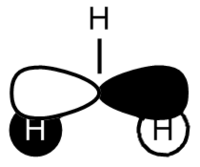 |
|
| E' | 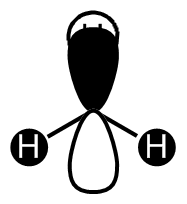 |
|
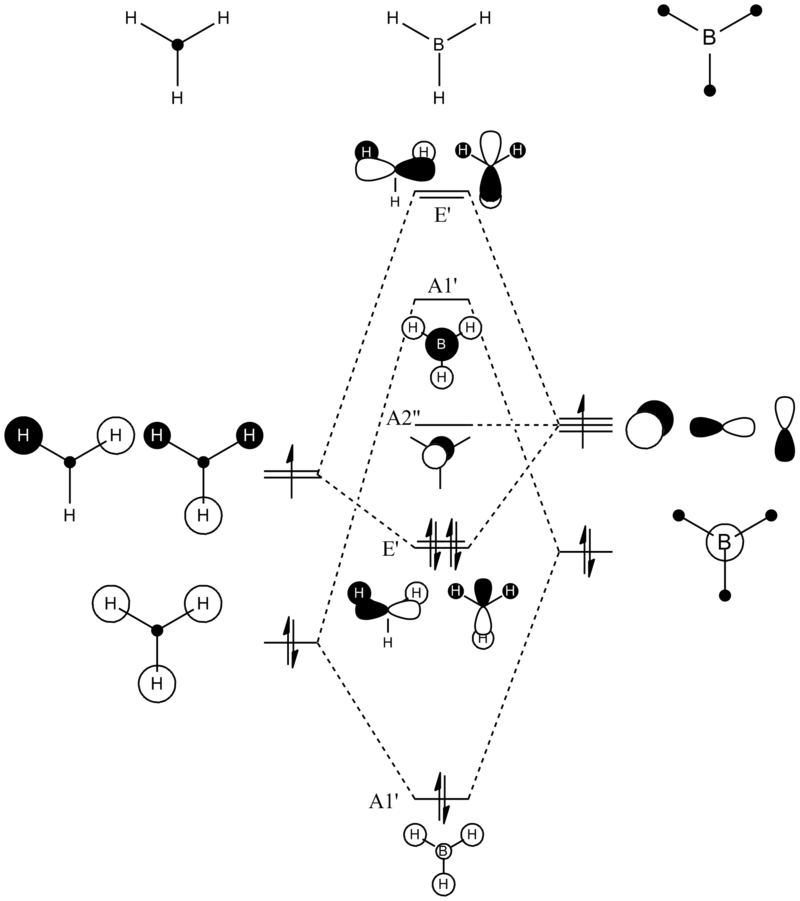
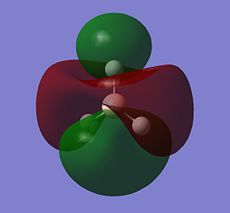
Looking at the above diagram and table you can see exactly which MOs match up with the approximate LCAO method. The first three bonding and 4th non-bonding orbitals match each other very very closely, giving a real sense that for bonding and non-bonding orbitals, the LCAO method is really quite accurate at predicting what the MOs. The first non bonding orbital (A1' - number 5) unfortunately gives quite a mis-match between the LCAO and MO theories. This is also the same for number 6 (first anti E'). They are quite dissimilar. The last E' though (number7) again actually gives quite a good approximation. There is density around the top of the two bottom hydrogens and the top of the boron and then an anti orbital between the bottom two and on top of the top H.
What can be concluded from thsi example is that the LCAO method seems to be accurate for bonding and non-bonding orbitals and occasionally for ati-bonding. It does fall down however in most of the anti-bonding orbitals, producing something that is really not alike in the slishtest. This is where the limitations of LCAO theory lie. It is good for approximations in some areas and will give quite a good idea, but for the cold hard facts, you must turn to a real molecular orbital analysis.
Cis- & Trans - Mo(CO)4(PCl3
Optimisation
The first thing was to draw the molecule and optimise the structure. The easiest way to do this was to use ChemBio3D to draw the structure and then by fiddling with it and doing various MM2 calculations, you could get an approximate geometry. This was then saved and imported into GaussView to set up a loose optimisation calculation. This was sumbitted to SCAN using the calculation method and basis set of:
# opt=loose b3lyp/lanl2mb geom=connectivity
The important thing here is that it is doing a loose optimisation (opt=loose) and is using the more accurate lanl2mb basis set (compared with 3-21g basis set). This produced two output files; trans (DOI:1042/to-2666 ) and is (DOI:1042/to-2667 ).
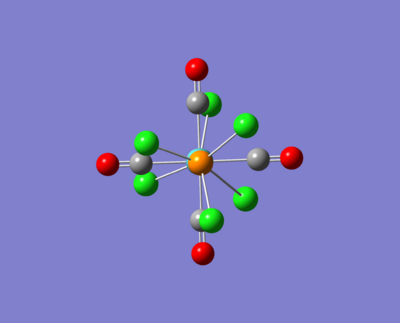
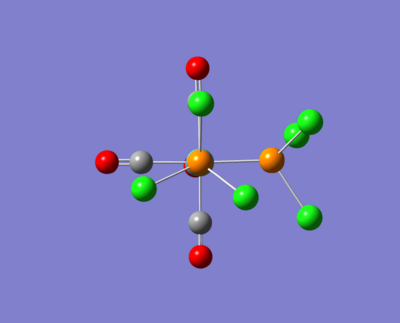
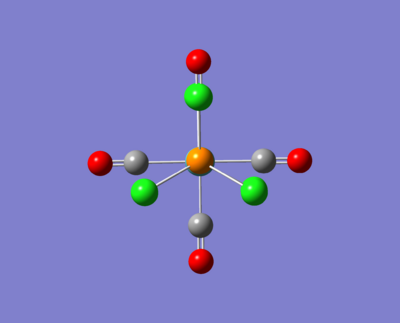
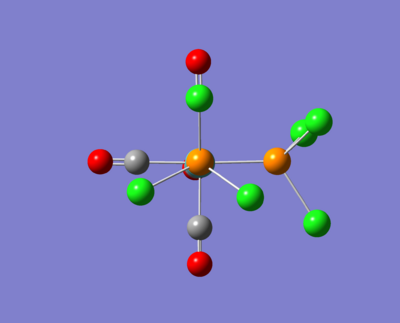
Here are some images of the cis and trans isomers.
The two molecule above were then opened up in GaussView and were tweaked as described in the images above. These were then run for a fine geometry optimisation using the lanl2dz basis set which is more accurate than the lanl2mb set:
# opt b3lyp/lanl2dz geom=connectivity int=ultrafine scf=conver=9
Obtained two SCAN files for the trans (DOI:1042/to-2669 ) and cis (DOI:1042/to-2670 ).
These log files were then opened in GaussView and an output created exactly the same as the last one. Once these gjf files had been created, then were opened in a text editor and edited to include the extra d-orbitals on the P atoms. The calculation edited was now:
# opt b3lyp/lanl2dz geom=connectivity int=ultrafine scf=conver=9 extrabasis
Then under the bottom line, this was added:
 ...
 15
 16
 17

 P O
 D 1 1.0
 0.55 0.100D+1
 ****
This again created two output files for trans (DOI:1042/to-2671 and cis (DOI:1042/to-2672 ).
Notice this time how the molecule has 0° dihedral angles now in a lot of places. This is due t hte moving of the groups and the fine optimisation.
 |
 |
Frequency
The new optimised isomers were opened into gaussview and a new frequency calculation was created. Because d orbitals now have to be taken into consideration and it was stated "The frequency must be computed with exactly the same method/basis set and options as the optimisation.[3]". The new frequency input files were taken into wordpad and the "extrabasis" word was added after the basis set. Then at the bottom the text, the extra basis' "P O ... 0.55 0.100D+1 ****" were added. This was done for both the cis- and trans- isomers.
The following files were obtained after running the calculation: trans (DOI:1042/to-2673 ) and cis (DOI:1042/to-2674 ).
In case this was incorrect, the previous "ultrafine" optimisation was also outputted as a frequency calculation and run on scan: trans: DOI:1042/to-2675 and cis: DOI:1042/to-2676 .
Luckily, the dAO extra basis set atomic calculations worked and gave frequency results. All of these results were positive for both trans- and cis-. This means that both were at the global minimum in energy for the molecule.
- COMPARE TO LIT VALUES***
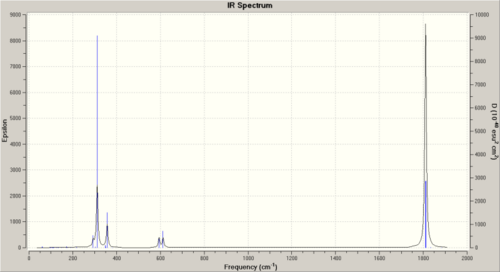
Here are the IR spectras:
 |
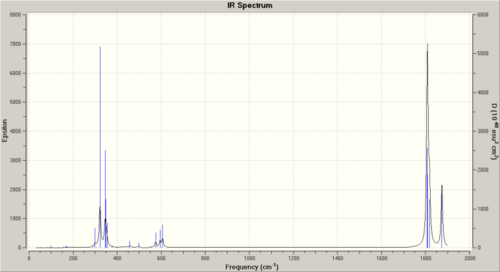 |
Most important areas are the C=O stretches. These are tabulated for the cis and trans below:
| Product | Mode # | Frequency | Intensity | Bond |
| Trans | 42 | 1810 | 1292 | Two C=O trans - asymmetric stretch |
| 43 | 1812 | 1298 | Other two trans C=O asymmetric stretch | |
| 44 | 1834 | 8 | All 4 C=O asymmetric stretch | |
| 45 | 1884 | 1 | All 4 C=O symmetric stretch | |
| Cis | 42 | 1807 | 1166 | Symmetric |
| 43 | 1809 | 851 | Assymetric | |
| 44 | 1817 | 566 | Assymetric | |
| 45 | 1874 | 643 | Symmetric |
In the trans ligand, there are only two stretches that are worth accounting for relative to the intensities, whereas there are four stretches all with high intensities in the cis ligand.
The values recorded from my 2nd year lab experiment are below:
| Isomer | Bond | Stretch (cm-1) |
| Cis | C=O (A1) | 2012.62 |
| C=O (A1) | 1946.08 | |
| C=O (B1) | 1913.43 | |
| C=O (B2) | 1885.64 | |
| Trans | C=O | 1890.54 |
Here we can see that the experimental evidence does not correlate hugely. But this is expected in that the PPh3 has been replaced with PCl3. For the cis product, there are four clear bands and these fall in a similar region, but still over 130cm-1 out in some places. For the trans, this value is not as far out, but it is still about 70-1 off.
Interesting, the computational method gives two bands for the trans where there is experimentally only one. This is likely to be due to the symmetry elements of the molecule and experimentally the two peaks fall on top of each other. In the cis, you would expect to see four peaks, and this is the case for both the experimental and computational methods.
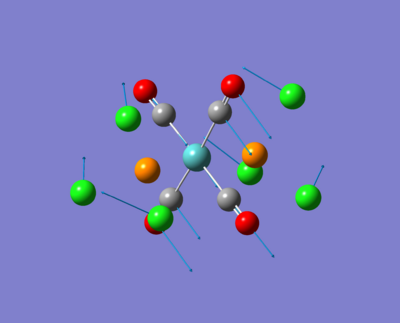
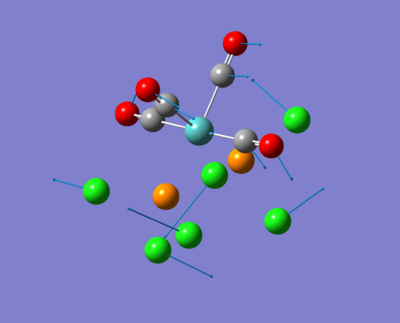
Low frequency stretches. These all effect the whole molecule and are around the 60cm-1 mark, a very low energy vibration. These will relate to the 3N-6 vibrations in the molecules. Because in each of these photos all of the bond are moving in asymmetric wagging motions, these are likely to be low energy thermal excitations in the IR region from the temperature in the air (kT).
| Isomer | Low freq 1 | low freq 2 |
| Trans | 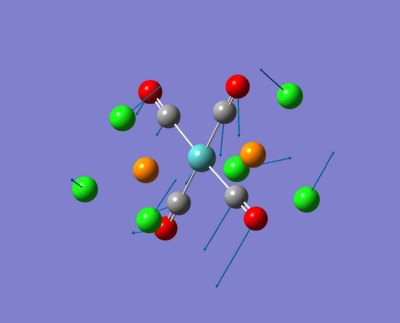 |
|
| Cis | 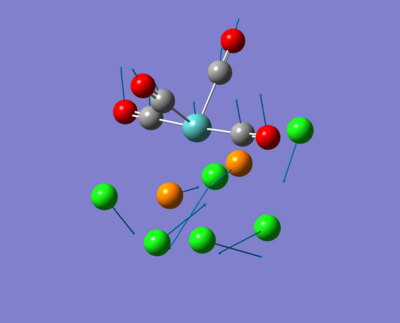 |
|
Energy
| Form | HF | KJmol-1 |
| Trans | -623.541398310529 | -1637.109357 |
| Cis | -623.235423787992754 | -1637.111931 |
These energies when taken to a reasonable significant number of figures are almost exactly the same with the cis being very very slightly more stable.
The different in energy between the cis and the trans is: 2.574Jmol-1. This is a tiny tiny amount compared to the thousands of kilojoules.
The reason that the cis isomer is slightly more stable is to do with the back bonding into the C=O ligands. In the trans configuration, the C=O ligands opposite each other will be competing for the back donation off of the same metal d-orbital. This means there will be less back bonding in total as some of the orbitals on the metal aren't in the correct geometry to donate into an empty C-O anti bonding orbital. With the cis configuration, more d-orbitals on the Mo are available for back bonding due to the geometry and so there is a slightly higher stabalisation in energy. You can see this is clearly a small amount though and that the molecules are extremely close in energy.
Comparisons in bond lengths
| Form | Bond | Computational (A) | Literature (A)[4] |
| Trans | Mo-P | 2.48 | Mo-P 2.500 |
| Cis | Mo-P | 2.53 | - |
The computational length for the trans isomer is highly comparable to the literature value. Especially when you are comparing two molecules that are slightly different (Cl in computational compared with Ph in reality).
Unfortunately a literature value for the cis isomer could not be found in any journals. The reference states that "in trans-[Mo(CO)4(PPh3)2, little deviation from ideal octahedral geometry is seen and the Mo-P bond length of 2.500( I ) A is significantly shorter than those found in the cis isomer." This suggests that the cis isomer is longer than the trans. This is indeed the case in the computed case with the cis being 0.05A larger.
The angle of the Cl-Mo-Cl bond in my calculation was 93.9. In the reference, it was stated that the bond angle is 104.5. This quite large deviation from the ideal octohedral geometry is to do with the large PPh3 cones which, due to sterics, push this angle out wider. This is where the computational analysis falls down and it actually quite incorrect. This probably would have been picked up in geometry optimisation if the full calculation had been done with PPh3 as opposed to PCl3.
Cis P-Mo-P angle of 104.5. My angle Cl-Mo-Cl 93.9. This is becuase in reality, large cone of PPh3 distorts octahedral geometry to alrger bond.
Project
Introduction
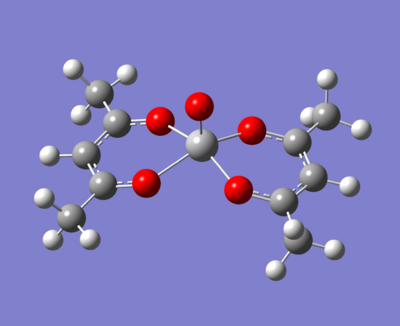
The molecule under investigation is called Vanadyl acetylacetonate [V(O)(acac)2]. This is illustrated below. Is is of neutral charge. This is becuase the double bonded oxygen on the top are two x-type ligands, creating a +2 charge. The acac- (acetylacetonate anion) is an anion and so with two of these, the charge balances out to zero.
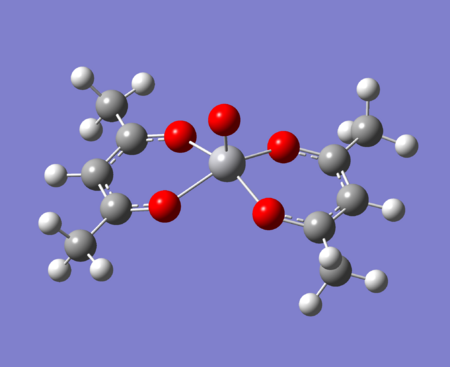 |
The aim of the project is to look at how the charge distribution around the molecule is effected when changing the methyl groups on the acac with electron donating and electron withdrawing groups.
Literature[5] states that the vanadium complex will readily form different complexes with N-donor ligands which will come in underneithand occupy a site trans to the V=O bond. I aim to do a molecule NBO analysis of the various molecules and look to see if there are open orbitals to attack in the geometry trans to the V=O bond.
Initially when running calculations, I accidently put a charge of +2 on the molecule and ran all of the calculations (optimisation, NBO, etc.). Although this is actually wrong, it has given me the opportunity to compare the molecules as essentially I have ripped two electrons away from the system.
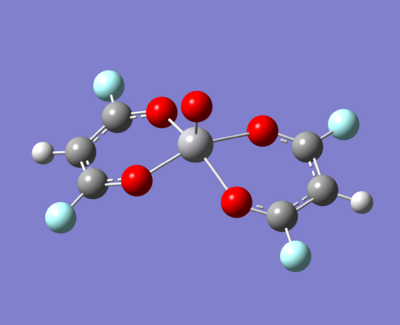
The there molecule under investigation are replacing the methyls on acac with:
- An electron donating group (NH2)
-The normal methyls
- An electron withdrawing group (fluorine)
These are as below:
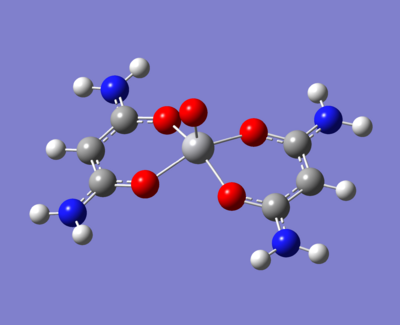 |
 |
 |
Optimisation
The first thing to do was optimise the structure of the molecule. This was initially done using chemdraw to get the molecule looking approximately correct (simple MM2, then moving the molecule around until it looked right). Then a loose optimisation was done with gaussian using basis set:
# opt=loose b3lyp/lanl2mb geom=connectivity DOI:1042/to-2681
From here a fine optimisation was done using the basis set:
# opt ub31yp/lanl2dz geom=connectivity int=ultrafine scf=conver=9 DOI:10042/to-2748
Notice the 'u' in front of the 'b3lyp' basis set. This is becuase the molecule has an un-even number of electrons and so it must be run as an unrestricted shell calculation. This menas that the spin up electrons are analysed completely seperate to the spin down electrons. This results in a set of 'alpha' and 'beta' molecular orbitals.
An NBO calculation was then done on the molecule using the basis set:
# ub3lyp/lanl2dz pop=nbo geom=connectivity DOI:10042/to-2751
A loose(DOI:10042/to-2759 ), fine(DOI:10042/to-2760 ) and NBO(DOI:10042/to-2762 ) calculation was then done for the nitrogen complex. Becuase the fluorine complex was so similar to the normal complex (without the methyl hydrogens), just a fine optimisation(DOI:10042/to-2764 ) and an NBO(DOI:10042/to-2762 ) calculatino were done.
The outcome of this is some interesting differences in the angle of the three systems. The planar 'rings' on each side of the molecule all have different angles.
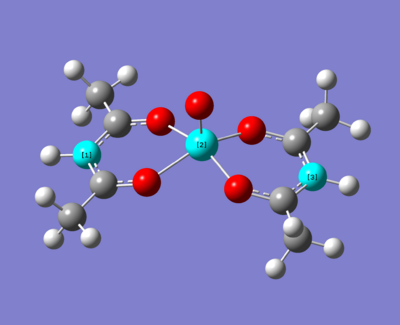 |
Here is a table of the angles:
| Complex | 1-2-3 angle |
| EDG (NH2) | 152.572 |
| acac | 150.838 |
| EWG (F) | 145.613 |
It would seem that the more electron donating the substituent, the larger the angle and the flatter the square planar complex is.
Charge distribution
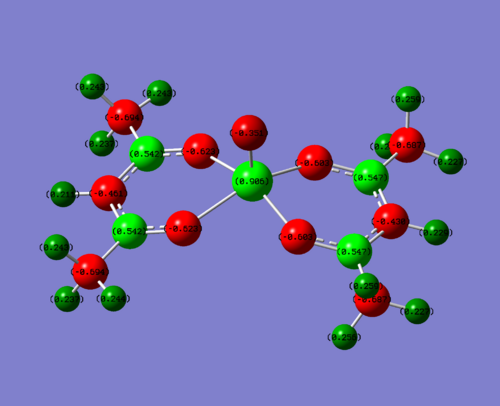
Below is the NBO analysis for the NBO charges on each atom in the vanadium complexes. This is calculated why looking at the charge on the molecule and then what the occupancy of the natural bonding orbitals are around this molecule. For example, if the occupancy is less than it should be (electrons have been withdrawn due to electronegative atom), then you would expect to see a positive charge.
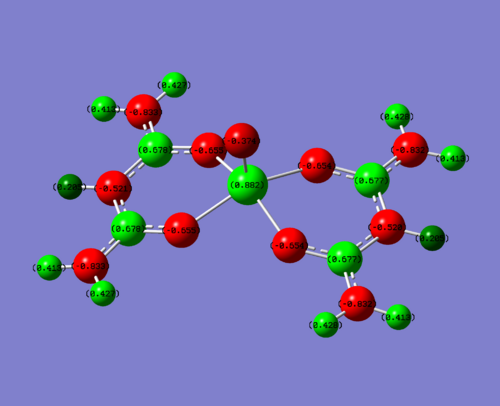 |
 |
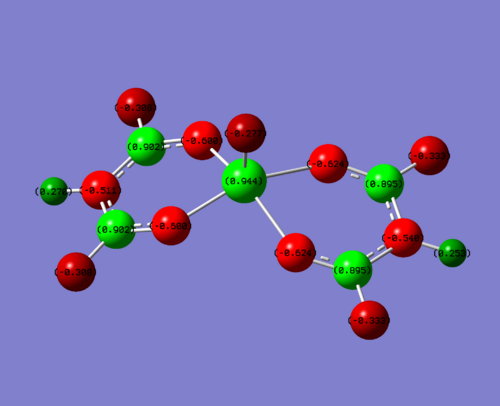 |
| Complex | NBO charge on V | NBO charge hetero | NBO charge on carbon attached to hetero | Charge on O of V=O |
| EDG (N) | +0.882 | N = -0.833 | 0.678 | -0.374 |
| Me | +0.906 | Me(C) = -0. | 0.542 | -0.351 |
| EWG (F) | +0.944 | F = -0.308 | 0.902 | -0.277 |
To clarify, the values stated above are for one of the four sections of the molecule. The charge is very similar throughout hte molecule, changing slightly in the 3rd d.p. This is due to the non-symmetrical nature of the molecule. For this discussion, this level of accuracy is not needed as it is purely a qualititive discussion.
So what can be deduced from this? Obviously, you would expect for the donating groups to donate electrons into the field creating more negative charge and the withdrawing groups to take electrons away, creating a more positive charge. This is indeed what you see, but how large is the effect?
The metal vanadium centre is three bonds away, and so is quite a large distance to be feeling the effects of the groups. But it does so. In the electron donating complex, the positive charge is 0.024 less than the initial acac complex. This is quite a significant difference (2.7% less) considering it is there bonds away and so this compositive electron donating effect from the N lone pair donating into the complex has had a large effect. The electron withdrawing fluorines have made an even larger difference, this time increasing the charge on the vanadium by 0.038 (4.2%). This is again a significant difference for three bonds through a molecule. This is due to fluorine being the most electronegative element on the periodic table.
One of the most interesting molecules to look at is the carbon attached to the electron hetero groups (NH2, Me, F). This displays some strange phenomena. It is positive for the acac complex (0.542) and ever more positive for the F complex (0.902). You would expect then for the electron donating NH2, it would be less positive. But it is actually more positive (0.678) than the Me complex. So what is going on?
To explain this, a basic hypothesis can be proposed. Looking at the Me and F complexes temporarily, you can see that there is likely to be electron density being pulled through the framework in an inductive effect to give this positive charge on the metal centre. It also looks like the bonds have highly ionic character in a very nice oscillating fashion. For example, the fluorine has a negative charge on it due to its electron withdrawing effects onto intself, the carbon next to it will have some kind of induced positive charge due to the negative nature of fluorine. There is then another electron withdrawing oxygen atom next to this carbon which will have a slightly greater negative charge on it due to the ionic positive nature of the carbon. The Vanadium centre then feels this effect as well, also beign slightly more positive.
Thanks to this oscilalting sinusoidal nature of the electronegative and positive atoms, you can easily create this polarising ionic effect to add to the inductive sigma framework. This hypothesis would explain the NBO charges in the Me and F compelxes, but what about the more than expeted electropositive carbon attached to the nitrogen in the N complex?
Here we now have to take into consideration pie interations. In this situation, without the lone pair on nitrogen, you would just have an electronegative atom (nitrogen) on the carbon which would create an ionic and inductive effect through the molecule very much like the fluorine. This is what is happening and is the reason for the high positive value of the NBO charge on the adjacent carbon.
This nitrogen does have a lone pair though and this can donate into the pie system it is adjacent to. The acac system is already a delocalised pie system and so the N lone pair donates electrons into this system which stretches all the way to the metal centre. This extra electron density in the molecule acts as the 'donating' effect, eventually causing the metal centre to have less positive charge than the Me and F complexes. So what we are seeing here is some kind of push pull effect. The lone pair pushing electrons into the system, but the electronegative nitrogen taking them back out. Clearly the pie interactions are a lot larger and so this is the dominating effect that is seen.
So how could this effect be investigated? What you need to do is to disrupt the system and see what kind of an effect there is. We already have one system with pie donation and it would be worth looking to see if another pie doning group acted in the same way. The next thing to do would be to try and disrupt the nice sinusoidal pattern of positive and negative charge. Perhaps by putting in sulphers atom in place of the four oxygens bonded onto the metal. Sulphur is much more diffuse and so would be a good molecule to use to see if this polarising effect was occuring. It would also be good to try and replace the carbon with another atom which is not so easily polarised, although finding something suitable could be difficult.
Molecular orbitals
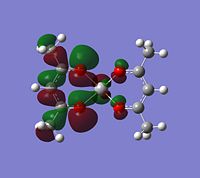
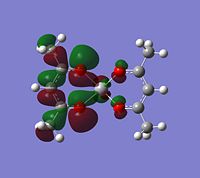
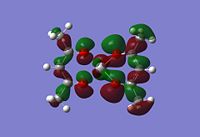
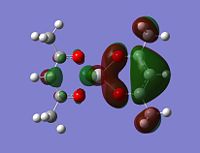
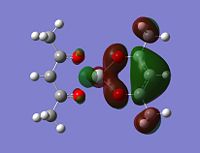
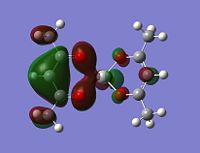
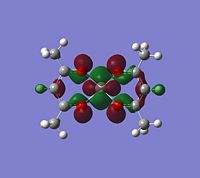
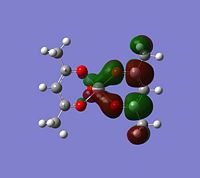
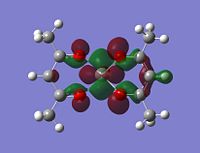
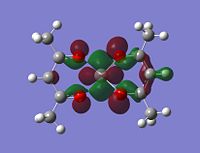
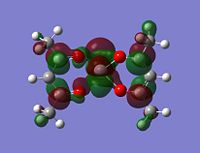
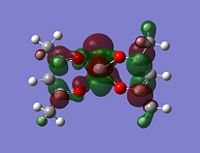
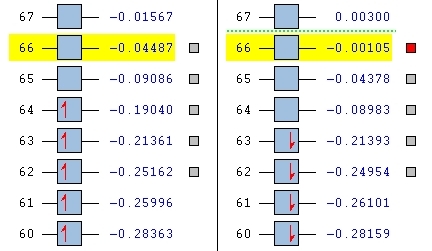
The large table of molecular orbitals below is comparing the orbitals between the normal vandium complex and V2+ complex which has simply had two electrons stripped away from it. The area to look at is orbitals 62-65 as these range from both fully occupied orbitals and fully unoccupied orbitals, as in the images below:
 |
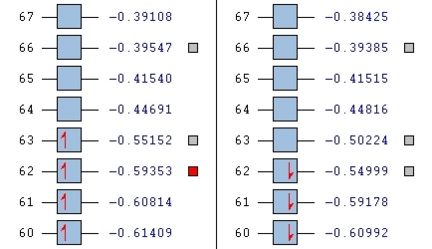 |
Notice how the alpha has one more electron than the beta. This is due to un-even number of electrons in the molecule and is the reason why the un-restricted method had to be used.
Now that we have the orbitals sitting relative to their energy levels, we can analyse which look similar, and what they actually mean.
Firstly, looking at level 62, you can see for the alpha and beta V complex and for the alpha of the V2+, the orbtials are similar. They are quite nodal with electron density focusing on the bonds attached to the metal. They are very much ligand based rather than orbital based. What this means is that the electron density focuses around the sigma bonds linking the metal to the ligand rather than coming out of the metal itself (like a d-orbital might). This is the same for the level 62 V2+ Beta HOMO. There is a large orbital density over the metal and the oxygens linking the ligand to the metal. In this orbital, it it showing the highest energy bond, which in this case seems to be the one attaching itself to the ligand.
Looking at level 63, all of the orbitals look very similar, again ligand metal focused as opposed to metal orbitals. We see the first LUMO (V2+ beta), which is very similar to the HOMO above it in the table, but inversed.
Level 64 is the first time you see orbitals that are centred off of the metal. For V, it looks like an anti-bonding orbital, but it is infact a HOMO. On closer inspection, you can actually see that the d orbtials from the metal seem to bond with the anti-bonding orbitals on the oxygen. It looks like there are 5 planes going vertically through the molecule, red, green, red, green, red. All of these planes are bonding to some extent.
Level 65 is quite similar to all before it, with heavily ligand focused orbitals over-lapping with the metal for V. For V2+, the first metal orbitals pointing down into the plane appear. These are interesting as we know the molecule is open to nucleophilic attack from nitrogen based molecules.
Comapring across the whole table, there are no hugely noticable patterns that arise. In some cases, the beta HOMO maps onto the V2+ beta HOMO. But then the alpha HOMO doesn't seem to map at all onto the V2+ alpha HOMO when you might expect it to. In general, the lower energy HOMO's and lower LUMO's seem to be fairly ligand-metal bond focused. When you go into the higher LUMO's the orbitals get much more metal focused looking like d-orbitals.
N donor complexes
As stated in the introduction, the molecule is open to attack from N donor ligands. If this is the case, you would expect to find an empty orbital on the metal which the N-donor can attack.
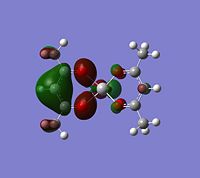
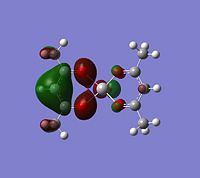
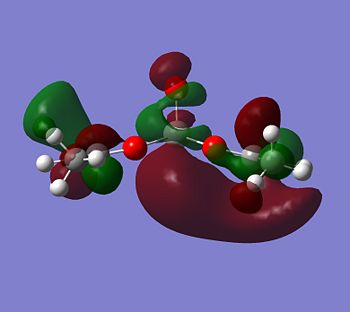
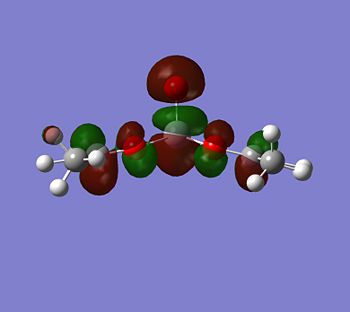
But how is it going to attack, what kind of an orbital are you looking for? Well the N-donor is going to be nucleophilic and will have a delta negative charge. The top face of the molecule is compeltely protected, almost shielded by the negative charges on the 5 oxygens. This leaves the only place open for attack the bottom face. This bottom face is also very open sterically.
With this all being the case, the most obvious orbital to look for would be one pointing down out of the metal, parallel with the V=O bond.
 |
 |
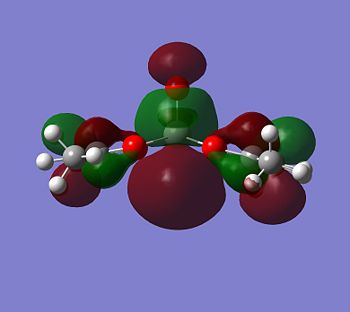 |
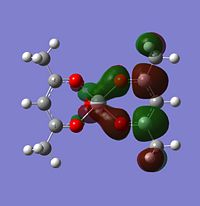
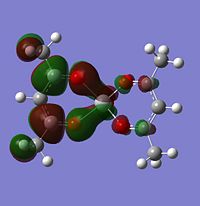
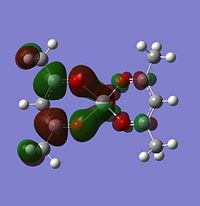
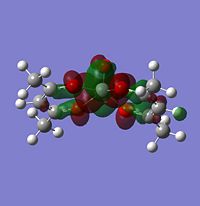
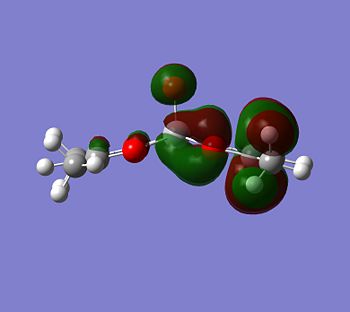
Although the energy level 68 is quite high, the huge orbital underneigh the metal in the beta unoccupied orbital would leave the molecule hugely open to attack. The orbital mainly comes off of the metal and does not seem to be massively tied in with the rest of the molecule. It could even be a non-bonding orbital. This would mean that filling this orbital with electron density would probably not destabalise the molecule. It does not go in an anti-bonding fashion across any bonds (which would be weakened if filled with electron density). Again suggesting it is a non-bonding orbital. This is the same for the alpha unocupied orbital in level 69. This means that if the nitrogen donor ligands were to attack in these orbitals, the molecule would actually be more stable as you would probably lower the energy of hte orbitals as they seem quite happy to accept electron density.
 |
 |
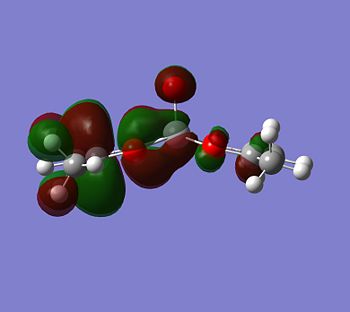 |
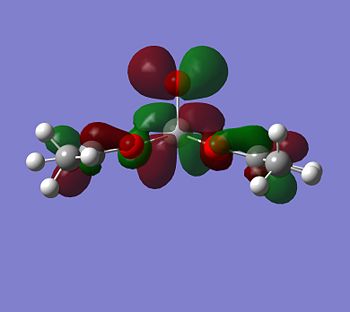
If you look for orbitals which are a bit lower in energy, the levels 65 and 66 would except electron density. The level 67 looks like quite a good option, it has an anti-bonding orbital pointing out of the plane at the correct geometry. It seems to be an anti-bonding orbital which could weaken some of the single C-O bonds in the complex, but other than this, it could also be a good palce to attack.
Conclusion
In conclusion, I have managed to make some good estimations about how the charges on my system are affected by changing the functionality on ym ligand. I have been able to make an attempt at explaining some interesting phenomena and come to a reasonable explaination, whilst still leaving it open for further research.
On the orbital front, I have managed to compare a system with a fewer number of electrons and seen how this effects the systems orbitals. From here, conclusions have been drawn about how the system might come under attack from nitrogen ligand donors and orbitals have been given to show where and how this might occur.
References
- ↑ M. Atoji and W. N. Lipscomb – B-Cl Distance in Boron Trichloride - J. Chem. Phys. 27, 195 (1957)
- ↑ Taken from world wide wed: http://pslc.ws/macrog/irabs.htm
- ↑ Taken from Hunt Research Group page on the worldwide web: http://www.ch.ic.ac.uk/hunt/teaching/teaching_comp_lab_year3/10c_MoC4L2_freq.html
- ↑ DOI:10.1016/S0020-1693(96)05133-X & DOI:10.1021/ic00134a075
- ↑ C. E. Housecroft and A. C. Sharpe - Prentice Hall publishers - 2004 - pages 604-605

