Rep:Mod:SJCryer Module1 Project
Minfiensine - a comparison of real and predicted spectroscopic data
Introduction

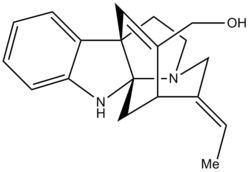
In this project I hope to compare the 13C NMR data for the E- and Z- isomers of Minfiensine. The molecule is taken from an article [1] successfully synthesising the natural product Minfiensine(+). Unfortunatey, there is only 13C NMR data for the E- isomer and so therefore I can only do a direct comparison with this. Due to the structural integrity of the complex ring systems though, the whole molecule should hardly change between the E- and Z- isomer. Hopefully the predicted NMR should correlate to both the E- and Z- isomers, but more to the E- than the Z-. I also hope to look at the predicted optical rotation against given data and compare this to natural minfiensine data.
The crucial step in the picture below is the step '19' to product. Here is where the di-olefin gets converted to the trans-ethylidiene by 10% Pd/C and H2 in THF at -15 °C. The OTES group is then de-protected with TFA to give the OH group and product.

MM2
The first thing to do was to draw both the isomers using ChemBio3D. I then used the MM2 energy minimisation to give an estimate of how the molecules should differ in energy and conformation between the two isomers. As expected, the energies were very similar with the E- and Z- being 135.7788 kJ/mol and 135.8633 kJ/mol respectively. This strongly suggests that the main structure of the molecule is dictated by the complex ring systems and the change between E- and Z- on the peripheral hardly changes the structure.
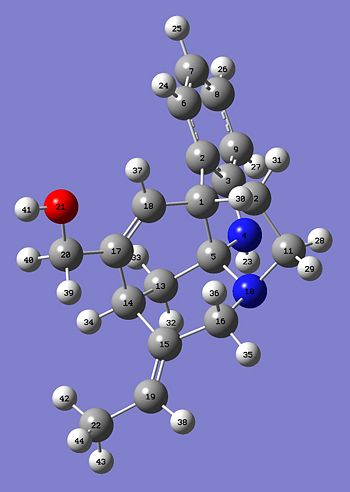
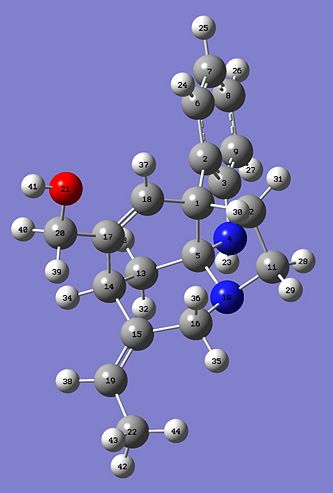
Hopefully this will demonstrate that there should only be small differences in the two predicted 13C NMR and hopefully the E- and Z- should closely correlate. Here are the two Jmol images of the E- and Z- isomer.
13C NMR[2]
The table below shows all of the shifts for the E and Z isomers and assigns peaks on the spectrum to actual molecules. The column labelled "shift (ppm) E relates to the calculated spectrum and thte column "Atoms E" relates to the atom number depicted in the pictures below the table. The column E real is the real spectroscopic data taken from the journal. There is then a calculation to see how much the predicted data for E and Z deviate from the given data.
Both of them are very similar with the average difference being only 2.88ppm for the E isomer. The average difference is a bit higher (3.62ppm) for the Z deviation, but this is highly expected as you are comparing a Z isomer predicted NMR with the real data for the E isomer. What is does show though is that for thsi very rigid molecule, the E and Z isomer are hardly different.
The last column is the deviation between the E difference and the Z difference. This tells you the shift difference between E and Z. Notice that for the most important molecules, the three carbons in my E/Z isomer, the differences in shift between them is 0.17, 0.47 and 0.67 respectively. These seem to be quite small differences and it shows that the calculation seems to be a very good guess. It would be very hard using 13C NMR to differentiate between the two isomers. Other techniques might have to be used!
Perhaps using an NOE spectrum or calculating coupling constants would let you differentiate between the two molecules in the lab.
| ' | Shift (ppm) E | Atoms E | ' | Shift (ppm) Z | Atoms Z | ' | E Real | ' | E Deviation | Z Deviation | ' | Differences |
| 143.35 | 3 | 143.39 | 3 | 147.4 | 4.05 | 4.01 | 0.04 | |||||
| ring-C=C-CH3 | 134.27 | 15 | 134.44 | 15 | 141 | 6.73 | 6.56 | 0.17 | ||||
| 134.17 | 17 | 134.26 | 17 | 135.8 | 1.63 | 1.54 | 0.09 | |||||
| 132.39 | 2 | 132.26 | 2 | 133.4 | 1.01 | 1.14 | 0.13 | |||||
| 123.77 | 8 | 123.75 | 8 | 127.7 | 3.93 | 3.95 | 0.02 | |||||
| 123.57 | 18 | 122.88 | 18 | 124.6 | 1.03 | 1.72 | 0.69 | |||||
| 119.60 | 6 | 119.62 | 6 | 122.6 | 3.00 | 2.98 | 0.02 | |||||
| ring-C=C-CH3 | 117.86 | 19 | 118.33 | 19 | 119.4 | 1.54 | 1.07 | 0.47 | ||||
| 113.93 | 7 | 113.92 | 7 | 118.4 | 4.47 | 4.48 | 0.00 | |||||
| 105.22 | 9 | 105.23 | 9 | 109.8 | 4.58 | 4.57 | 0.01 | |||||
| 91.35 | 5 | 91.37 | 5 | 90 | 1.35 | 1.37 | 0.01 | |||||
| 63.16 | 20 | 62.87 | 20 | 66.6 | 3.44 | 3.73 | 0.29 | |||||
| 57.18 | 1 | 57.37 | 1 | 55.3 | 1.88 | 2.07 | 0.18 | |||||
| 55.94 | 16 | 54.26 | 11 | 53.7 | 2.24 | 0.56 | 1.68 | |||||
| 54.10 | 11 | 47.98 | 16 | 53 | 1.10 | 5.02 | 3.92 | |||||
| 42.04 | 12 | 44.45 | 14 | 38.2 | 3.84 | 6.25 | 2.42 | |||||
| 35.56 | 14 | 42.14 | 12 | 31.9 | 3.66 | 10.24 | 6.58 | |||||
| 35.56 | 13 | 35.71 | 13 | 31.3 | 4.26 | 4.41 | 0.15 | |||||
| ring-C=C-CH3 | 14.84 | 22 | 15.50 | 22 | 13.8 | 1.04 | 1.70 | 0.67 | ||||
| Average difference | 2.88 | 3.55 | ||||||||||
 |
 |
Infrared spectrum analysis
Optical rotation
I was very much hoping to do some analysis on the optical rotation values for my molecule as I had literature values for this! Unfortunately, the first calculation I sent off to the supercomputer (uesday) took just under 29 hours to run and then failed. The second attempt which was put onto the supercomputer the next day (friday) at mid-day and is still running! Perhaps I can add this data after the deadline!
References
- ↑ Spencer B. Jones, Bryon Simmons and David W. C. MacMillan - J. Am. Chem. Soc., 2009, 131 (38), pp 13606–13607 DOI: 10.1021/ja906472m
- ↑ E 13C NMR DOI:10042/to-2519 . Z 13C NMR DOI:10042/to-2520
