Rep:Mod:SJCryer Module1
Introduction
The following wiki contains a look into using molecular modelling to analyse various molecules on a mechanical and orbital basis. The workup and skills learnt in the first section culminate in doing a mini project on using computational chemistry to analyse an organic isomer.
Section 1 - The Hydrogenation of Cyclopentadiene Dimer
J Mol images
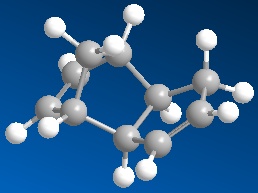
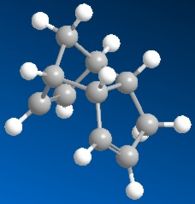
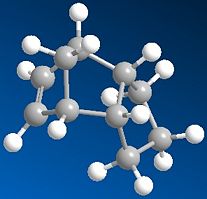
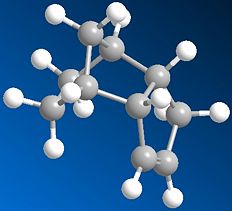
Please click on the button under each image to view the Jmol image of each compound.
 |
 |
 |
|
Comparisons
1 & 2
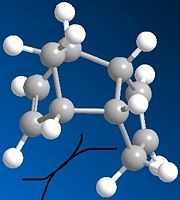
Looking at the two cyclopentadiene stereoisomers(1&2), the most thermodynamically stable molecule is number 1, the exo product (31.890kcal/mol). The endo product is higher in energy at 34.015kcal/mol. This stability trend is also illustrated in the torsion, with the exo product (7.676) being a lot lower and therefore more stable than the endo product (9.504). One of teh reasons fo the higher energy is likely to be due to steric strain from the hydrogens on the end of the double bond and the pentane ring on the opposite side of the molecule. The Van de Waals forces are also very slightly higher in the endo product. This is most likely to be from the 1,4 strain from the hydrogen on the top of the bringing carbon to the cyclo-pentane ring hydrogens. These are at 0o rather than a preffered 60o.
Because we know that the endo product is formed (which is thermodynamically less stable), you can deduce that this is the kinetic product being formed. The reason that this reaction is kinetic is to do with a lower energy transition state for the endo product than the exo. This is due to greater p-orbital overlap when the starting products come into the the endo transition state. This lower transition state allows the endo product to be quickly formed before the more thermodynamically stable exo can.
3 & 4 - The hydrogenation of cyclopentadiene
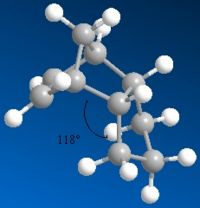
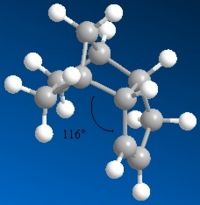
In molecules 3 and 4, the most thermodynamically stable product is molecule 4 (31.154kcal/mol) compared with molecule 3 (35.691kcal/mol). The most likely reason for this is to do with the bend energy. This is much higher in molecule 3 (19.83kcal/mol) compared with molecule - 4 (14.509kcal/mol). The higher bend energy in molecule 3 is due to more steric hinderence between the double bond and the hydrogens on the end of the pentane ring. You can see this pushes out slightly (almost looking like the tip of a chair form cyclohexane) becuase of the extra hydrogen. You can see this bond angle is more strained at 118° rather than the preferred tetrahedral 109.5° (sp3). There is still a strain value for molecule 4, but this is lower and is exhibited with an angle 2° closer (116°) to tetrahedral than molecule 3. Because molecule 4 has the lowest energy, it will be the thermodynamic product.
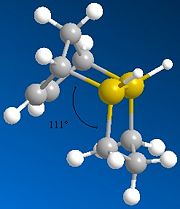
Other molecules exhibit different bond angles and lengths, so by putting in different atoms, you could effectively design your molecule. In the third photo below, two of the carbons in molecule 3 have been replaced by sulphurs, therefore lowering the bond angle from 118° to 111°. The energy of the molecule has also been lowered from 35.691kcal/mol down to 31.850kcal/mol. This is due to a longer bond length, giving the whole molecule more room to move and minimise its energy. The bend value has actually gone up to 29.461kcal/mol, but the big energy difference is the torsion, lowering by around 12kcal/mol to -2kcal/mol and therefore actually stabalising the molecule!
| Hydrogenation Product | Energy (kcal/mol) | Bend Energy (kcal/mol) | Angle |
| 3 | 35.691 | 19.83 | 118° |
| 4 | 31.154 | 14.509 | 116° |
| 3 (sulphur) | 31.850 | 29.461 | 111° |
 |
 |
 |
Section 2 - Stereochemistry of Nucleophilic additions to a pyridinium ring (NAD+ analogue).
NAD+ analogue - Molecule 5
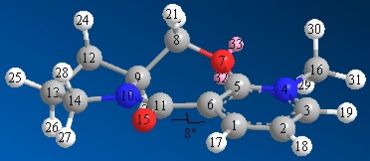
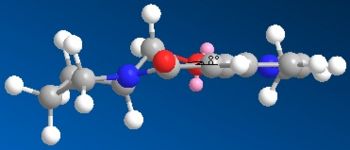
Having looked at different conformations of molecule 5, the one depicted below is the lowest in energy (43.167kcal/mol). Other conformations tried were with the carbons labelled 12 and 8 pointing down instead of up. This gave a -9 angle° and an energy at above 50kcal/mol. Different conformations gave much higher energies and had the oxygen pointing the wrong side to give the required selectivity.
 |
 |
 |
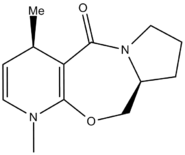 |
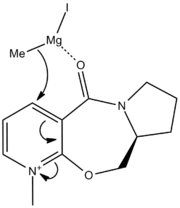
Figures 1 and 2 above show how the oxygen carbonyl group sits 8° above the plane of the benzene ring. When the Me-Mg-I comes in, the Mg co-ordinates with the carbonyl oxygen and this puts the Me group sitting above the C-H bond (figure 3). The Me-- then attacks the carbon from the top face every time, giving the absolute stereochemistry in pictured in figrue 4.
NAD+ analogue - Molecule 7
 |
 |
 |
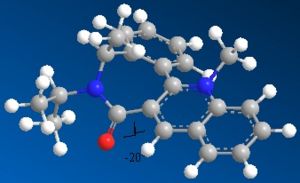
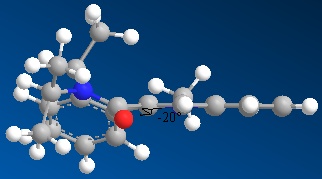
In this molecule, the oxygen sits below the plane of the ring system next to it by 20°. This time, there is no co-ordination to the oxygen as you are attacking directly with the lone pairs off of the nitrogen. These lone pairs actually repel against the lone pairs on the oxygen, leading to the attack being least stericaly hindered on the top face (if the oxygen is percieved to be pointing down).

These two models are quite crude in that they really only take into account sterics, basic lone pair interactions and diapole forces. They do not consider orbitals at all. You might try and make an analogy with similar molecule and it actually give a different outcome. Potentially there could be orbital overlap or donation into an empty orbital that could lead to a different steric otucome to the one predicted from this simple model.
Section 3 - Stereochemistry and Reactivity of an Intermediate in the Synthesis of Taxol.
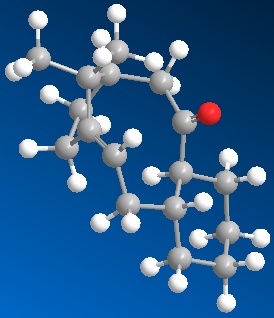
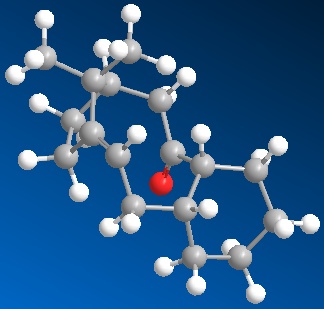
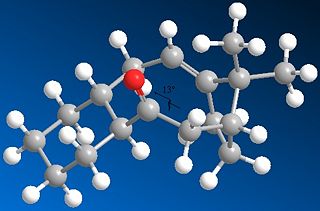
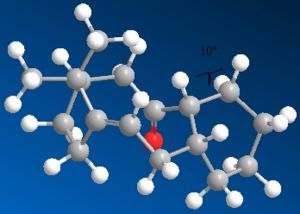
Firstly the two molecules of taxol were drawn in ChemBio3D. These were then minimised with the MM2 energy minimisation. Both were above 52kcal/mol. Through then fiddling with the cyclohexane ring on the end, you could lower the energy even more. The cyclo-hexane ring was moved into a chair conformation with taxol 10 and some kind of twist chair with taxol 11. As demonstrated by the images and Jmol files below:
 |
 |
| Energy (kcal/mol) | Torsion (kcal/mol) | Dihedral Angle | Dihedral distance (A) | |||||||
| Taxol 10 | 41.804 | 17.317 | 13° | 2.456 (OH) | ||||||
| Taxol 11 | 49.884 | 3.026 | 10° | 2.242 (HH) |
When using the MM2 minimise energy function, you have to be careful as it will not always find the total minimum energy of the molecule (most thermodynamically stable state). It will only find the local minimum energy by moving the bonds minimally. To try and get the total thermodynamic minimum you have to look at the molecule and try and see where there are stresses and strains and see if by moving the molecule around and re-applying MM2, the molecule will be in a lower energy state. Having done this for both taxol 10 and 11, I believe they are at their thermodynamically most stable and not stuck in a local minimum.
The most thermodynamically stable molecule is taxol 10 with an energy of 41.804kcal/mol. Taxol 11 is less stable at a higher energy of 49.884kcal/mol.The main contribution of this energy is the torsion figure being around 7kcal/mol higher. This is to do with the dihedral angle around the oxygen. In taxol 10, the dihedral angle between the oxygen and the hydrogen is 13° making the 1,4 distance between them 2.456A. This is compared with taxol 11 which has a dihedral angle of 10° and a 1,4 distance of only 2.242A. This is why the torsion strain is so much higher in taxol 11, resulting in a higher energy molecule. It is worth noting that the optimum dihedral angle would be 60°.
 |
 |
The whole reason for the high stability of these molecules is becuase they are referred to as "hyperstable olefins"[1]. A hyperstable olefins is described as a molecule where the alkene is actually less strained than the hydrogenated alkane. Not only are they less strained, they also sometimes add to the stability of the molecule (providing a negative stabalising energy value). In this case, t=he stabalsing energy comes from the alkene sitting next to the bridgehead.
Section 4 - Regioselective Addition of Dichlorocarbene
 |
 |
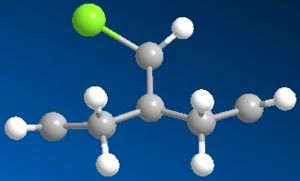 |
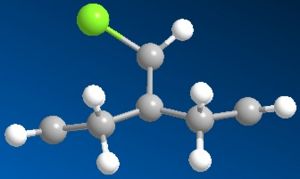
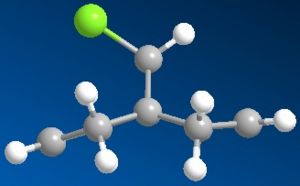
Firstly I ran the MM2 and this gave a slightly bent ring system where the whole molecule looks quite symetrical. After running the PM6, the ring system underneith the chlorine bent further away from it. RM1 was really quite similar to the original MM2.
Molecular orbitals
| Molecule 12 | Hydrogenated Molecule 12 | |
| HOMO-1 | 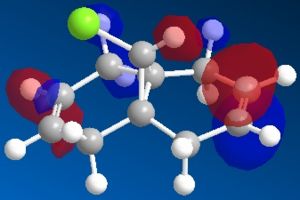 |
|
| HOMO' | 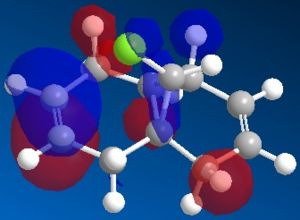 |
|
| LUMO | 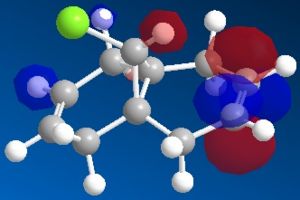 |
|
| LUMO+1 | 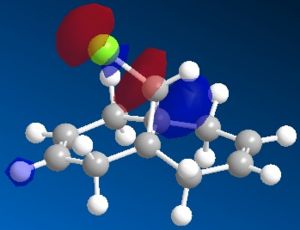 |
|
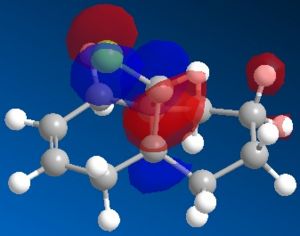
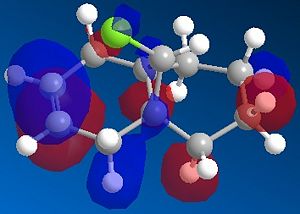
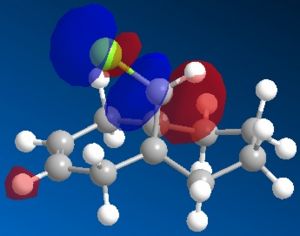
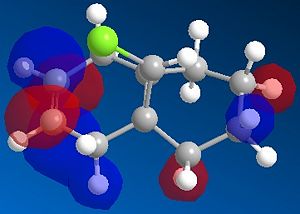
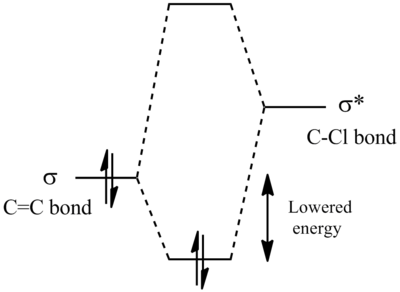
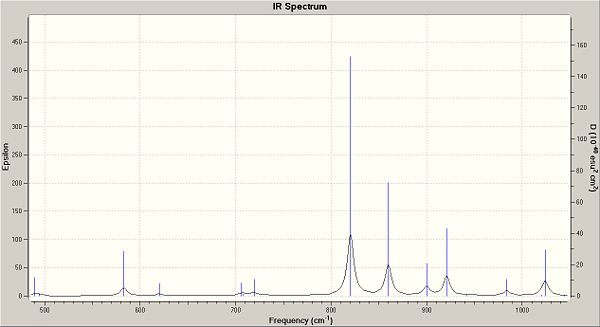
The most interesting orbitals here are the HOMO-1 and LUMO+1. The HOMO-1 has a large area of electron density in an orbital over the pie bond that is anti to the Cl-C bond. The LUMO+1 of molecule 12 has an anti-bonding orbital (you can see from the nodes) that is very close to the HOMO-1 pie bond. If these are of the correct symmetry, then electron density can donate into this anti-bonding orbital, lowering the energy of the whole system (like the MO diagram below). The extra electron density in this LUMO+1 anti bonding orbital weakens the C-Cl bond.
 |
When you desaturate the bond anti to the C-Cl bond, you would then expect there to be no pie cloud, so no electron density and so a stronger C-Cl bond. Looking at the molecular orbitals, there is no similar pie cloud in any of the occupied orbitals that could donate electron density. The LUMO is an anti-bonding orbital which could accept electron density, but there is no electron cloud to donate into this.
This theory can be proved through spectroscopy:
Spectroscopic analysis
| Bond | Saturated freq | Saturated Energy (J) | De-saturated freq | De-saturated Energy (J) |
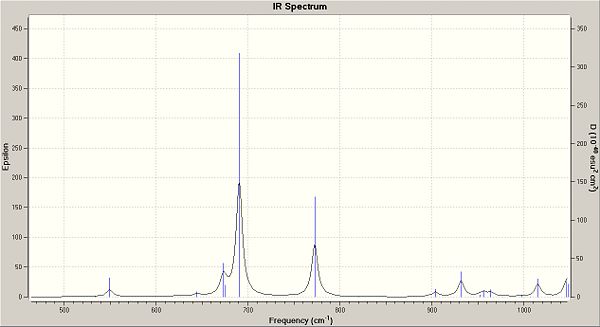
| C-Cl | 772.51 | 2.32E+13 | 859.82 | 2.58E+13 |
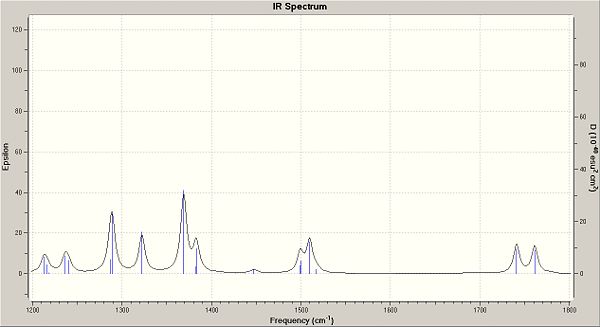
| C=C (anti to Cl) | 1740.83 | 5.22E+13 | 1839.5 | 5.51E+13 |
| C=C (syn to Cl) | 1761.08 | 5.28E+13 | -- | -- |
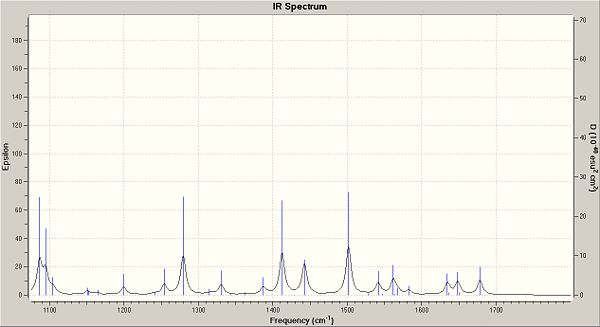
You can clearly see from the table above that the bond strength for the C-Cl in the de-saturated molecule has increased. This suggests that when the molecule is saturated, it donates electrons into the C-Cl anti-bonding orbital, weaking the bond. Below are the IR spectrums for important regions, showing the shifts between the two molecules.
 |
 |
 |
 |
Nucleophilic attack
If a nucleophile was to come into the molecule to attack, it would most likely attack the LUMO+1 weakened C-Cl bond from behind in an SN2 fashion. It is the bonds weakness and the large empty (LUMO+1) orbital that leads the attack to happen here.
Electrophillic attack
The HOMO and HOMO-1 display the biggest areas of electron density, and so it would be these orbitals that would be succeptible to attack from an electrophile. The HOMO and HOMO-1 is over the pie orbitals and we know that these are electron rich bonds bonds. It is then quite sensible to think that these electron rich areas will be the most open to electrophillic attack.
Minfiensine - a comparison of real and predicted spectroscopic data
Introduction
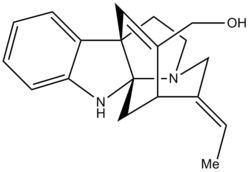
In this project I hope to compare the 13C NMR data for the E- and Z- isomers of Minfiensine. The molecule is taken from an article [2] successfully synthesising the natural product Minfiensine(+). Unfortunatey, there is only 13C NMR data for the E- isomer and so therefore I can only do a direct comparison with this. Due to the structural integrity of the complex ring systems though, the whole molecule should hardly change between the E- and Z- isomer. Hopefully the predicted NMR should correlate to both the E- and Z- isomers, but more to the E- than the Z-. I also hope to look at the predicted optical rotation against given data and compare this to natural minfiensine data.
The crucial step in the picture below is the step '19' to product. Here is where the di-olefin gets converted to the trans-ethylidiene by 10% Pd/C and H2 in THF at -15 °C. The OTES group is then de-protected with TFA to give the OH group and product.

MM2
The first thing to do was to draw both the isomers using ChemBio3D. I then used the MM2 energy minimisation to give an estimate of how the molecules should differ in energy and conformation between the two isomers. As expected, the energies were very similar with the E- and Z- being 135.7788 kJ/mol and 135.8633 kJ/mol respectively. This strongly suggests that the main structure of the molecule is dictated by the complex ring systems and the change between E- and Z- on the peripheral hardly changes the structure.
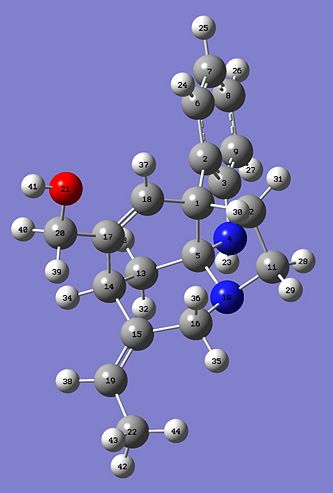
Hopefully this will demonstrate that there should only be small differences in the two predicted 13C NMR and hopefully the E- and Z- should closely correlate. Here are the two Jmol images of the E- and Z- isomer.
13C NMR[3]
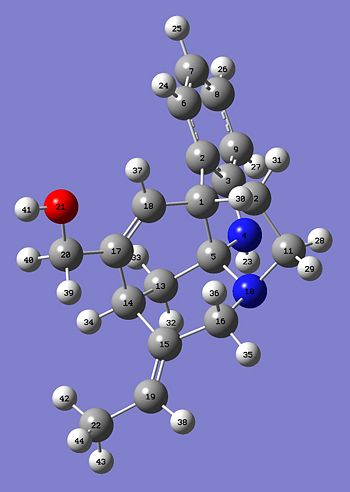
The table below shows all of the shifts for the E and Z isomers and assigns peaks on the spectrum to actual molecules. The column labelled "shift (ppm) E relates to the calculated spectrum and thte column "Atoms E" relates to the atom number depicted in the pictures below the table. The column "E real" is the real spectroscopic data taken from the journal. There is then a calculation to see how much the predicted data for E- and Z- deviate from the given data.
Both of them are very similar with the average difference being only 2.88ppm for the E isomer. The average difference is a bit higher (3.62ppm) for the Z deviation, but this is highly expected as you are comparing a Z isomer predicted NMR with the real data for the E isomer. What is does show though is that for this very rigid molecule, the E and Z isomer are hardly different with the 13C NMR strongly correlating to both isomers.
The last column is the deviation between the E difference and the Z difference. This tells you the shift difference between E and Z. Notice that for the most important molecules, the three carbons in the E/Z isomer, the differences in shift between them is 0.17, 0.47 and 0.67 respectively. These seem to be quite small differences and it shows that the calculation seems to be a very good guess. It also shows that what I originally predicted in that the E would be most accurate with the Z being slightly less is correcet. What this means though is that it would be very hard using 13C NMR to differentiate between the two isomers. Other techniques might have to be used!
Perhaps using an NOE 2D spectrum or calculating coupling constants would let you differentiate between the two molecules in the lab.
| ' | Shift (ppm) E | Atoms E | Shift (ppm) Z | Atoms Z | E Real | E Deviation | Z Deviation | Differences |
| 143.35 | 3 | 143.39 | 3 | 147.4 | 4.05 | 4.01 | 0.04 | |
| ring-C=C-CH3 | 134.27 | 15 | 134.44 | 15 | 141 | 6.73 | 6.56 | 0.17 |
| 134.17 | 17 | 134.26 | 17 | 135.8 | 1.63 | 1.54 | 0.09 | |
| 132.39 | 2 | 132.26 | 2 | 133.4 | 1.01 | 1.14 | 0.13 | |
| 123.77 | 8 | 123.75 | 8 | 127.7 | 3.93 | 3.95 | 0.02 | |
| 123.57 | 18 | 122.88 | 18 | 124.6 | 1.03 | 1.72 | 0.69 | |
| 119.60 | 6 | 119.62 | 6 | 122.6 | 3.00 | 2.98 | 0.02 | |
| ring-C=C-CH3 | 117.86 | 19 | 118.33 | 19 | 119.4 | 1.54 | 1.07 | 0.47 |
| 113.93 | 7 | 113.92 | 7 | 118.4 | 4.47 | 4.48 | 0.00 | |
| 105.22 | 9 | 105.23 | 9 | 109.8 | 4.58 | 4.57 | 0.01 | |
| 91.35 | 5 | 91.37 | 5 | 90 | 1.35 | 1.37 | 0.01 | |
| 63.16 | 20 | 62.87 | 20 | 66.6 | 3.44 | 3.73 | 0.29 | |
| 57.18 | 1 | 57.37 | 1 | 55.3 | 1.88 | 2.07 | 0.18 | |
| 55.94 | 16 | 47.98 | 16 | 53.7 | 2.24 | 5.72 | 3.49 | |
| 54.10 | 11 | 54.26 | 11 | 53 | 1.10 | 1.26 | 0.16 | |
| 42.04 | 12 | 42.14 | 12 | 38.2 | 3.84 | 3.94 | 0.10 | |
| 35.56 | 14 | 44.45 | 14 | 31.9 | 3.66 | 12.55 | 8.90 | |
| 35.56 | 13 | 35.71 | 13 | 31.3 | 4.26 | 4.41 | 0.15 | |
| ring-C=C-CH3 | 14.84 | 22 | 15.50 | 22 | 13.8 | 1.04 | 1.70 | 0.67 |
| Average difference | 2.88 | 3.62 |
 |
 |
 |
 |
 |
Infrared spectrum analysis
| IR E real (cm-1) | IR E predict (cm-1) | IR Z predict (cm-1) | Bonds |
| 2932 | 2946 | 2947 | CH2OH stretching |
| 1609 | 1645.6 | 1645.5 | Benzene C-C's stretching |
| 1464 | 1462.8 | 1462.6 | Bending of H's around CH2OH |
| 1248 | 1256.8 | 1252.5 | Many H's bending |
| 1115 | 1136.9 | 1137.7 | H's and C-C's stretching |
| 908 | 917.7 | 917.6 | C-C's bending |
| 737 | 755.5 | 755.9 | H\'s on benzene bending perpendicular to ring |
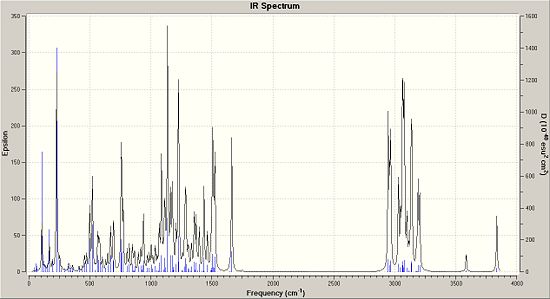
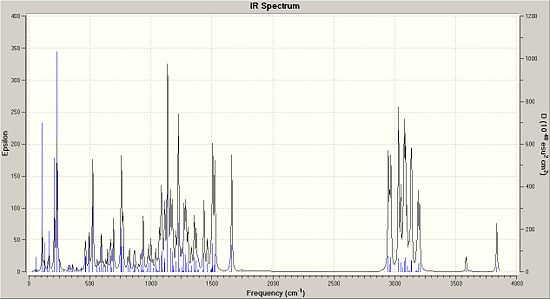
Above is a tabulated set of results of what were the given main IR peaks (un-assigned) in the data and a comparison of what the IR spectrum calculated quantum mechanically were. Interestingly enough, the main peak you would expect to see in theri table would be at 1747cm-1 as this is the main stretching frequency of the C=C bond.
Either the IR spectrum they used in the literature was very poor or the quantum mechanical method is poor. In this instance I think that it is in fact the literature given spectrum that is not up to scratch. It misses out the key C=C stretches and also the key OH peak (3837cm-1). These peaks are where you would expect them to be in the calcualted spectrum and they do not fall out of palce. That said, the spectrums themselves do look quite messy and if IR was not a method the researchers particularly needed, they made have only included the IR values in their supplemnentary data for good practice.
 |
 |
Optical rotation
I was very much hoping to do some analysis on the optical rotation values for my molecule as I had literature values for this! Unfortunately, the first calculation I sent off to the supercomputer (uesday) took just under 29 hours to run and then failed. The second attempt which was put onto the supercomputer the next day (friday) at mid-day and is still running! Perhaps I can add this data after the deadline!
References
- ↑ 'Evaluation and prediction of the stability of bridgehead olefins' - Wilhelm F. Maier, Paul Von Rague Schleyer -Journal of the American Chemical Society 1981 103 (8), 1891-1900
- ↑ Spencer B. Jones, Bryon Simmons and David W. C. MacMillan - J. Am. Chem. Soc., 2009, 131 (38), pp 13606–13607 DOI: 10.1021/ja906472m
- ↑ E 13C NMR DOI:10042/to-2519 . Z 13C NMR DOI:10042/to-2520
