Rep:Mod:SHMod2Inorg
Stuart Haylock - Computational Lab - Module 2 - Inorganic Computational Chemistry Experiments
Aim:
The aim of this experiment is to give an insight into the structure and bonding of inorganic complexes. Inorganic complexes are much more complicated then organic ones, however computational experimentation can prove to be a very useful method of showing why certain complexes form over others and can help with designing catalysts.
Borane BH3 Optimisation
The optimisation of a molecule involves trying different geometries to find the lowest energy one. The process is made of two parts.
- The position of the nuclei is plugged into the Schrödinger equation and is solved for the electrons and energy. (SCF)
- Then the nuclei are moved and the SCF cycle repeated at each geometry, eventually giving the positions with the lowest energy. (OPT)
Each Optimisation then has a method and basis set where the method determines the type of approximations made in solving the Schrödinger equation and the basis set determines how accurately it is calculated (and therefore how long the calculation will take in computational time).
For BH3 the method will be B3LYP and basis set will be 3-21G, these are very low accuracy sets but will provide fast results, also with small molecules the accuracy isn't too much of an issue as there aren't as many factors to take into account.
The bond distance for the optimised BH3 is 1.194Å. The H-B-H bond angle is 120o.
This agrees well with literature values for the bond length of 1.20Å[1]. Also as the boron is sp2 hybridised we expect the bond angles to be 120o. This shows that while the method and basis set are inaccurate they still provide correlated results and are a very good approximation.
| File Name | BH3 OPT |
| File Type | .log |
| Calculation Type | FOPT |
| Calculation Method | RB3LYP |
| Basis Set | 3-21G |
| Charge | 0 |
| Spin | Singlet |
| E(RB3LYP) | -26.46226447 a.u. |
| RMS Gradient Norm | 0.00000434 a.u. |
| Imaginary Freq | |
| Dipole Moment | 0 Debye |
| Point Group | D3H |
| Cpu Time | 30.0 seconds |
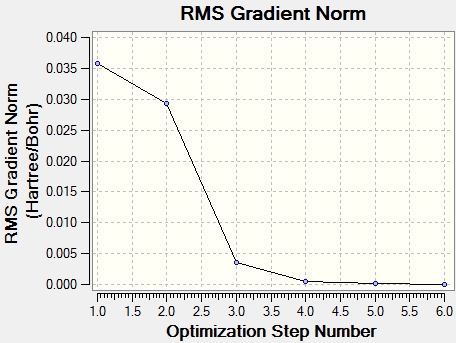
To make sure the that optimisation process has succeeded the RMS end gradient of the total energy against the calculation step must be very close to zero. According to the summary data (above) the gradient was very close to zero indicating that the optimisation worked successfully as the energy has levelled out to to 0.
You can also see that the molecule has D3H symmetry which I know is true from my own symmetry calculations, further showing the optimisation process has worked.
These two graphs further show how the optimisation has worked. The both graphs show a decline followed by a levelling showing that as each new step passes the gradient tends to 0. This means that with each new step the molecule is getting closer to the optimised energy and geometry.
The Optimised file can be found here: https://www.ch.imperial.ac.uk/wiki/images/f/fe/StuBH3_OPT.LOG
Thallium Bromide TlBr3 Optimisation
In order to understand optimisation fully you must understand how larger basis sets work and what happens with different molecules.
For a molecule of TlBr3 the same method is used however a different basis set is used, the LanL2DZ option is slightly more accurate for heavier elements (such as thallium) but is approximate enough for the calculation to take a reasonable amount of time. This molecule must also have its symmetry to be confined as D3H trigonal planar as later analysis requires this symmetry in the optimisation process.
The optimised bond distance is 2.65Å, and the optimised bond angle is 120o.
The literature value for the Tl-Br bond length is 2.52[2] which is close but not completely accurate to the optimisation, this shows that as heavier elements are introduced computation can become less accurate at lower basis sets and methods. Also the bond angle of 120o is in concordance with constraining the symmetry to trigonal planar D3H.
| File Name | TLBR3 OPT INPUT |
| File Type | .log |
| Calculation Type | FOPT |
| Calculation Method | RB3LYP |
| Basis Set | LANL2DZ |
| Charge | 0 |
| Spin | Singlet |
| E(RB3LYP) | -91.21812851 a.u. |
| RMS Gradient Norm | 0.00000090 a.u. |
| Imaginary Freq | |
| Dipole Moment | 0 Debye |
| Point Group | D3H |
| Cpu Time | 43.0 seconds |
The summary shows that the final gradient is very close to 0 showing the optimisation has been successful.
According to the frequency analysis the vibrations of the centre of mass of the molecule were an order of magnitude lower then the lowest real mode of vibration which was at 46.567. The frequency analysis is used to show how accurate the molecule optimisation is, and in this case it is relatively accurate.

Occasionally the bonds will be missing from a molecule, this is as Gaussview has a limited range of bond lengths in its system and once a bond length goes beyond a specific level the visable bond disappears.
The bond however is still there as a bond is nothing more than the forces of attraction that hold a molecule together, these may be ionic, covalent, metallic or even intermolecular. Just because it is not visible on the system doesn't mean the atoms aren't being held together.
The Optimisation file can be found here: https://www.ch.imperial.ac.uk/wiki/images/3/30/StuTLBR3_OPT_INPUT.LOG
Borane BH3 Analysis
Molecular Orbitals
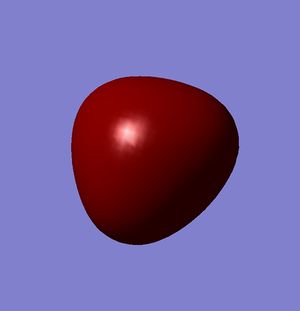
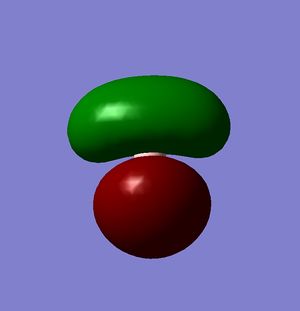
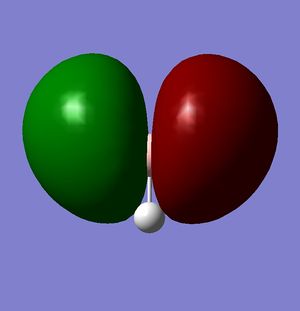
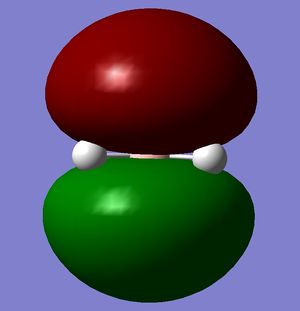
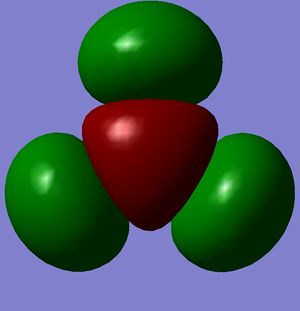
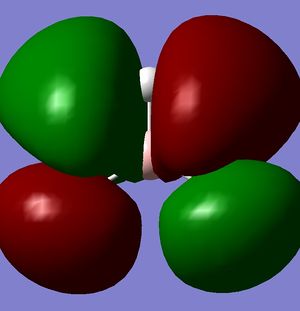
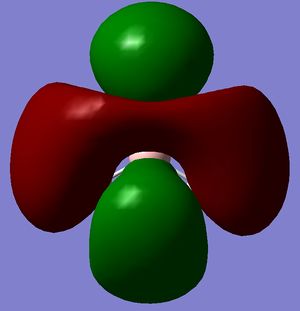
A molecular orbital analysis was then carried out on the BH3 molecule[3].
| A | B | C | D | |
|---|---|---|---|---|
| MO's | 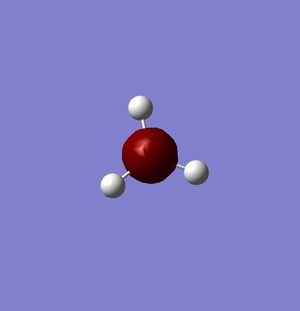 |
 |
 |
 |
| Relative Energy | -6.73049 | -0.51765 | -0.35681 | -0.35681 |
| E | F | G | H |
|---|---|---|---|
 |
 |
 |
 |
| -0.07458 | 0.19192 | 0.18859 | 0.18860 |
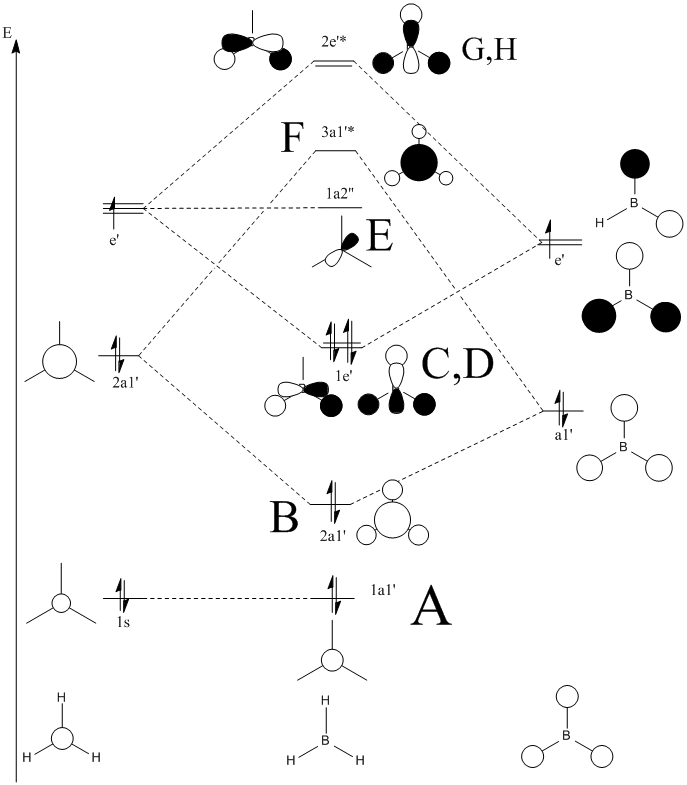
According to these energies there is only one difference between the calculated MO's and the real ones, and that is that the calculated F molecular orbital is higher then the calculated G & H molecular orbitals, whereas my diagram shows it the other way round. This can be explained in two ways.
- That my MO diagram is wrong and the F orbital is actually higher then G & H.
- Or (more likely) that the calculations isn't very accurate at the current basis set and method. The F,G & H orbitals are very close in relative energy and so a more accurate basis set may reveal that the F orbital is actually lower then the G & H.
Natural Bond Orbital (NBO)
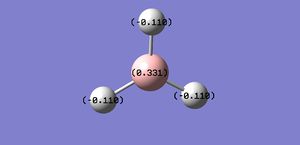
This diagram shows the atomic charges of each of the nuclei. The log file from MO analysis shows alot more NBO analysis data.
Vibrational Analysis
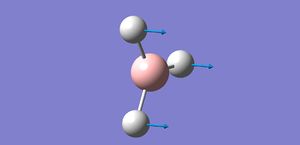
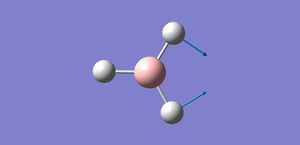
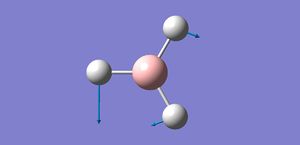
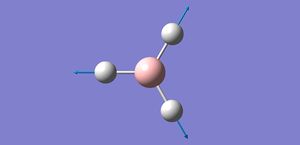
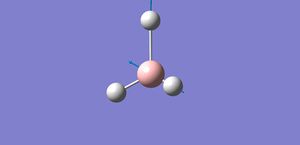
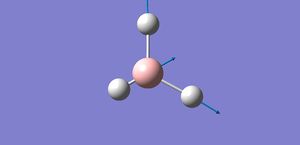
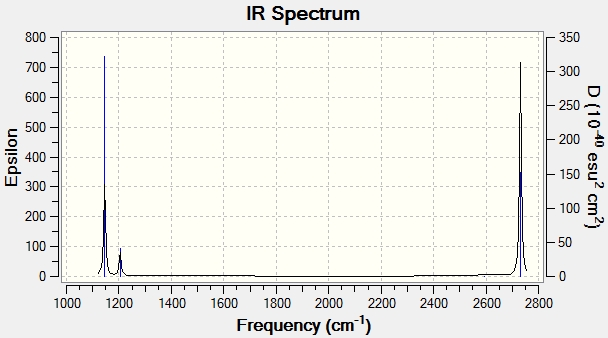
According to the frequency analysis the vibrations of the centre of mass of the molecule were more than an order of magnitude lower then the lowest real mode of vibration which was at 1145.675. The frequency analysis is used to show how accurate the molecule optimisation is, and in this case it is very accurate.
This IR shows only 3 peaks, this is explained as one of the vibrations has an intensity of 0 and so wouldn't appear, also vibration 5 & 6; and vibration 2 & 3 are at similar energies and therefore would overlap together.
Cis/Trans Isomers of Mo(CO)4(PPh3)2 Optimisation & Analysis
In this section I will be computing the spectral characteristics of two isomers of a molecule, showing which isomer is more stable etc.
For this optimisation I will be using the same method but for the basis set the LanL2MB is first used to clean the molecule up as its a less accurate basis set. Then the LanL2DZ is used to optimise the molecule further after ensuring the right conformations of the phosphorus groups.
Optimised Cis Isomer of Mo(CO)4(PPh3)2[4]
| File Name | Cis Optimal |
| File Type | .log |
| Calculation Type | FOPT |
| Calculation Method | RB3LYP |
| Basis Set | LanL2DZ |
| Charge | 0 |
| Spin | Singlet |
| E(RB3LYP) | -623.57707177 a.u. |
| RMS Gradient Norm | 0.00004393 a.u. |
| Imaginary Freq | |
| Dipole Moment | 1.3074 Debye |
| Point Group | C1 |
| Cpu Time | 38 mins 28.6 seconds |
Optimised Trans Isomer of Mo(CO)4(PPh3)2[5]
| File Name | Trans Optimal |
| File Type | .log |
| Calculation Type | FOPT |
| Calculation Method | RB3LYP |
| Basis Set | LanL2DZ |
| Charge | 0 |
| Spin | Singlet |
| E(RB3LYP) | -623.57592150 a.u. |
| RMS Gradient Norm | 0.00003324 a.u. |
| Imaginary Freq | |
| Dipole Moment | 0.0111 Debye |
| Point Group | C1 |
| Cpu Time | 1 hour 2 mins 19.4 seconds |
Both Optimisations show a gradient of near to zero and so both optimisations have proceeded to completetion.
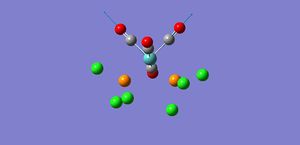
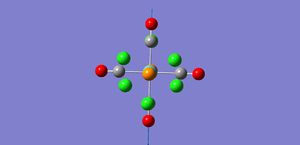
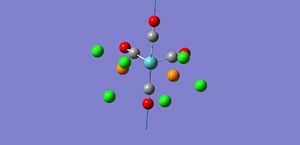
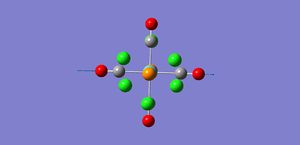
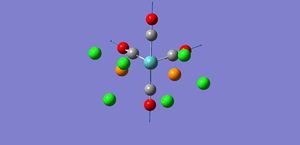
The frequency analysis was also carried out on both the cis isomer[6] and the trans isomer[7]. The analysis of these vibrations is shown in the section below.
Cis/Trans Isomers of Mo(CO)4(PPh3)2 Discussion
| Cis Isomer | Trans Isomer |
|---|---|
 |
 |
 |
 |
 | |
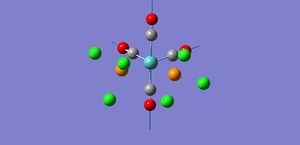 |
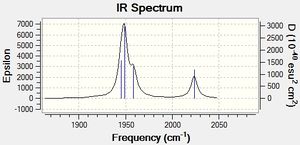
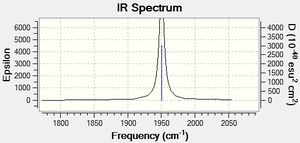
As shown by the trans isomer vibration there are two degenerate CO stretches. Each is the anti of the other in terms of stretches and the marginal difference in frequency is due to calculatory error due to lesser basis sets. The cis isomer is a bit different and has 4 separate vibrations.
The free CO frequency for vibration is approximately 2150cm-1 but the exact frequency of vibration depends upon the back bonding from the metal and its ligands[8]. A larger amount of back bonding from the metal will result in a lower wavenumber stretching frequency. As the trans isomer is symmetrical the carbonyls all experience the same amount of back bonding giving rise to only one CO vibrational peak in the IR. However the cis isomer is no longer symmetrical and so each CO experiences a differing amount of back bonding. Another effect that may be affecting the CO ligand stretching in the cis complex is the "cis effect"[9]. The cis effect is similar to the trans effect in that the substituents surrounding ligands can have their bonds altered in some way by cis ligands, this may also help to explain why there are 4 CO vibrational frequencies.
Judging by the very small difference in energy between the two molecules (-623.57592150 for trans and -623.57707177 for cis) and that the vibrations are also very similar in energy I would say that neither molecule is particularly more stable. However if the Cl's were to be changed with more bulky groups the cis isomer would be at a higher energy due to steric clashes between the bulky groups. Unfortunatly I did not have time to investigate this effect further.
Mini-Project - Heteroatom Silanes & Organic Silanes
In this mini project I will be investigating how changing the middle atom in a silane chain affects the stability and other features. Then I will be investigating the siloxane further to try to explain why siloxanes have massive stability. (In this experiment I will be replacing the hydrogens with chlorines in order to simplify the experiment as hydrogens can be hard to compute for)
The log files for each optimisation can be found here: https://www.ch.imperial.ac.uk/wiki/images/7/71/StuSI-SI-SIINPUT.LOG https://www.ch.imperial.ac.uk/wiki/images/7/71/StuSI-C-SIINPUT.LOG https://www.ch.imperial.ac.uk/wiki/images/7/71/StuSI-N-SIINPUT.LOG https://www.ch.imperial.ac.uk/wiki/images/7/71/StuSI-O-SIINPUT.LOG
| Si-Si-Si | Si-C-Si | Si-N-Si | Si-O-Si | |||||||||||||
|---|---|---|---|---|---|---|---|---|---|---|---|---|---|---|---|---|
|
|
|
| |||||||||||||
| Basis Set | LanL2DZ | LanL2DZ | LanL2DZ | LanL2DZ | ||||||||||||
| Charge | 0 | 0 | 0 | 0 | ||||||||||||
| Spin | Singlet | Singlet | Singlet | Singlet | ||||||||||||
| E(RB3LYP)(a.u.) | -131.46846391 | -165.59412689 | -167.30141714 | -172.92180704 | ||||||||||||
| RMS Gradient Norm (a.u.) | 0.00001966 | 0.00001185 | 0.00001383 | 0.00008043 | ||||||||||||
| Dipole Moment (Debye) | 0.0736 | 0.4318 | 0.5021 | 0.0159 | ||||||||||||
| Point Group | C1 | C1 | C1 | CS |
The frequency calculations can be found here: https://www.ch.imperial.ac.uk/wiki/images/f/f1/STUARTHAYLOCK_SISISI_FREQ.LOG https://www.ch.imperial.ac.uk/wiki/images/f/f1/STUARTHAYLOCK_SICSI_FREQ.LOG https://www.ch.imperial.ac.uk/wiki/images/f/f1/STUARTHAYLOCK_SINSI_FREQ.LOG https://www.ch.imperial.ac.uk/wiki/images/f/f1/STUARTHAYLOCK_SIOSI_FREQ.LOG
Siloxane
The MO's, NBO, Vibrations and Frequency Analysis of siloxane should help to show why it is the most stable of all the silanes.
Firstly my optimised structure for Si-O-Si shows a linear bond length of 1.64Å which compared with the literature value of 1.61Å[10] shows a very close correlation to calculations. Also a bond length of 1.64Å is approximately 0.2Å away from the single bond length which is why the molecule is shown with double bonds.
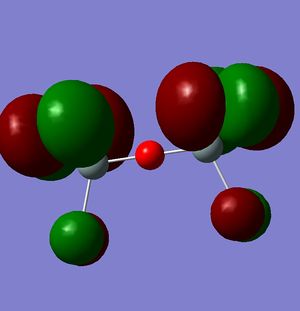
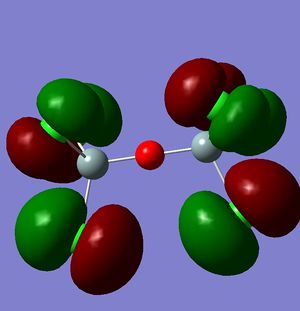
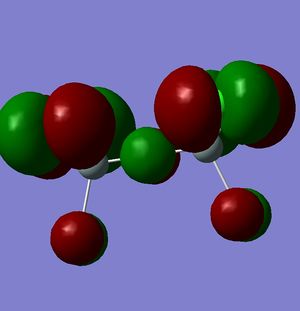
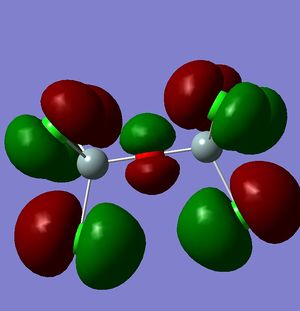
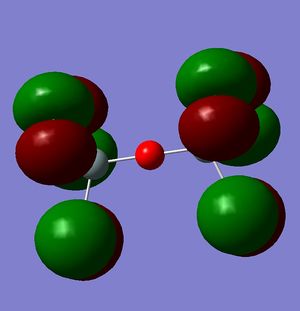
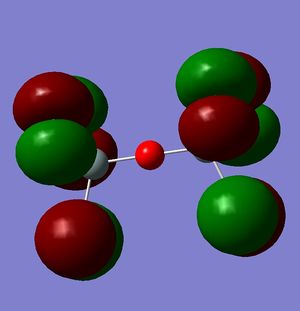
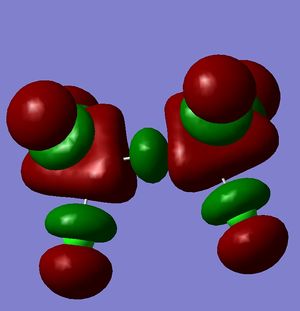
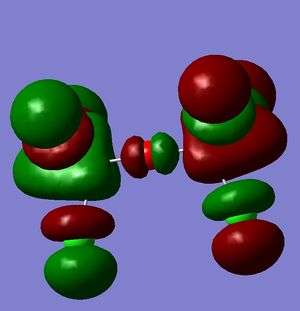
However, this doesn't explain why the structure is linear instead of bent as a normal oxygen molecule is. For this we must look at the MO's[11].
 |
 |
 |
 |
 |
 |
 |
 |
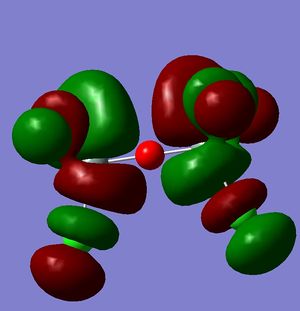 |
These MO's show mostly that the linear bond of Si-O-Si is explained by secondary orbital overlap between the oxygen atom and the chlorine groups on the silicon.
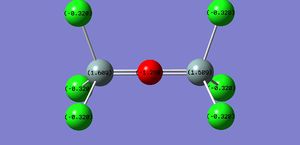
The NBO only shows what we previously knew that most of the charge is localised on the oxygen and chlorine.
The only vibration that affects the Si-O bond is this vibration at 1176.05cm-1 which supports the idea that the molecule is symmetrical and completely linear. The previous literature reference for siloxanes also showed that the 180o siloxanes are possible.
References
- ↑ R. Konechny, D.J. Doren, J. Phys. Chem. B, 1997, 101 (51), pp 10983–10985, DOI:10.1021/jp9726246
- ↑ J. Blixt, J. Glaser, J. Mink, I. Persson, P. Persson, M. Sandstrom, J. Am. Chem. SOC., 1995,117, 5089-5104 DOI:10.1021/ja00123a011
- ↑ DOI:10042/to-5438
- ↑ DOI:10042/to-5481
- ↑ DOI:10042/to-5480
- ↑ DOI:10042/to-5484
- ↑ DOI:10042/to-5485
- ↑ Advanced Inorganic Chemistry F.A. Cotton & G. Wilkinson(5th Edn.) pp. 58 - 62 .
- ↑ L. Cattalini, A. Orio, M.L. Tobe, Inorg. Chem., 1967, 6 (1), pp 75–78, DOI:10.1021/ic50047a016 10.1021/ic50047a016
- ↑ L. Pauling, American Mineralogist, Volume 65, pages 321-323, 1980
- ↑ DOI:10042/to-5497


